Abstract
Magnetic Resonance Poroelastography (MRPE) is introduced as an alternative to single-phase model-based elastographic reconstruction methods. A three-dimensional (3D) finite element poroelastic inversion algorithm was developed to recover the mechanical properties of fluid-saturated tissues. The performance of this algorithm was assessed through a variety of numerical experiments, using synthetic data to probe its stability and sensitivity to the relevant model parameters. Preliminary results suggest the algorithm is robust in the presence of noise and capable of producing accurate assessments of the underlying mechanical properties in simulated phantoms. Further, a 3D time-harmonic motion field was recorded for a poroelastic phantom containing a single cylindrical inclusion and used to assess the feasibility of MRPE image reconstruction from experimental data. The elastograms obtained from the proposed poroelastic algorithm demonstrate significant improvement over linearly elastic MRE images generated using the same data. In addition, MRPE offers the opportunity to estimate the time-harmonic pressure field resulting from tissue excitation, highlighting the potential for its application in the diagnosis and monitoring of disease processes associated with changes in interstitial pressure.
Index Terms: MR elastography, poroelasticity, inverse problems, finite element method
I. Introduction
MAGNETIC resonance elastography (MRE) [1] estimates the mechanical properties of living tissue by exploiting the rich nature of MR detected motion data. This technique commonly employs a phase-contrast pulse sequence in concert with motion encoding gradients (MEGs) to record volumetric time-harmonic displacement data [2]. A set of constitutive equations is then used to relate the measured displacements to the relevant mechanical parameters in the underlying mechanical model.
Initial investigations of in vivo tissue using MRE have primarily applied constitutive relations that describe the mechanical behavior of single-phase, homogeneous, linearly elastic, isotropic media, relying solely on the perceived stiffness characteristics of the tissue for generating diagnostic value. However, brain and other tissues have long been recognized to display time-dependent deformation not described by linear elasticity [3]. In a recent study investigating the mechanical properties of brain using MRE, Kruse et al. (2008) [4] summarized the considerable variability of in vivo and ex vivo measurements of brain tissue properties reported in the literature. The lack of agreement suggests that more sophisticated mechanical models may be required to describe the deformation behavior of brain and other tissues.
Lately, interest in recovering viscoelastic properties of tissue with MRE has emerged. Specifically, viscoelastic theory has been used to model breast [5], [6] and liver [7]-[9], as well as brain deformation in human [10]-[12], rodent [13], [14] and porcine subjects [15]. In addition, Sinkus et al. (2005) [16] have investigated the anisotropic and viscous properties of human breast tissue through a combined model. While quasistatic poroelastic descriptions of brain have been used to model hydrocephalus [17]-[20], edema [21]-[23], and brain shift occurring during stereotactic neurosurgery [24]-[26], investigation of the poroelastic properties of tissue using time-harmonic MRE has been limited to date. In a recent study, Perriñez et al. (2009) [27] showed that simple elastic assumptions are inadequate for assessing the mechanical properties of poroelastic media with current time-harmonic MRE imaging protocols, and led to effective parameter distributions resulting from the complex interactions between the solid and fluid phases that were difficult, if not impossible, to predict or interpret.
As described by Biot (1941) [28], linear poroelastic materials are composed of a porous, compressible, linearly elastic, isotropic solid matrix and a viscous penetrating fluid. Unlike viscoelastic materials whose time-dependent behavior is linked inextricably to the damping characteristics of the viscous solid, the mechanical response of poroelastic materials is governed by time-dependent deformation which is caused by the resistance to fluid-flow through a series of interconnected pores from an applied or induced pressure gradient. In this model, the inability for significant fluid-flow to occur during mechanical deformation results in the nearly incompressible behavior of the bulk material commonly associated with biological tissues. While viscoelasticity and anisotropy are expected to contribute to the observed deformation behavior, models based solely on these equations do not consider the fluid-phase present in vivo. Poroelastic modeling is an alternative to traditional single-phase models, which offers an ability to de-couple the mechanical characteristics related to tissue structure from those related to fluid content or fluid pressure. The model presented here is a necessary first step toward a mathematical description that is more consistent with tissue structure, and upon which more advanced constitutive models may be derived by considering viscoelasticity, anisotropy, and other nonlinear effects.
Recently, poroelastic models have been applied to tissue imaging to study the quasistatic deformation behavior of fluid-saturated porous media. Poroelastography [29] has been developed as an ultrasound technique that serves to quantify the radial-to-axial strain ratio distribution of poroelastic materials during stress relaxation. Assuming the observed motion occurs only in-plane, images can be produced from pre- and post-compression estimates of the axial and radial strain. While individual images generated using this approach are referred to as instantaneous or effective Poission’s ratio (EPR) elastograms, time-sequenced sets are known as poroelastograms. Righetti et al. (2004) [30] demonstrated the feasibility of generating poroelastograms in both tofu and tissue samples. In 2005, the group [31] outlined a methodology for imaging the time-constant associated with EPR elastograms as well as the permeability of porous media. Fortin et al. (2003) [32] and Righetti et al. (2007) [33] have shown the feasibility of using poroelastographic techniques to investigate the deformation of articular cartilage and to differentiate between normal and lymphedematous tissues, respectively. In addition, Berry et al. (2006) [34], [35] introduced a model-based parameter reconstruction that employed KLM biphasic theory [36] to predict the time-dependent radial strain for poroelastic tissues undergoing sustained unconfined compression. While accounting for inherent tissue nonlinearity or viscoelasticity with more sophisticated mechanical models may be possible in the future, reconstructions such as those proposed by Berry et al. (2006) are limited by the use of 2D strain fields, the assumption of tissue homogeneity, and poor signal to noise ratios. Though some studies have investigated the potential for using 3D ultrasound to capture the volumetric strain fields necessary to fully characterize the mechanical behavior of soft tissue in vivo [37], [38], unlike MRE, current ultrasound methods are unable to sample displacements in three directions with equal accuracy and precision. Further, non-uniqueness restricts the independent parameters to an effective Poisson’s ratio and the product of modulus and permeability, which may limit the diagnostic value of the recovered images.
Magnetic Resonance Poroelastography (MRPE) is potentially a very exciting alternative to single-phase MRE methods. Based on the two-phase equations of dynamic poroelasticity [39], [40], MRPE employs constitutive relations that describe the mechanical behavior of an elastic matrix and penetrating pore fluid, allowing for a model that is more representative of tissue structure and physiology. The poroelastic reconstruction algorithm presented in the following sections recovers the elastic properties of the solid matrix while at the same time producing an estimate of the time-harmonic pore-pressure distribution resulting from mechanical excitation. The promise of this approach includes a more accurate description of tissue deformation at amplitudes and frequencies relevant to MRE, leading to enhanced sensitivity to changes is tissue structure, and the opportunity to exploit variations in the estimated time-harmonic pressure distribution as an additional contrast mechanism of potential diagnostic value.
While poroelasticity has been investigated in the setting of ultrasound elastography, to the best of our knowledge, this paper reports the first attempt to form reconstructed 3D images from volumetric displacement data obtained with MR in a porous medium. Specifically, we describe the details of a new subzone algorithm which is based on the time-harmonic poroelasticity equations and evaluate the accuracy of the estimation method in recovering the properties of inclusions of varying sizes as a function of noise level and assumed hydraulic conductivity using synthetic data. We also show images reconstructed from experimental measurements obtained from a single inclusion phantom. The results demonstrate the basic feasibility of MRPE and lay the foundation for future work to evaluate and optimize the technique in more extensive phantom and in vivo studies.
II. Methods
A 3D finite element algorithm developed by Perriñez et al. (2007) [41] was used to solve the dynamic poroelasticity equations for the fully complex time-harmonic displacement field and pore-pressure distribution given prior knowledge of the mechanical and fluid properties describing a problem domain. Here, a reconstruction algorithm has been developed to estimate the poroelastic parameter distributions through the finite element nonlinear inversion scheme outlined in Section II-C. Simulated data was generated to assess the reconstruction algorithm’s performance. A poroelastic phantom comprised of soft tofu and gelatin was used to validate the process experimentally.
A. Forward Problem
The coupled set of equations describing the 3D time-harmonic deformation behavior of a fully saturated poroelastic medium composed of a porous compressible linearly elastic solid matrix and a viscous incompressible penetrating fluid may be expressed in partial differential equation (PDE) form [40] as,
| (1a) |
| (1b) |
where u‾ is the complex time-harmonic displacement field with components u, v, and w, p‾ is the complex time-harmonic pore-pressure field, μ and λ are Lame’s constants of the drained matrix material, ρ and ρf represent the bulk density and the pore-fluid density, respectively, and ω is the excitation frequency. The parameter β is defined as,
| (2) |
where, ϕ is the material porosity, κ is the hydraulic conductivity, and ρa is the apparent mass density. Written in terms of displacement, (1) can be discretized in matrix form as a stiffness matrix A, solution vector χ˄, and a forcing vector b, facilitating the finite element solution,
| (3) |
Here, χ˄ is defined as,
where N represents the total number of discrete locations (nodes) in the computational domain. The reader is referred to Perriñez et al. [27] for a more complete description of the numerical model. The notation used in this paper was chosen to be consistent with the development of the inversion problem presented in Section II-C.
B. Nonlinear Image Reconstruction
The image reconstruction process requires a set of measured data, y, an estimate of the desired parameter distribution, θ, and a relationship between the measured behavior and the underlying parameter space, e.g. y = f(θ). PDE-based elastographic reconstruction algorithms such as those described by Van Houten et al. [42], [43], are generally expressed as a minimization of the error occurring between the measured data and those computed using the model equations where,
| (4) |
and F is defined as,
| (5) |
Minimization is achieved by setting the derivatives of the objective function with respect to the model parameters equal to zero. The resulting system of nonlinear equations may be solved using the Gauss-Newton method, leading to the recursion relation,
| (6) |
where δn is a factor influencing the step size of the gradient descent process, is the Jacobian or sensitivity matrix J, and is the approximate Hessian matrix (H). Formation of H generally yields an ill-conditioned matrix not suited for direct inversion. However, inversion can be achieved through addition of a regularization term, typically to the matrix diagonal (α), often scaled to a normalized value in a manner described by Marquardt et al. (1963) [44]. Thus, equation (6) can be written more concisely as,
| (7) |
In addition, spatial filtering may be applied to suppress the effects of measurement noise on the local variability of the parameter estimates in the manner described by Doyley et al. (2000) [45]. This filtering process smoothes the computed elastic parameter distributions by calculating a weighted average of the values directly connected to a given node.
C. Inverse Problem
Solving (6) for the parameter updates via the Gauss-Newton formulation requires knowledge of the derivative terms . Operating directly on (1) results in,
| (8a) |
| (8b) |
where θ represents one of the independent variables in (3). Carrying through the partial differentiation operator, (8) become,
| (9a) |
| (9b) |
Substituting u’ for and p’ for we obtain,
| (10a) |
| (10b) |
yielding a set of equations in the same form as (1), but in the derivative quantities and containing two additional terms on the right-hand side. As a result, (10) can be solved in the same manner as (1) using the finite element method. However, generation of the Hessian matrix, H = JTJ, and right-hand side vector, JT (y − f(θ)), requires knowledge of the derivatives of the calculated quantities with respect to the elastic parameters. Here, the solution vector χ˄ replaces the function f(θ) such that,
| (11) |
where, θk represents the value of the desired elastic parameter (μ or λ) at each node k. The Jacobian matrix is ordered in the following format,
The terms of the Jacobian may be obtained directly by differentiating (3) with respect to θk,
| (12) |
Rearranging the terms we are able to solve for the desired derivatives,
| (13) |
While [A]−1 and χ˄ are known from the forward problem solution in (3), the elements of must be derived from the components of A such that,
| (14) |
Following the development of A presented in Perriñez et al. (2009) [27] and expanding χ˄ on the basis set ϕ, the elements of can be written as,
The solution to (7) using H = JTJ will result in a complex-valued set of parameter updates necessitated by the presence of complex data. However, it is desirable to retain a real-valued parameter set for subsequent solutions to the forward problem in accordance with the dynamic poroelasticity model. To achieve this end, the Jacobian matrix is multiplied by its complex conjugate transpose (J*T), yielding a Hermitian or self-adjoint Hessian (HH). Taking the real part, (6) can be re-written as,
| (15) |
ensuring a mathematically-consistent, real-valued parameter update. Lastly, since no pressure data is expected to results from a clinical MRE exam, it will not be available for error calculation via (5). Thus, the terms in the Jacobian matrix containing derivatives of pressure with respect to the desired mechanical parameters are neglected. Further, while it may be possible to treat hydraulic conductivity as an independent parameter, the algorithmic development presented here assumes the distribution is known a priori.
D. Subzone-Based Reconstruction
The algorithm discussed in the previous section calculates a global set of parameter updates across the entire problem domain at each iteration. The global displacement and pressure distributions are computed through (3) using the estimated parameter set as well as measured displacement and estimated pressure boundary information. The computational feasibility of employing this technique was assessed in Perriñez et al. (2009) [46], and the method has been shown to produce both accurate and precise estimates of the solid matrix shear modulus and the time-harmonic pore-pressure distribution with simulated data. However, limited storage capacity restricts global solutions of this type to relatively small problem domains. One way around the computational bottleneck decomposes the global problem domain into a set of smaller overlapping sub-domains or subzones [42]. By redefining the problem as a collection of subzones, the minimization of the objective function in (5) can be rewritten as,
| (16) |
| (17) |
assuming that the sum of minimizations is equivalent to the minimization of the sum over all subzones (Γz) comprising the problem domain (Γ). An algorithm based on this premise was developed, allowing for sufficient spatial resolution while maintaining reasonable computational load. A flowchart representation of the subzone-based algorithm is provided in Figure 1.
Fig. 1.
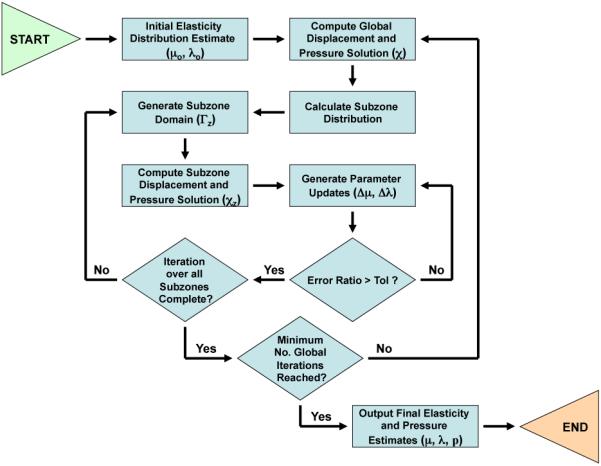
A flowchart representation of the subzone-based poroelastic inversion algorithm.
The internal pressure distribution required at the subzone boundary to drive the inversion is unknown (since no pressure field observations are generated during a clinical MRE exam). However, an estimate of the pressure distribution can be obtained from the solution to the global forward problem (3) based on assumptions regarding the behavior of the pressure field at the global domain boundary. For example, when investigating the breast or brain, it may be reasonable to assume that the skin/meninges will prevent fluid motion normal to the organ surface, corresponding to a pressure boundary condition where . Once the global forward solution has been computed based on the assumed global pressure boundary conditions and the initial estimate of the internal mechanical parameter distributions μ and λ, the resulting internal pressure distribution can then be enforced on each subzone boundary as Dirichlet (Type I) or Neumann (Type II) conditions. While development of Neumann type pressure information at each subzone boundary requires more computational effort, the less restrictive boundary condition may prove beneficial for the iterative reconstruction scheme. However, the work presented here includes only Type I conditions on pressure and displacement on the subzone boundaries.
After partitioning the global domain into a set of overlapping subzones, the 3D displacement and pressure distributions can be computed on each subzone using the current elastic parameter distribution within that domain, the measured displacement data and the estimated internal pressure distribution as boundary information. The mechanical parameter updates on each subzone are generated via (7). The local inversion continues until the ratio of the error between the measured and computed displacement fields to that calculated using the previous iteration’s mechanical parameter distribution is greater than the prescribed tolerance level (thereby indicating that the displacement error on the subzone is no longer being reduced by the minimum amount required per iteration). A tolerance level (Tol) of 0.5 is used in the reconstruction of both simulated and experimental data. The randomized subzone deployment strategy used in the reconstruction is similar to that described by Doyley et al. (2007) [47]. A simplified illustration of the subzone distribution is provided in Figure 2.
Fig. 2.
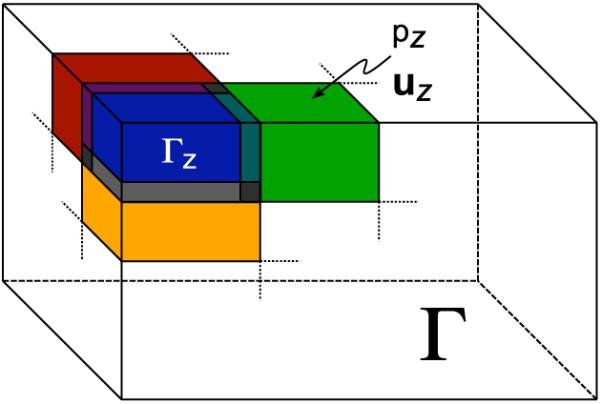
Schematic drawing of the subzone distribution where the global domain (Γ) is decomposed into a series of overlapping subdomains (Γz), involving both displacement and pressure boundary conditions on every subdomain surface.
E. Parallel Computation
Given the added complexity of the poroelastic equations, the potential for increased computation time must be considered. A significant advantage of deconstructing the global problem into a set of smaller subzones is the opportunity for parallel computation. In this approach, multiple processors are invoked to perform the individual subzone inversions in concert, significantly reducing the overall computation time. Unlike traditional parallelization techniques where individual processors are responsible for only a small portion of large matrix calculations, this procedure assigns each processor full responsibility for computation of a small, complete iterative reconstruction task. An implementation of this type has been shown to be effective in reducing runtime by a factor nearly equal to the number of processors involved [48]. Taking advantage of this parallelization strategy, a reconstruction algorithm was developed using the Message Passing Interface (MPI) protocol, to facilitate inter-process communication. The reconstructed property distributions presented in the following sections were computed on a 472 CPU Beowulf/Linux cluster.
F. Simulated Data
To assess the performance of the poroelastic algorithm, an analysis was carried out on a simulated phantom containing three spherical stiffness inclusions (4×μbackground) of varying sizes (1–3 cm diameter) on a central axis along the x-direction. Synthetic data was generated for a 10 cm × 7.5 cm × 4.5 cm poroelastic slab (Fig. 3). A convergence study was performed to determine the appropriate spatial resolution for the finite element mesh. A unidirectional time-harmonic shear excitation with an amplitude of 100 μm was applied to the base of the slab (z = 0) along the x-direction (v = w = 0) at a frequency of 100 Hz. A zero-stress condition was applied to all other surfaces (). Fluid was allowed to flow freely though the top and side surfaces of the slab (p = 0 Pa), but was not allowed to pass through the bottom (). The physical properties used to generate the data are summarized in Table I and are comparable to those presented in [27]. The Poisson ratio of the drained solid (ν) is given instead of λ to emphasize the inherent compressibility of the matrix material. The parameter λ can easily be calculated through the relation, λ = 2μν/(1 − 2ν). The dynamic poroelasticity equations (1) were solved in the manner outlined in Section II-A and the resulting displacement field was corrupted by varying levels of white Gaussian noise (0 – 5%). The noise levels were chosen to reflect the average error in the sinusoidal fit converting the raw MR phase information into displacement maps we have observed in phantom data. Shear modulus and pore-pressure amplitude distributions were obtained from poroelastic reconstructions performed on the same finite element mesh. In addition, the effect of the assumed value for material hydraulic conductivity on the parameter reconstruction was studied by varying the a priori estimate between 1 × 10⁻¹¹ and 1 × 10⁻⁷ m3s/kg.
Fig. 3.
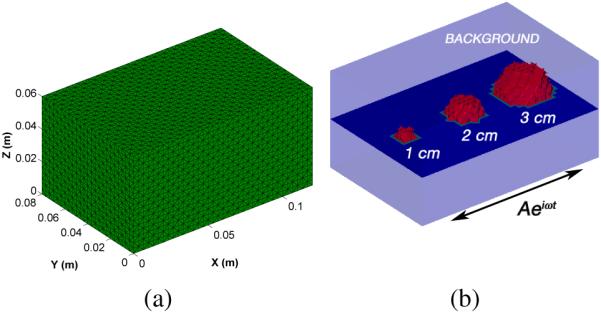
(a) 3D tetrahedral finite element mesh used for analysis of a simulated poroelastic slab (10 cm × 7.5 cm × 4.5 cm) containing three stiffness inclusions (33 127 nodes, 186 624 elements). (b) A horizontal cross-section of the finite element mesh geometry showing the relative size and location of three stiffness inclusions as well as the direction of actuation.
TABLE I.
Model Parameters
| Parameter | μ background | μ inclusion | ν | ϕ | κ | ρ | ρf | ρa |
|---|---|---|---|---|---|---|---|---|
| Value | 3.45 kPa | 13.8 kPa | 0.45 | 0.20 | 1e-9 m3s/kg | 1020 kg/m3 | 1000 kg/m3 | 150 kg/m3 |
G. Poroelastic Phantom
Data was collected for a poroelastic phantom to validate the performance of the poroelastic reconstruction with experimental data. Recently, poroelastic models have been used to approximate the transient mechanical behavior of tofu under sustained loading [30]. In this study, MRE data was acquired for a slab of commercially available soft silken tofu (Mori-Nu Silken Extra-Firm, Morinaga Nutritional Foods, Inc.). The tofu was modeled as a linear, homogeneous, isotropic, poroelastic medium. A 28.5 mm diameter elastic stiffness inclusion was synthesized by pouring liquid gelatin (10% porcine skin gelatin, 300 bloom) into a cylindrical void passing vertically through the center of the slab. The phantom was excited in the z-direction using a pneumatic actuator at a frequency of 100 Hz. A drawing of the tofu phantom is provided in Figure 4. A spin-echo phase contrast pulse sequence with added MEGs was employed to encode the time-harmonic motion (TR = 600 ms, TE = 40 ms). Displacement data was acquired in three orthogonal directions for 16 coronal image slices (x-y plane, 128 × 128 FOV) with 2 mm isotropic voxels (2 mm × 2 mm × 1.8 mm slice thickness w/ a 0.2 mm slice gap). O(101) cycles were allowed prior to motion encoding to ensure the phantom had reached the time-harmonic steady-state [49]. The total imaging time was approximately 10 min for each spatial direction. Because of the 3D nature of the model equations, the reconstruction process does not require that MRE data be acquired in the same plane as the major mode of vibration.
Fig. 4.
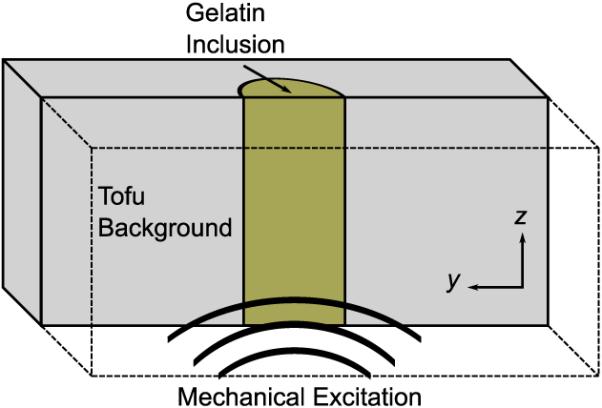
An illustrative drawing of the cross-section of a tofu phantom (10 cm × 7.5 cm × 4.5 cm) containing a 28.5 mm diameter cylindrical inclusion that passes vertically through center of the slab.
Shear modulus reconstructions were performed using both the linearly elastic algorithm described in Van Houten et al. (2001) [43] and the poroelastic algorithm described in Section II-D. The pressure boundary conditions assumed for the poroelastic reconstruction included a no-flow condition () at the actuation surface (z = 0), and free-flow conditions (p = 0 Pa) on all other surfaces. The model parameters used in the reconstructions were those presented in Table I except for the hydraulic conductivity which was assumed to be 1 × 10⁻⁷ m3s/kg.
III. Results
The reconstructions performed on simulated data employed 16 processors for 60 global iterations resulting in an average runtime of approximately 5 hours. Each global iteration was composed of approximately 250 individual iterative subzone calculations containing an average of 550-600 nodes/subzone, and a subsequent solution to the global forward problem.
Figure 5 contains images of the reconstructed shear modulus and pore-pressure amplitude distributions at various noise levels for a single horizontal slice passing through the center of the simulated poroelastic phantom described in Section II-F. The images labeled “Truth” refer to the shear modulus distribution used as input to the forward problem, and the pore-pressure distribution obtained from the solution to the forward problem under the prescribed boundary conditions on displacement and pressure. Figure 6 compares the mean and standard deviation of the recovered shear modulus in the background and in each of the inclusions with the known values provided in Table I. The average reconstructed shear modulus for the background was found to differ from the true value by 2 – 17% across all noise levels. In general, the average reconstructed shear modulus for an inclusion was found to be lower than the true value (0.7 – 27%), with the most significant error observed in the 1 cm inclusion. This was expected as it had the smallest number of nodes comprising the inclusion volume, and therefore, was affected to a greater extent by the spatial filtering process. Lastly, the variability in the reconstructed modulus values was observed to increase with noise level and inclusion volume.
Fig. 5.
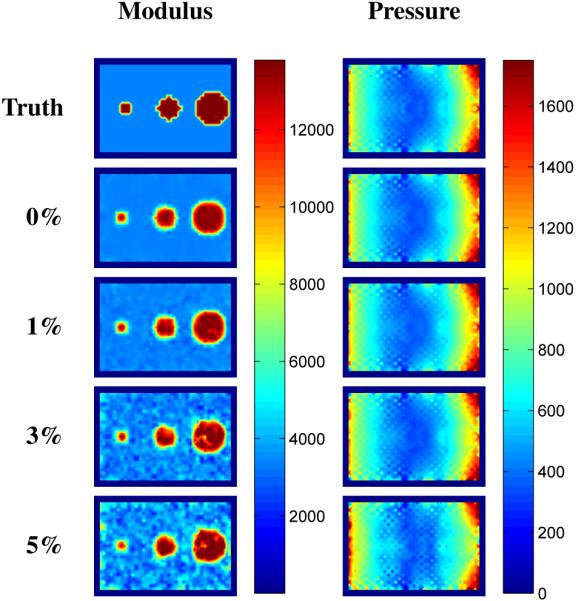
Interpolated shear modulus and pore-pressure amplitude results for a simulated phantom with three stiffness inclusions. Reconstructions were performed on data with 0–5% Gaussian white noise. Images are shown on the same scale and are given in units of [Pa].
Fig. 6.
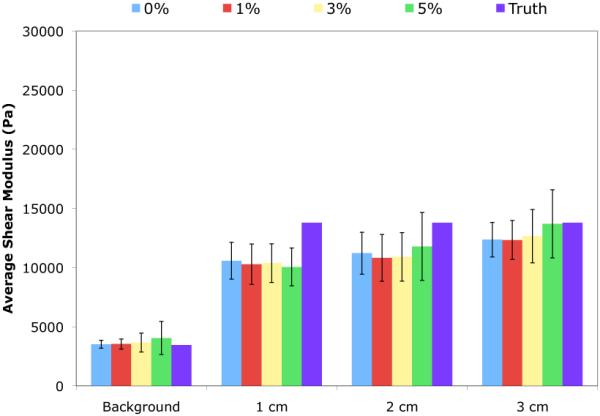
Mean recovered shear modulus values for the background and inclusion volumes for reconstructions performed for the same displacement field corrupted by varying levels of added noise (0–5%).
Figure 7 contains interpolated shear modulus and pore-pressure results obtained for the same simulated phantom reconstructed over a range of assumed hydraulic conductivity values. Shear modulus distributions were clearly overestimated for reconstructions performed using hydraulic conductivities less than 1 × 10⁻⁹ m3s/kg. Some variability in the recovered modulus was observed for hydraulic conductivities greater than the true value, though the inclusions were still visibly apparent in the images. While reasonable estimates of the pore-pressure amplitude distribution were obtained for assumed hydraulic conductivities greater than the true value, the average pore-pressure amplitude was observed to be significantly higher than that of the true distribution when the assumed hydraulic conductivity was less than the true value.
Fig. 7.
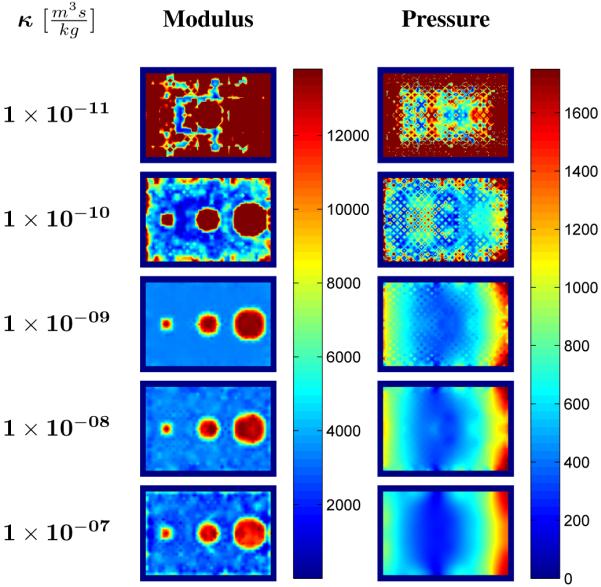
Interpolated shear modulus and pore-pressure amplitude results obtained from the poroelastic reconstruction of simulated data with assumed uniform hydraulic conductivity values ranging between . Images are shown on the same scale and are given in units of [Pa].
Figure 8 contains an image of the real-part of the MRE recorded motion data for a representative coronal slice passing through a tofu phantom with a cylindrical stiffness inclusion in each of the orthogonal encoding directions. Figure 9 contains representative shear modulus and Poisson’s ratio distributions for the tofu phantom obtained from the linear elastic and poroelastic reconstruction algorithms. Also included is the estimated pore-pressure amplitude obtained from the poroelastic reconstruction for the same image slice. The elastic reconstruction shows significant variation in the recovered shear modulus and Poisson ratio across the tofu background and gelatin inclusion. The poroelastic reconstruction was found to provide smoothly varying modulus and Poisson ratio distributions for the tofu matrix representative of the material homogeneity. In addition, the gelatin stiffness inclusion was clearly defined in both images. Mechanical testing of soft tofu and gelatin samples via the procedure described in [27] have shown shear modulus values to vary between 500–600 Pa for tofu and 3–6 kPa for 10% gelatin, respectively. The estimated pore-pressure amplitude appears to be a reasonable assessment of the pressure variation given the nature of the applied boundary conditions on pressure and the major mode of vibration (in and out of the image plane as described in Section II-G). Further, the total reconstruction time was found to be approximately 2 hours for the linearly elastic algorithm and approximately 2.8 hours for the poroelastic inversion.
Fig. 8.
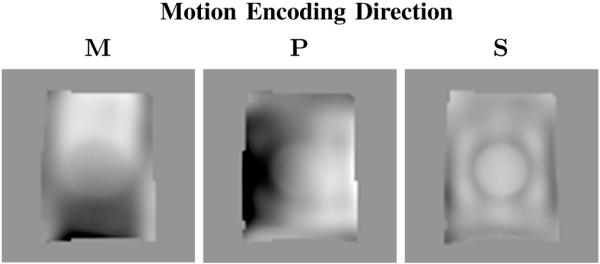
MRE recorded motion (real-part) in each encoding direction for a single coronal slice passing through a tofu phantom containing a cylindrical gelatin inclusion. Note that M, P, and S refer to the frequency, phase, and slice encoding directions, respectively.
Fig. 9.
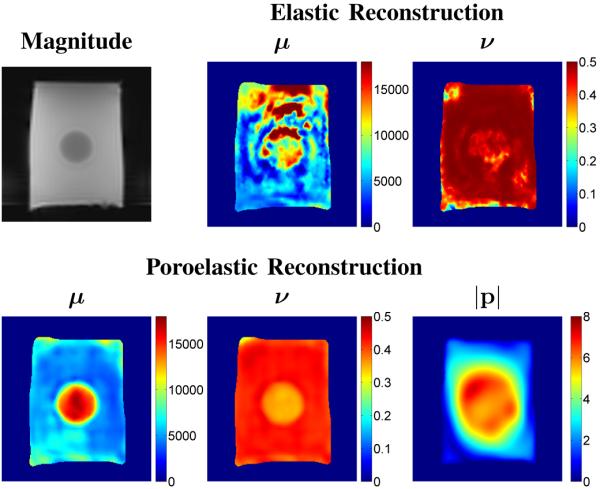
MRE magnitude image and corresponding elastic (shear modulus and Poisson’s ratio) and poroelastic (shear modulus, Poisson’s ratio, and pore-pressure) reconstructions of a tofu phantom containing a cylindrical gelatin inclusion. Images are shown on equivalent scales. Modulus and pore-pressure images and are given in units of [Pa]
IV. Discussion
Images obtained from the poroelastic reconstruction show good recovery of the shear modulus and pore-pressure amplitude across the simulated phantom. While the mean shear modulus value for the background was found to be accurate regardless of noise level, the mean value in each inclusion was slightly lower than the true value. In addition, variability in the reconstructed parameters was observed to increase with increasing noise level. While spatial filtering remains a factor that inhibits the development of sharp boundaries between regions of different moduli, increased accuracy and precision are likely to occur with enhanced data resolution.
A limitation of the poroelasticity reconstruction scheme implemented here is the need for an a priori estimate of the hydraulic conductivity distribution within the material being investigated. Characteristics of the response of the reconstruction algorithm over a range of assumed hydraulic conductivity values depend on the frequency at which the motion was generated and the extent of fluid-flow over a single excitation cycle. By assuming that the hydraulic conductivity is greater than the true value, the resistance to fluid-flow decreases and the calculated deformation behavior becomes dominated by the elastic matrix. Conversely, if the hydraulic conductivity is assumed to be smaller that the true value, the resistance to fluid-flow increases and the calculated deformation behavior is expected to emulate an incompressible elastic solid, which can lead to mechanical resonance or other numerical instabilities. Future studies are likely to explore the possibility of recovering hydraulic conductivity as an independent parameter. This will be done primarily by assessing the stability and sensitivity of an update equation of the form (15) in which the set of unknowns Δθ includes the parameter β. While the success of such an approach remains uncertain, an algorithm of this type may offer additional clinical utility as interstitial hydraulic conductivity is known to vary between normal tissue and solid tumors, and is likely to be influenced by changes in fluid content.
The results from the tofu phantom show that the purely elastic reconstruction was unable to recover the linearly elastic properties of the tofu matrix or the stiffness inclusion, instead yielding an effective modulus distribution resulting from the complex interactions between the solid and fluid phases. This result was expected based on the evaluation in [27] which showed linearly elastic assumptions to be inadequate in describing the deformation behavior of poroelastic media under the time-harmonic conditions applied during MRE. While the inclusion itself is elastic, the measured displacements were likely influenced by the poroelastic background. In contrast, the poroelastic reconstruction was successful in recovering the expected spatial variation in shear modulus between the background and inclusion materials, though disagreement was observed between the recovered values and those determined via mechanical testing. The recovered Poisson ratio distribution from the linearly elastic algorithm suggests the bulk material is nearly incompressible; an interpretation which is expected for a linearly elastic assessment of a fluid-saturated porous medium. Variations observed which indicate more compressibility likely result from the data-model mismatch. The recovered Poisson ratio distribution from the poroelastic algorithm indicates an inherent compressibility of the matrix material. However, the algorithm also incorrectly identifies the gelatin inclusion as being more compressible than the matrix material. This finding can most likely be attributed to the invalid assumption of a uniform hydraulic conductivity across the tofu phantom, and an attempt by the algorithm to fit the model to the measured data. In addition, while the exact variation in pore-pressure resulting from the external mechanical vibration cannot be measured, the algorithm produced a reasonable estimate for the internal time-harmonic pore-pressure distribution based on knowledge of the applied boundary conditions and excitation mode. Further, only a relatively small increase in computation time was observed over the linearly elastic reconstruction despite the need to solve the forward problem on the entire domain at each global iteration.
Possible reasons for the observed differences between the estimated and measured mechanical parameters include effects from temperature (the small samples used in mechanical tests take less time to reach equilibrium), the assumption of a uniform hydraulic conductivity distribution, as well as the assumptions made regarding the boundary conditions on pressure. Further, the values for the tofu background were determined from quasistatic stress-strain curves, yielding a linearly elastic modulus. These values were used for comparison since the linear poroelastic model assumes the matrix material to be purely elastic. However, real materials are expected to have some level of viscoelastic behavior. As a result, the linear poroelastic model is unable to account for all of the damping effects observed in the acquired MRE data, and thus, the reconstructed properties reflect an apparent stiffness as interpreted by the underlying linear poroelastic model. Interestingly, the effect appears to be uniform across the background suggesting homogeneous damping characteristics in the tofu. In spite of the required assumptions, the improvement in image quality over the linearly elastic property distribution is undeniable. The MRPE algorithm shows great promise for matrix stiffness as a more consistent measure of the mechanical properties in fluid saturated tissues. The findings presented here suggest that tissues exhibiting strong poroelastic characteristics are likely to be more appropriately described by model equations that account for both their solid and fluid compartments.
The results from this study demonstrate that the poroelastic inversion algorithm is robust in the presence of noise and able to provide reasonable, accurate estimates of the mechanical properties and pore-pressure amplitude distributions in poroelastic media for an assumed hydraulic conductivity varying over several orders of magnitude. While preliminary results indicate hydraulic conductivity to the dominant parameter influencing the mechanical behavior under the prescribed conditions, future contributions are likely to include a detailed analysis of the algorithms sensitivity to a priori estimates of other experimentally derived parameters including porosity and the apparent mass density. Further, given that MRPE provides a noninvasive method for estimating pore-pressure variation during mechanical excitation, future studies should investigate the effects of local changes in stiffness, hydraulic conductivity, fluid content, hydrostatic pressure and pressure gradient on the recovered pore-pressure distribution and its potential clinical utility as a new diagnostic signature. One potential clinical application for this algorithm is in the differentiation of cerebral atrophy from hydrocephalus. Both disease processes can exhibit an enlarged ventricles, though cerebral atrophy is linked to degeneration of the periventricular white matter, while hydrocephalus is be attributed to an increase in CSF pressure. MRPE may offer the ability to distinguish between presentations by decoupling elastographic signals due to changes in tissue structure from those associated with increased CSF pressure and/or edema.
V. Conclusions
A 3D finite element-based poroelastic inversion algorithm has been developed to estimate the mechanical properties of fluid-saturated media experiencing time-harmonic excitation. MRPE has been introduced as a technique through which the mechanical properties of the solid matrix and the time-harmonic pore-pressure distribution of a porous medium can be estimated by modeling the complex mechanical interactions occurring between the solid and fluid phases. The performance of the algorithm was tested through numerical experiments using simulated data to probe its stability and sensitivity to the relevant model parameters. The results indicate that the algorithm is robust in the presence of noise and is capable of capturing accurate distributions of the underlying mechanical properties and time-harmonic pressure field resulting from material vibration. Phantom experiments were performed using soft silken tofu. The results show that linearly elastic assumptions are inadequate for assessing the mechanical properties of tofu, whereas the poroelastic algorithm is able to successfully characterize the shear modulus of both the background and inclusion.
The poroelastic reconstruction algorithm presented here is expected to facilitate the computation of mechanical property distributions representative of the underlying solid matrix in fluid-saturated tissue. Further, the approach offers a unique opportunity to probe the relationship between tissue deformation and tissue pressure. While other mechanical characteristics of tissue such as viscoelasticity are also likely to influence tissue deformation, disease processes associated with cancer, hydrocephalus, and edema involve changes in fluid content and/or fluid pressure which are likely to augment changes in tissue composition.
Contributor Information
Phillip R. Perriñez, Thayer School of Engineering, Dartmouth College, Hanover, NH 03755 USA
Francis E. Kennedy, Thayer School of Engineering, Dartmouth College, Hanover, NH 03755 USA
Elijah E. W. Van Houten, University of Canterbury, Christchurch, NZ
John B. Weaver, Thayer School of Engineering, Dartmouth College, Hanover, NH 03755 USA. He is also with Dartmouth-Hitchcock Medical Center, Lebanon, NH 03756 USA
Keith D. Paulsen, Thayer School of Engineering, Dartmouth College, Hanover, NH 03755 USA. He is also with Dartmouth-Hitchcock Medical Center, Lebanon, NH 03756 USA, and Norris Cotton Cancer Center, Lebanon, NH 03756 USA.
References
- [1].Muthupillai R, Ehman RL. Magnetic resonance elastography. Nat Med. 1996 May;2(5):601–603. doi: 10.1038/nm0596-601. [DOI] [PubMed] [Google Scholar]
- [2].Weaver JB, Van Houten EEW, Miga MI, Kennedy FE, Paulsen KD. Magnetic resonance elastography using 3d gradient echo measurements of steady-state motion. Med Phys. 2001 Aug;28(8):1620–1628. doi: 10.1118/1.1386776. [DOI] [PubMed] [Google Scholar]
- [3].Fung YC. Biomechanics: Mechanical Properties of Living Tissue. 2nd ed. Springer-Verlag; New York, NY: 1993. [Google Scholar]
- [4].Kruse SA, Rose GH, Glaser KJ, Manduca A, Felmlee JP, Jack CR, Jr., Ehman RL. Magnetic resonance elastography of the brain. NeuroImage. 2008 Jan;39(1):231–237. doi: 10.1016/j.neuroimage.2007.08.030. [DOI] [PMC free article] [PubMed] [Google Scholar]
- [5].Sinkus R, Tanter M, Xydeas T, Catheline S, Bercoff J, Fink M. Viscoelastic shear properties of in vivo breast lesions measured by mr elastography. Magn Reson Imaging. 2005 Feb;23(2):159–165. doi: 10.1016/j.mri.2004.11.060. [DOI] [PubMed] [Google Scholar]
- [6].Sinkus R, Siegmann K, Xydeas T, Tanter M, Claussen C, Fink M. Mr elastography of breast lesions: understanding the solid/liquid duality can improve the specificity of contrast-enhanced mr mammography. Magn Reson Med. 2007 Dec;58(6):1135–1144. doi: 10.1002/mrm.21404. [DOI] [PubMed] [Google Scholar]
- [7].Huwart L, Peeters F, Sinkus R, Annet L, Salameh N, ter Beek LC, Horsmans Y, Van Beers BE. Liver fibrosis: non-invasive assessment with mr elastography. NMR Biomed. 2006 Apr;19(2):173–179. doi: 10.1002/nbm.1030. [DOI] [PubMed] [Google Scholar]
- [8].Salameh N, Peeters F, Sinkus R, Abarca-Quinones J, Annet L, Ter Beek LC, Leclercq I, Van Beers BE. Hepatic viscoelastic parameters measured with mr elastography: correlations with quantitative analysis of liver fibrosis in the rat. J Magn Reson Imaging. 2007 Oct;26(4):956–962. doi: 10.1002/jmri.21099. [DOI] [PubMed] [Google Scholar]
- [9].Asbach P, Klatt D, Hamhaber U, Braun J, Somasundaram R, Hamm B, Sack I. Assessment of liver viscoelasticity using multifrequency mr elastography. Magn Reson Med. 2008 Aug;60(2):373–379. doi: 10.1002/mrm.21636. [DOI] [PubMed] [Google Scholar]
- [10].Klatt D, Hamhaber U, Asbach P, Braun J, Sack I. Noninvasive assessment of the rheological behavior of human organs using multi-frequency mr elastography: a study of brain and liver viscoelasticity. Phys Med Biol. 2007 Dec;52(24):7281–7294. doi: 10.1088/0031-9155/52/24/006. [DOI] [PubMed] [Google Scholar]
- [11].Sack I, Beierbach B, Hamhaber U, Klatt D, Braun J. Non-invasive measurement of brain viscoelasticity using magnetic resonance elastography. NMR Biomed. 2008 Mar;21(3):265–271. doi: 10.1002/nbm.1189. [DOI] [PubMed] [Google Scholar]
- [12].Green MA, Bilston LE, Sinkus R. In vivo brain viscoelastic properties measured by magnetic resonance elastography. NMR Biomed. 2008 Aug;21(7):755–764. doi: 10.1002/nbm.1254. [DOI] [PubMed] [Google Scholar]
- [13].Atay SM, Kroenke CD, Sabet A, Bayly PV. Measurement of the dynamic shear modulus of mouse brain tissue in vivo by magnetic resonance elastography. J Biomech Eng. 2008 Apr;130(2):021013. doi: 10.1115/1.2899575. [DOI] [PMC free article] [PubMed] [Google Scholar]
- [14].Vappou J, Breton E, Choquet P, Willinger R, Constantinesco A. Assessment of in vivo and post-mortem mechanical behavior of brain tissue using magnetic resonance elastography. J Biomech. 2008 Oct;41(14):2954–2959. doi: 10.1016/j.jbiomech.2008.07.034. [DOI] [PubMed] [Google Scholar]
- [15].Vappou J, Breton E, Choquet P, Goetz C, Willinger R, Constantinesco A. Magnetic resonance elastography compared with rotational rheometry for in vitro brain tissue viscoelasticity measurement. MAGMA. 2007 Dec;20(5-6):273–278. doi: 10.1007/s10334-007-0098-7. [DOI] [PubMed] [Google Scholar]
- [16].Sinkus R, Tanter M, Catheline S, Lorenzen J, Kuhl C, Sondermann E, Fink M. Imaging anisotropic and viscous properties of breast tissue by magnetic resonance-elastography. Magn Reson Med. 2005 Feb;53(2):372–387. doi: 10.1002/mrm.20355. [DOI] [PubMed] [Google Scholar]
- [17].Hakim S. Biomechanics of hydrocephalus. Acta Neurol Latinoam. 1971;1(Suppl 1):169–94. [PubMed] [Google Scholar]
- [18].Nagashima T, Tamaki N, Matsumoto S, Horwitz B, Seguchi Y. Biomechanics of hydrocephalus: a new theoretical model. Neurosurgery. 1987 Dec;21(6):898–904. doi: 10.1227/00006123-198712000-00019. [DOI] [PubMed] [Google Scholar]
- [19].Kaczmarek M, Subramaniam RP, Neff SR. The hydromechanics of hydrocephalus: steady-state solutions for cylindrical geometry. Bull Math Biol. 1997 Mar;59(2):295–323. doi: 10.1007/BF02462005. [DOI] [PubMed] [Google Scholar]
- [20].Taylor Z, Miller K. Reassessment of brain elasticity for analysis of biomechanisms of hydrocephalus. J Biomech. 2004 Aug;37(8):1263–1269. doi: 10.1016/j.jbiomech.2003.11.027. [DOI] [PubMed] [Google Scholar]
- [21].Nagashima T, Shirakuni T, Rapoport SI. A two-dimensional, finite element analysis of vasogenic brain edema. Neurol Med Chir (Tokyo) 1990 Jan;30(1):1–9. doi: 10.2176/nmc.30.1. [DOI] [PubMed] [Google Scholar]
- [22].Nagashima T, Tada Y, Hamano S, Skakakura M, Masaoka K, Tamaki N, Matsumoto S. The finite element analysis of brain oedema associated with intracranial meningiomas. Acta Neurochir Suppl (Wien) 1990;51:155–157. doi: 10.1007/978-3-7091-9115-6_52. [DOI] [PubMed] [Google Scholar]
- [23].Nagashima T, Tamaki N, Takada M, Tada Y. Formation and resolution of brain edema associated with brain tumors. a comprehensive theoretical model and clinical analysis. Acta Neurochir Suppl (Wien) 1994;60:165–167. doi: 10.1007/978-3-7091-9334-1_44. [DOI] [PubMed] [Google Scholar]
- [24].Paulsen KD, Miga MI, Kennedy FE, Hoopes PJ, Hartov A, Roberts DW. A computational model for tracking subsurface tissue deformation during stereotactic neurosurgery. IEEE Trans Biomed Eng. 1999 Feb;46(2):213–225. doi: 10.1109/10.740884. [DOI] [PubMed] [Google Scholar]
- [25].Miga MI, Paulsen KD, Hoopes PJ, Kennedy FEJ, Hartov A, Roberts DW. In vivo quantification of a homogeneous brain deformation model for updating preoperative images during surgery. IEEE Trans Biomed Eng. 2000 Feb;47(2):266–273. doi: 10.1109/10.821778. [DOI] [PubMed] [Google Scholar]
- [26].Miga MI, Paulsen KD, Hoopes PJ, Kennedy FE, Hartov A, Roberts DW. In vivo modeling of interstitial pressure in the brain under surgical load using finite elements. J Biomech Eng. 2000 Aug;122(4):354–363. doi: 10.1115/1.1288207. [DOI] [PubMed] [Google Scholar]
- [27].Perrinez PR, Kennedy FE, Van Houten EEW, Weaver JB, Paulsen KD. Modeling of soft poroelastic tissue in time-harmonic mr elastography. IEEE Trans Biomed Eng. 2009 Mar;56(3):598–608. doi: 10.1109/TBME.2008.2009928. [DOI] [PMC free article] [PubMed] [Google Scholar]
- [28].Biot MA. General theory of three-dimensional consolidation. J Appl Phys. 1941 Feb;12(2):155–164. [Google Scholar]
- [29].Konofagou EE, Harrigan TP, Ophir J, Krouskop TA. Poroelastography: Imaging the poroelastic properties of tissues. Ultrasound Med Biol. 2001 Oct;27(10):1387–1397. doi: 10.1016/s0301-5629(01)00433-1. [DOI] [PubMed] [Google Scholar]
- [30].Righetti R, Ophir J, Srinivasan S, Krouskop TA. The feasibility of using elastography for imaging the Poisson’s ratio in porous media. Ultrasound Med Biol. 2004 Feb;30(2):215–228. doi: 10.1016/j.ultrasmedbio.2003.10.022. [DOI] [PubMed] [Google Scholar]
- [31].Righetti R, Ophir J, Krouskop TA. A method for generating permeability elastograms and Poisson’s ratio time-constant elastograms. Ultrasound Med Biol. 2005 Jun;31(6):803–816. doi: 10.1016/j.ultrasmedbio.2005.02.004. [DOI] [PubMed] [Google Scholar]
- [32].Fortin M, Buschmann MD, Bertrand MJ, Foster FS, Ophir J. Dynamic measurement of internal solid displacement in articular cartilage using ultrasound backscatter. J Biomech. 2003 Mar;36(3):443–447. doi: 10.1016/s0021-9290(02)00413-x. [DOI] [PubMed] [Google Scholar]
- [33].Righetti R, Garra BS, Mobbs LM, Kraemer-Chant CM, Ophir J, Krouskop TA. The feasibility of using poroelastographic techniques for distinguishing between normal and lymphedematous tissues in vivo. Phys Med Biol. 2007 Nov;52(21):6525–6541. doi: 10.1088/0031-9155/52/21/013. [DOI] [PubMed] [Google Scholar]
- [34].Berry GP, Bamber JC, Armstrong CG, Miller NR, Barbone PE. Towards an acoustic model-based poroelastic imaging method: I. Theoretical foundation. Ultrasound Med Biol. 2006 Apr;32(4):547–567. doi: 10.1016/j.ultrasmedbio.2006.01.003. [DOI] [PubMed] [Google Scholar]
- [35].Berry GP, Bamber JC, Miller NR, Barbone PE, Bush NL, Armstrong CG. Towards an acoustic model-based poroelastic imaging method: II. Experimental investigation. Ultrasound Med Biol. 2006 Dec;32(12):1869–1885. doi: 10.1016/j.ultrasmedbio.2006.07.013. [DOI] [PubMed] [Google Scholar]
- [36].Armstrong CG, Lai WM, Mow VC. An analysis of the unconfined compression of articular cartilage. J Biomech Eng. 1984 May;106:165–173. doi: 10.1115/1.3138475. [DOI] [PubMed] [Google Scholar]
- [37].Lindop JE, Treece GM, Gee AH, Prager RW. 3d elastography using freehand ultrasound. Ultrasound Med Biol. 2006 Apr;32(4):529–545. doi: 10.1016/j.ultrasmedbio.2005.11.018. [DOI] [PubMed] [Google Scholar]
- [38].Treece GM, Lindop JE, Gee AH, Prager RW. Freehand ultrasound elastography with a 3-d probe. Ultrasound Med Biol. 2008 Mar;34(3):463–474. doi: 10.1016/j.ultrasmedbio.2007.08.014. [DOI] [PubMed] [Google Scholar]
- [39].Biot MA. Theory of propagation of elastic waves in a fluid-saturated porous solid. I. Low-frequency range. J Acoust Soc Am. 1956 Mar;28(2):168–178. [Google Scholar]
- [40].Cheng AH-D, Badmus T, Beskos DE. Integral equation for dynamic poroelasticity in frequency domain with BEM solution. J Engrg Mech. 1991 May;117(5):1136–1157. [Google Scholar]
- [41].Perrinez PR, Marra SP, Kennedy FE, Paulsen KD. In: 3D finite element solution to the dynamic poroelasticity problem for use in MR elastography. 1. Manduca A, Hu XP, editors. Vol. 6511. SPIE; 2007. p. 65111B. [Google Scholar]
- [42].Van Houten EE, Paulsen KD, Miga MI, Kennedy FE, Weaver JB. An overlapping subzone technique for mr-based elastic property reconstruction. Magn Reson Med. 1999 Oct;42(4):779–786. doi: 10.1002/(sici)1522-2594(199910)42:4<779::aid-mrm21>3.0.co;2-z. [DOI] [PubMed] [Google Scholar]
- [43].Van Houten EE, Miga MI, Weaver JB, Kennedy FE, Paulsen KD. Three-dimensional subzone-based reconstruction algorithm for mr elastography. Magn Reson Med. 2001 May;45(5):827–837. doi: 10.1002/mrm.1111. [DOI] [PubMed] [Google Scholar]
- [44].Marquardt DW. An algorithm for least-squares estimation of nonlinear parameters. SIAM J Appl Math. 1963 Jun;11(2):431–441. [Google Scholar]
- [45].Doyley MM, Meaney PM, Bamber JC. Evaluation of an iterative reconstruction method for quantitative elastography. Phys Med Biol. 2000 Jun;45(6):1521–1540. doi: 10.1088/0031-9155/45/6/309. [DOI] [PubMed] [Google Scholar]
- [46].Perrinez PR, Kennedy FE, Weaver JB, Paulsen KD. In: Assessing the feasibility for a poroelastic reconstruction algorithm in MR elastography. 1. Hu XP, Clough AV, editors. Vol. 7262. SPIE; Lake Buena Vista, FL, USA: Feb, 2009. pp. 72 621E–7. [Google Scholar]
- [47].Doyley MM, Feng Q, Weaver JB, Paulsen KD. Performance analysis of steady-state harmonic elastography. Phys Med Biol. 2007 May;52(10):2657–2674. doi: 10.1088/0031-9155/52/10/002. [DOI] [PubMed] [Google Scholar]
- [48].Doyley MM, Van Houten EE, Weaver JB, Poplack S, Duncan L, Kennedy F, Paulsen KD. Shear modulus estimation using parallelized partial volumetric reconstruction. IEEE Trans Med Imaging. 2004 Nov;23(11):1404–1416. doi: 10.1109/TMI.2004.834624. [DOI] [PubMed] [Google Scholar]
- [49].Weaver JB, Van Houten EE, Miga MI, Kennedy FE, Paulsen KD. Acquisition of mr elastography measurements using steady state motion; Proc. of the ISMRM; Denver, CO, USA. Apr 2000.p. 1733. [Google Scholar]


