

Abstract
Several lines of evidence suggest that TRPA1 and TRPV1 mutually control the transduction of inflammation-induced noxious stimuli in sensory neurons. It was recently shown that certain TRPA1 properties are modulated by TRPV1. However, direct interaction between TRPA1 and TRPV1 as well as regulation of TRPA1 intrinsic characteristics by the TRPV1 channel have not been examined. To address these questions, we have studied a complex formation between TRPA1 and TRPV1 and characterized the influence of TRPV1 on single channel TRPA1-mediated currents. Co-immunoprecipitation analysis revealed direct interactions between TRPA1 and TRPV1 in an expression system as well as in sensory neurons. Data generated with total internal reflection fluorescence-based fluorescence resonance energy transfer indicate that a TRPA1-TRPV1 complex can be formed on the plasma membrane. The fluorescence resonance energy transfer interaction between TRPA1 and TRPV1 channels is as effective as for TRPV1 or TRPA1 homomers. Single channel analysis in a heterologous expression system and in sensory neurons of wild type and TRPV1 knock-out mice demonstrated that co-expression of TRPV1 with TRPA1 results in outward rectification of single channel mustard oil (IMO) current-voltage relationships (I-V) and substantial modulation of the open probability at negative holding potentials. TRPV1 also does not influence the characteristics of single channel IMO in Ca2+-free extracellular solution. However, association of TRPA1 with TRPV1 was not affected in Ca2+-free media. To assess a role of intracellular Ca2+ in TRPV1-dependent modulation of TRPA1 modulation, the TRPA1-mediated single channel WIN55,212-2-gated current (IWIN) was recorded in inside-out configuration. Our data indicate that single channel properties of TRPA1 are regulated by TRPV1 independently of intracellular Ca2+. In summary, our results support the hypothesis that TRPV1 and TRPA1 form a complex and that TRPV1 influences intrinsic characteristics of the TRPA1 channel.
Keywords: Calcium, Fluorescence Resonance Energy Transfer (FRET), Protein-Protein Interactions, Single Molecule Biophysics, TRP Channels, Pain, Sensory Neurons
Introduction
Studies using TRPV1- and TRPA1-null mutant mouse lines (1–3), TRPA1 antisense knockdown (4), and in vivo effects of TRPA1 and TRPV1 antagonists (5, 6) have demonstrated that TRPV1 and TRPA1 channels play an important role in the development of hyperalgesia in certain inflammatory and neuropathic pain models.
Like most mammalian TRP channels, TRPV1 and possibly TRPA1 function as homotetramers (7, 8). In addition, TRP channels belonging to the same subfamilies (i.e. the V, C, M, or P subfamilies) can interact and form heteromers (7). It has also been noted that most heteromeric TRP channel complexes appear to consist of subunit combinations only within relatively narrow confines of phylogenetic subfamilies (7). Recent reports indicate that the native TRPA1 channel has characteristics different from those of homomeric TRPA1 expressed in cell lines (9, 10). Interestingly, these characteristics of TRPA1 are restored similarly to characteristics recorded from native cells when TRPA1 and TRPV1 are co-expressed in sensory neurons or expression systems (9). Further, there is evidence suggesting that these channels could heterologously interregulate each other's activities and characteristics. Thus, pharmacological cross-desensitization between capsaicin and mustard oil responses was noted and characterized (10–13). Transmission of inflammatory stimuli by nociceptors (i.e. damage-sensing sensory neurons) is also mutually controlled by TRPA1 and TRPV1 channels (1, 3). It was suggested that this functional interaction between TRPV1 and TRPA1 could occur either indirectly via recruitment of second messengers, such as intracellular Ca2+ ([Ca2+]i) (1, 14), or directly, involving interaction of these channels within a complex (9, 15).
Given previously published results, the present study assesses the following questions: (i) whether TRPA1 and TRPV1 channels could assemble into a complex on the plasma membrane; (ii) whether interactions of TRPA1 with TRPV1 affect intrinsic (i.e. single channel) characteristics of TRPA1-mediated currents; and (iii) whether intracellular Ca2+ and/or TRPV1 channels alone influence the single channel properties of TRPA1.
EXPERIMENTAL PROCEDURES
Animals and Primary Sensory Neuron Culture
Animal use and welfare adhered to the National Institutes of Health Guide for the Care and Use of Laboratory Animals. The animal protocols used in this project were reviewed and approved by the institutional animal care and use committee. Sprague-Dawley rats, 45–60 days old, were obtained from a commercial breeder (Charles River Laboratories, Inc. (Wilmington, MA) or Harlan (Indianapolis, IN)), as were B6.129S4 and B6.129S4-trpV1tml/jul, 40–60 days old, TRPV1 null-mutant mice (2) (The Jackson Laboratory (Bar Harbor, ME)). Trigeminal ganglia (TG)2 neurons were plated at low density on poly-d-lysine/laminin-coated coverslips (Clontech) as described previously (10). The experiments were performed 24–48 h after plating. To achieve reproducible and consistent TRPA1-mediated responses, trypsin treatment of TG was omitted during culturing, and the culture media contained 100 ng/ml of nerve growth factor.
Constructs and Expression in Chinese Hamster Ovary (CHO) Cells
Expression plasmids of green fluorescent protein in pEGFP-N1 (Clontech), TRPV1 (accession number NM031982) in pcDNA3 (Invitrogen) and TRPA1 (NM177781) in pcDNA5/FRT (Invitrogen) were utilized in these studies. These plasmid constructs were delivered into CHO cells using PolyFect (Qiagen, Valencia, CA) according to the manufacturer's protocols. Cells were used within 24–48 h after transfection.
Electrophysiology
Single channel recordings were performed in cell-attached or inside-out configuration at 22–24 °C, from the somata of TG neurons (15–45 picofarads) or CHO cells, as described previously (16, 17). Data were acquired using an Axopatch200B amplifier and analyzed using pCLAMP9.0 software (Axon Instruments, Union City, CA). Currents were filtered with an 8-pole, low pass Bessel filter at 0.1 kHz because dwelling time (τ) of the TRPA1 single current was >0.5 s. The solution for single channel recording of TRP currents was described previously (16). Briefly, the bath solution (SES-SCh) consisted of 140 mm potassium gluconate (for TG neurons or 100 for CHO cells), 4 mm KCl, 1 mm MgCl2, 1 mm EGTA, 10 mm d-glucose, and 10 mm Hepes (pH 7.3). The pipette solution (SIS-SCh) contained 140 mm sodium gluconate (for TG neurons or 100 mm for CHO cells), 10 mm NaCl, 1 mm MgCl2, 2 mm CaCl2, 10 mm d-glucose, and 10 mm Hepes (pH 7.3). Drugs were applied using a fast, pressure-driven, computer-controlled eight-channel system (ValveLink8, AutoMate Scientific (San Francisco, CA)). The base-line activities of the cells were recorded for 1–2 min prior to drug applications. The durations of drug applications are noted in the figure legends. Single channel analyses of traces were performed from the 10th to 30th seconds (or from the 30th to 50th seconds for WIN55,212-2 (WIN)) after commencing drug applications.
Single channel unitary current (i) was determined from the best fit Gaussian distribution of amplitude histograms. Activity was analyzed as NPo = I/i, where I is the mean total current in a patch and i is unitary current at this voltage. Where appropriate, open probability (Po) was calculated by normalizing NPo for the total number of estimated channels (N) in the patch. In order to increase accuracy in measurement of Po, only patches containing fewer than five channels were used.
TRPA1-TRPV1 Co-immunoprecipitation (Co-IP)
The entire coding sequence of TRPA1 (18), excluding the start codon, was used to generate a Myc-TRPA1 construct in pCMV-Myc (Clontech). 2–5 × 10⁷ CHO cells were transfected with equimolar ratios of TRPV1 and TRPA1 or Myc-TRPA1. Co-IP and Western blotting were carried out as described previously (19) on 2-day transfected CHO cells or 2–3-day TG neuronal cultures. Anti-TRPV1 (Oncogene, San Diego, CA), anti-TRPA1 (19), or anti-c-Myc (BD Transduction) antibodies were utilized. The membrane expression of the functional Myc-TRPA1 channel with and without TRPV1 was demonstrated by patch clamp recording of IMO (19).
Total Internal Reflection Fluorescence (TIRF) Microscopy and FRET Measurement
Enhanced CFP and YFP proteins were used in fusion proteins. For all fusion proteins, the start or stop codons were eliminated by PCR mutagenesis. TRPV1 (20) and TRPA1 (18) cDNA were subcloned into pEYFP-N1, pECFP-N1, pEYFP-C1, or pECFP-C1 (BD Biosciences Clontech) to generate fusion proteins with YFP or CFP tagging on C or N termini, respectively. Epithelial sodium channel subunit (αENaC) was tagged with YFP (21). Membrane markers for minimum and maximum interactions were eYFP-M (membrane-bound YFP; Clontech) and Rho-pYC (kindly gifted by Dr. Mark Shapiro (University of Texas Health Science Center, San Antonio, TX)), respectively. Rho-pYC has the C-terminal prenylation site of Rho (RQKKRRGCLLL) added to the YFP-CFP fusion (22).
Fluorescence emissions were collected in living cells at 22–24 °C using TIRF (also called evanescent field) microscopy on an inverted TE2000U microscope equipped with a plain Apo TIRF ×60 oil immersion, high resolution (1.45 numerical aperture) objective. The CFP and YFP fluorophores were excited with a 442-nm Melles Griot dual pulsed solid state and 514-nm argon ion laser, respectively, with an acoustic optic tunable filter used to select excitation wavelengths (Prairie Technology, Middleton, WI). Emissions from CFP and YFP passed through an image splitting device (Dual-View, Optical Insights (Tucson, AZ)) using a 505-nm dichroic filter to split emissions, which then passed through 470 ± 15- and 550 ± 25-nm emission filters, respectively. Fluorescence images were collected and processed with a 16-bit, cooled charge-coupled device camera (Cascade 512F; Roper Scientific Inc.) interfaced with a PC running Metamorph software.
FRET efficiency (%FRET) was measured using the acceptor photobleaching method (23). One advantage of the acceptor photobleaching method is that only the change in CFP fluorescence is used to calculate the %FRET, making it possible to compare the measured FRET generated by multiple studies. Images were acquired for CFP and YFP fluorescence before and after photobleaching. Fluorophore-tagged channels in and near the plasma membrane, as well as membrane markers, were photobleached with TIRF illumination using the argon ion laser (514 nm) at full power for 2 min. We have demonstrated previously preferential photobleaching of membrane proteins in and near the plasma membrane abutting the coverglass versus total cellular pools of the channel with TIRF illumination (24). Total photobleaching was 90.0 ± 0.9% (n = 172). The %FRET was measured by drawing regions of interest around the cell and subtracting background for each image. Laser power, camera gain, and exposure times were constant throughout the course of the experiment except as noted above during photobleaching. %FRET was calculated as the percentage increase in CFP emission after photobleaching YFP,
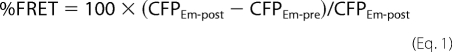 |
where CFPEm-post represents CFP emission after photobleaching YFP, and CFPEm-pre is CFP emission before photobleaching YFP.
Data Analyses
For detailed statistical analysis, GraphPad Prism 4.0 (GraphPad, San Diego, CA) was used. Data are presented as means ± S.E. Experiments were performed at least in triplicate. Significant differences between groups were assessed by unpaired t test (two-condition comparisons). A difference was accepted as significant when p was <0.05. p < 0.05; p < 0.01, and p < 0.001 are indicated by *, **, and ***, respectively.
RESULTS
TRPA1 and TRPV1 Co-immunoprecipitate from an Expression System and Sensory Neurons
To examine whether TRPV1 and TRPA1 channels physically interact, we carried out co-IP of these channels. Anti-Myc was employed for co-IP of TRPA1 and TRPV1 from co-transfected CHO cells. The specific anti-TRPA1 antiserum (10, 19) was used to co-immunoprecipitate the channel from cultured rat TG neurons or wild type (WT) and TRPV1 knock-out (KO) mouse TG neurons.
Fig. 1 shows that Myc-tagged TRPA1 can be co-precipitated with TRPV1 protein and vice versa from Myc-TRPA1- and TRPV1-co-expressing CHO cells. To demonstrate the absence of nonspecific (i.e. outside cells) interaction between the channels, two separately generated lysates from TRPA1- and TRPV1-transfected cells were combined ex vivo to perform co-IP and appropriate Western blotting. The results reflected in line M of Fig. 1 indicate that TRPA1 and TRPV1 interact inside cells but not ex vivo during preparations of lysates or co-IP procedures.
FIGURE 1.
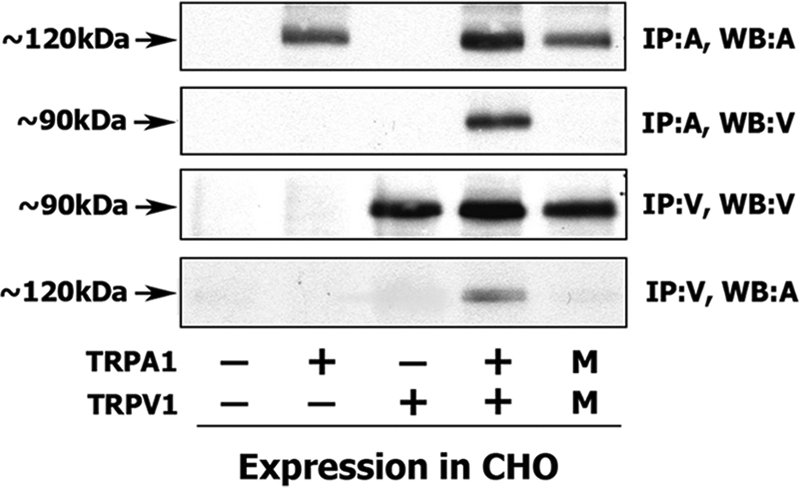
Co-IP of TRPA1 and TRPV1 from CHO cells. Co-IP of Myc-TRPA1 and TRPV1 from transfected CHO cells is shown. Transfected constructs are indicated at the bottom. TRPA1 is Myc-tagged, and TRPV1 is the unmodified TRPV1 channel. Antibodies for IP and Western blots (WB) are indicated at the right. A, antibodies against Myc; V, antibodies against TRPV1. Lane M, independent transfection of Myc-TRPA1 and TRPV1 into separate pools of CHO cells. Afterward, lysates of these pools were mixed and processed ex vivo as indicated (i.e. Western blot and IP noted on the right). Molecular masses of channels are noted.
TRPA1 and TRPV1 could undergo physical interaction due to overexpression in CHO cells or due to the unique intracellular environment of CHO cells. Therefore, we examined interactions of TRPA1 with TRPV1 in native cells, sensory neurons. First, specificity of the anti-TRPA1 antiserum was evaluated. Fig. 2A illustrates that specific labeling of a subset of TG neurons by anti-TRPA1 was blocked with an N-terminal epitope serving as a blocking peptide (BP). The BP also blocked the TRPA1-specific band on a Western blot (see also Ref. 19). We next demonstrated that non-immune serum and protein A beads did not interfere with co-IP of TRPA1 with TRPV1 (Fig. 2C).
FIGURE 2.

Co-IP of TRPA1 and TRPV1 from trigeminal neurons. A, immunolabeling of rat TG frozen sections (20 μm thick) with rabbit polyclonal anti-TRPA1 N-terminal antibody (marked TRPA1) and a mix of anti-TRPA1 and 100 μg/ml blocking peptide (marked TRPA1+BP). Anti-TRPA1 recognizes an N-terminal epitope with the amino acid sequence KRSLRRVLRPEERKE, which serves as a blocking peptide (BP). B, TG lysate (50 μg) was immunoprecipitated with anti-TRPA1 and labeled (WB) with anti-TRPA1 antibody mixed with vehicle (bottom) or blocking peptide (top). Anti-TRPA1 antibody was preincubated with 100 μg of BP. C, control for TRPA1 co-IP. TG lysate was immunoprecipitated with TRPV1 (V1), non-immune serum (Ser), and protein A-agarose beads (Bead) and then labeled with anti-TRPA1 antibodies. D, co-IP of TRPA1 and TRPV1 from cell extract of rat WT or TRPV1 KO TG neurons. Samples not processed by co-IP cell lysates (marked with a minus sign) were derived from TG neurons of corresponding animal lines and were used as loading and positive controls. Antibodies for IP are indicated below the lanes. A1, antibodies against TRPA1; V1, antibodies against TRPV1. Western blot (WB) antibodies are indicated at the right. Molecular mass markers are shown.
Fig. 2D illustrates that TRPA1 and TRPV1 can be co-precipitated from rats and WT mice but not TRPV1 KO TG sensory neurons. It is worth noting that sensory neurons could contain non-interacting TRPA1 and TRPV1. Indeed, co-IP from sensory neuron lysates revealed detectable TRPV1 homomers (Fig. 2D, top middle panel) and, to a lesser extent, TRPA1 homomers (Fig. 2D, bottom middle panel). Altogether, these results demonstrate that TRPA1 and TRPV1 are able to form a tight complex in an expression system as well as in sensory neurons.
TRPV1 and TRPA1 Channels Undergo FRET Interaction on the Plasma Membrane
Co-IP did not determine whether interaction of TRPA1 and TRPV1 could occur on the plasma membrane or only in the cytoplasmic fraction. To investigate the potential for TRPA1-TRPV1 interactions on the plasma membrane of living cells, we measured FRET in transiently transfected CHO cells using TIRF microscopy, which selectively detects fluorophores on and near the plasma membrane (25). We have employed fusion constructs in which CFP and YFP were fused to C termini of the channels because the CHO cells containing YFP-TRPA1 and CFP-TRPV1 generated whole-cell IMO (25 μm; 287 ± 62 pA, n = 6) and ICAP (100 nm; 1023 ± 115 pA, n = 7) at Vh = −60 mV, respectively. In contrast, splicing of CFP and YFP to the N termini of the TRPV1 and TRPA1 channels resulted in much lower sensitivity to CAP (100 nm; 97 ± 25 pA, n = 8) and near insensitivity to mustard oil (MO) (n = 7), respectively.
We first examined possible FRET interactions between TRPV1-CFP and either TRPV1-YFP (positive control) (8), YFP-M (negative controls), or TRPA1-YFP (experiment). Rho-pYC (Fig. 3A, top) and YFP alone were used to measure the maximum and minimum FRET signals. As illustrated in Fig. 3A (bottom) and summarized in Fig. 3B, a significant FRET interaction is detected when TRPV1-YFP is combined with either TRPV1-CFP (homomeric interaction) or with TRPA1-CFP. These data are in accordance with previously published results (8, 27). In contrast, there is no FRET interaction between TRPV1 and YFP-M (Fig. 3A, top). Interestingly, the FRET interaction efficiency between TRPV1 and TRPA1 was similar in magnitude to that between TRPV1 and TRPV1 (Fig. 3B; see also Ref. 27).
FIGURE 3.

FRET interaction between TRPA1 and TRPV1 on the plasma membrane. Images were acquired using TIRF microscopy, which shows fluorophores only on plasma membranes. Images were adjusted to the same pixel range before and after photobleaching. A, representative images for FRET on the plasma membrane between different proteins/channels. Images were collected before (pre bleach) and after bleaching (post bleach). Transfected expression constructs are indicated. The top row of images represents positive and negative controls. The bottom row of images represents the interaction between a variety of combinations of the TRPV1 and TRPA1 channels. B, FRET interaction efficiency calculated for TRPV1-CFP and TRPA1-CFP with either YFP-M, α-ENaC, TRPA1-YFP, or TRPV1-YFP. Statistical analyses used unpaired t tests; *, p < 0.05. Numbers of analyzed cells for each pair of expression constructs are indicated. Error bars, S.E.
We next evaluated FRET interactions between TRPA1-CFP and either TRPA1-YFP (putative positive control), YFP-M and YFP-ENaC (negative controls), or TRPV1-YFP (experiment). YFP-tagged αENaC subunit was used as an additional negative control because this channel belongs to a totally distinct channel family and localized mostly in the kidney (26). As expected, TRPA1 did not produce a significant FRET signal when co-expressed with the YFP-M or YFP-αENaC (Fig. 3, A (top) and B). However, TRPA1 subunits displayed firm interaction within the homomer as well as with TRPV1 regardless of the tagged fluorophores (Fig. 3, A (bottom) and B). Altogether, we conclude that the TRPA1 channel form a complex with TRPV1 subunits, and this complex is spatially localized on the plasma membranes.
Single Channel Properties of IMO in TRPA1- and TRPA1-TRPV1-expressing CHO Cells
Single channel properties of MO responses were characterized in TRPA1 expression systems and sensory neurons (28, 29). To examine modulation of the TRPA1 channel by TRPV1, we recorded and analyzed single channel MO-gated currents (IMO) from TRPA1-expressing and TRPA1-TRPV1-co-expressing CHO cells. Previous research reported that MO failed to activate TRPA1 in excised (inside-out and outside-out) patches (28, 29). Our results generated from recording in both CHO cells and TG neurons confirmed this observation that single channel IMO runs down very quickly (within 0.5 min after drug application) in outside-out and especially in inside-out configurations. Therefore, all recordings of single channel IMO were conducted from intact cells in the cell-attached configuration.
The first set of experiments was conducted in the presence of extracellular Ca2+ included in the pipette solution. Application of MO led to the vigorous activation of channels in TRPA1- and TRPA1-TRPV1-expressing CHO cells (n = 26–28) but not in untransfected CHO cells (n = 6) (Fig. 4, A–C). It was previously reported that single channel IMO in TRPA1-expressing cells has at least four subconductance states that are affected by extracellular Ca2+ (30). The TRPV1 channel also exhibits subconductance states at negative but not positive potentials (16). In agreement with these results, in some TRPA1- as well as TRPA1-TRPV1-expressing cells (20 of 54; Fig. 4, B and C), multiple conductance states ranging from 9 to 16 pS were recorded (Fig. 5, B and C, open circles). The TRPA1 channel was active throughout the range of holding potentials in TRPA1-expressing (Fig. 5A, left) and TRPA1-TRPV1-expressing CHO cells (Fig. 5A, right). The reverse potential of single channel IMO was close to zero (Fig. 5, B and C, black squares). As previously reported (28), the single channel IMO I-V relationships for TRPA1-containing cells showed almost no rectification; the mean slope conductance through positive potentials was 75 ± 4.8 pS (n = 9), and for negative potentials, it was 51.0 ± 3.9 pS (n = 9; Fig. 5B). In contrast, the TRPA1-TRPV1 channels showed outward rectification with a conductance slope of 83.6 ± 3.3 and 35.2 ± 4.2 pS (n = 10), for the outward and inward parts of the I-V curve, respectively (Fig. 5C, black squares). A similar outward rectification of single channel IMO was previously observed in TG sensory neurons (28), which extensively co-express TRPA1 and TRPV1 channels (18, 31, 32).
FIGURE 4.

Mustard oil activates single channel currents in TRPA1- and TRPA1-TRPV1-expressing CHO cells. All recordings were performed in cell-attached configuration in voltage clamp mode. Holding potential (Vh) was −60 mV in A and B and +60 mV in C. MO was applied for 30 s. Representative single current recordings show the effect of MO (25 μm) application on untransfected CHO cells (A, top) and TRPA1-transfected CHO cells (A, bottom). The start of MO application is indicated by an arrow. Expanded scales of the traces generated by MO applied to TRPA1-containing (B) and TRPA1-TRPV1 co-transfected (C) CHO cells are illustrated. c, the closed state. Multiple conductance states (Y1–Y3) are marked. The prolonged all-point amplitude histogram for a TRPA1-TRPV1 co-expressing cell is shown in C (right).
FIGURE 5.

Properties of single channel IMO in TRPA1- and TRPA1-TRPV1-transfected CHO cells. All recordings were performed in cell-attached configuration in voltage clamp mode. MO was applied for 30 s. A, representative traces of single channel IMO (25 μm) recordings at different holding potentials in CHO cells expressing TRPA1 (left panel) or TRPA1-TRPV1 (right panel) channels. The holding membrane potentials are indicated near the traces. c, the closed state. B and C, averaged I-V relationship for single channel IMO (25 μm) in CHO cells expressing TRPA1 (B) and TRPA1-TRPV1 (C). Black squares and open circles, major and subconductance states, respectively. n = 9–10. D and E, summary graph of Po for IMO (25 μm) at +60 and −60 mV in CHO cells expressing TRPA1 (D) and TRPA1-TRPV1 (E). Statistical analyses used the unpaired t tests; *, p < 0.05, n = 6–10. Error bars, S.E.
We next evaluated whether the activation of TRPA1- and TRPA1-TRPV1-expressing CHO cells by MO is voltage-dependent. To test this possibility, we analyzed the Po at +60 and −60 mV. As summarized in Fig. 5, D and E, cells expressing TRPA1-TRPV1 but not TRPA1 alone had greater open probability in the presence of MO at positive voltages. Altogether, in the expression system, single channel conductance of IMO in TRPA1-TRPV1- but not TRPA1-expressing cells exhibits slight outward rectification. Furthermore, a clear voltage-dependent difference in Po at negative potentials was observed only for cells co-expressing TRPA1-TRPV1.
Single Channel Properties of IMO in TRPA1- and TRPA1-TRPV1-expressing Sensory Neurons
To study modulation of TRPA1 single channel properties by the TRPV1 channel in native cells, we recorded IMO in TG sensory neurons from WT and TRPV1 KO mice. In the absence of MO in the bath solution, the patches from WT or TRPV1 KO TG neurons showed almost no basal activity (Fig. 6A, trace 1). Application of MO to the neurons led to activation of single channel currents in 25 of 43 small to medium sized (25–35 picofarads) WT TG neurons and in 18 of 51 TRPV1 KO TG neurons (Fig. 6, A and B). Similarly to the expression system, multiple conductance states of single channel IMO were noted in WT as well as TRPV1 KO TG neurons.
FIGURE 6.

Properties of single channel IMO in TRPA1- and TRPA1-TRPV1-expressing sensory neurons. All recordings were performed in cell-attached configuration in voltage clamp mode. MO was applied for 1–2 min. A, representative single channel IMO (25 μm) traces recorded from WT mouse TG neurons at Vh = +60 mV. c, the closed state. Expanded scales of the trace at points 1 and 2 are illustrated. B, representative single channel IMO (25 μm) traces recorded from WT (top) and KO TRPV1 (bottom) mouse TG neurons. Holding potential and mouse lines are indicated. C, summary graph of IMO open probability at +60 and −60 mV in WT and TRPV1 KO TG neurons. Statistical analyses used unpaired t tests; **, p < 0.01, n = 12 for each bar. Error bars, S.E.
An outward rectification of single channel IMO was observed in the majority of WT TG neurons (95.2 ± 8.7 and 43.3 ± 4.5 pS (n = 14) at +60 and −60 mV, respectively). In contrast, the average single channel IMO conductance revealed no rectification in TRPV1 KO TG neurons (62.8 ± 17.4 and 53.1 ± 16.3 pS (n = 18) at +60 and −60 mV, respectively). It should be noted that variability in IMO conductance in TRPV1 KO neurons was high, with some neurons exhibiting outward and others inward rectification.
We next analyzed single channel IMO activities in WT and TRPV1 KO TG neurons. Fig. 6C summarizes these results and illustrates that IMO exhibits substantially greater activity (i.e. Po) at positive voltages in WT neurons compared with TRPV1 KO neurons. In addition, single channel recordings showed only slight decreases in channel activity in neurons lacking TRPV1 (Fig. 6C, first versus third bar). These data suggest that single channel IMO is regulated by the TRPV1 channel not only in the expression system but in sensory neurons as well.
Single Channel Properties of IMO in a Ca2+-free External Solution
We have previously reported that modulation of certain TRPA1 characteristics by the TRPV1 channel is influenced by physiological concentrations of extracellular Ca2+ (i.e. 2 mm) (9, 10). Conductance of IMO in TRPA1-expressing cells was also 20–30% higher in a Ca2+-free solution (28). Accordingly, we next examined whether removal of extracellular Ca2+ from the pipette solution influences the modulation of single channel IMO by the TRPV1 channel in CHO cells. MO activated single channel currents in Ca2+-free extracellular solution in both TRPA1- and TRPA1-TRPV1-expressing CHO cells (n = 17–29) (Fig. 7A). Unlike in the presence of Ca2+, single channel IMO does not exhibit multiple conductance states in Ca2+-free solution (Figs. 4 and 7A). Dependence of subconductance states from extracellular Ca2+ was previously observed (30). Single channel IMO was recorded at various holding potentials in TRPA1-expressing (Fig. 7A, top) and TRPA1-TRPV1-expressing CHO cells (Fig. 7A, bottom). The reversal potential of single channel IMO in Ca2+-free conditions was close to zero in TRPA1- and TRPA1-TRPV1-expressing CHO cells (Fig. 7, B and C). The single channel IMO I-V relationships exhibited almost no rectification in both TRPA1- and TRPA1-TRPV1-expressing cells (Fig. 7B). Furthermore, in the Ca2+-free solution, the average single channel IMO conductance at positive and negative potentials was not significantly altered by the presence of the TRPV1 channel. Thus, the mean slope conductance for TRPA1 through positive potentials was 84.35 ± 10.57 pS (n = 10), and for negative potentials it was 73.36 ± 7.42 pS (n = 10) (Fig. 7B). Similarly, in TRPA1-TRPV1 cells conductance was 87.13 ± 8.52 pS (n = 9) and 70.91 ± 10.4 pS (n = 7) for positive and negative potentials, respectively (Fig. 7C). Further, in accordance with a previous report (28), conductance of IMO at negative potentials in TRPA1-expressing cells was ∼25% higher in a Ca2+-free external solution.
FIGURE 7.

An external Ca2+-free solution affects single channel IMO in TRPA1 and TRPA1-TRPV1 CHO cells. All recordings were performed in cell-attached configuration in voltage-clamp mode with Ca2+-free pipette solution (i.e. external). MO was applied for 30 s. A, representative traces of single channel IMO (25 μm) recordings at Vh of −60, 0, and +60 mV in CHO cells expressing TRPA1 (top) or TRPA1-TRPV1 (bottom) channels. The holding membrane potentials are indicated near the traces. c, the closed state. B and C, averaged single channel I-V relationship for IMO (25 μm) in CHO cells expressing TRPA1 (B) and TRPA1-TRPV1 (C). n = 6–14. D, summary graph of the Po value for IMO (25 μm) in Ca2+-free pipette solution at +60 and −60 mV in CHO cells expressing TRPA1 and TRPA1-TRPV1, n = 8–11. Error bars, S.E.
We also evaluated whether Ca2+-free extracellular solution affects single channel IMO activity in a voltage-dependent manner (see Fig. 5, D and E). Analyses of Po at +60 and −60 mV are summarized in Fig. 7D. Cells expressing either TRPA1 or TRPA1-TRPV1 exhibited similar IMO open probability at positive (+60 mV) and negative (−60 mV) voltages. Altogether, modulation of single channel IMO characteristics by the TRPV1 channel depends on physiological concentrations of extracellular Ca2+.
We next examined whether extracellular Ca2+ alters association between the TRPA1 and TRPV1 channels. Myc-TRPA1-TRPV1-co-transfected CHO cells were grown in normal Dulbecco's modified Eagle's medium-containing medium, which contains 1.8 mm Ca2+ and Ca2+-free Dulbecco's modified Eagle's medium. In 24 h post-transfection, cell lysates were immunoprecipitated with anti-TRPV1 or anti-Myc antibodies, Western blotted, and labeled with anti-TRPV1 antibodies. Fig. 8A and corresponding bar graphs (Fig. 8B) demonstrated that extracellular Ca2+ did not significantly affect association of TRPV1 with TRPV1. However, a slight decrease in co-IP was noted in co-transfected CHO cells grown in Ca2+-free media (Fig. 8B). In summary, extracellular Ca2+ did not significantly affect the interaction between TRPA1 and TRPV1 channels.
FIGURE 8.
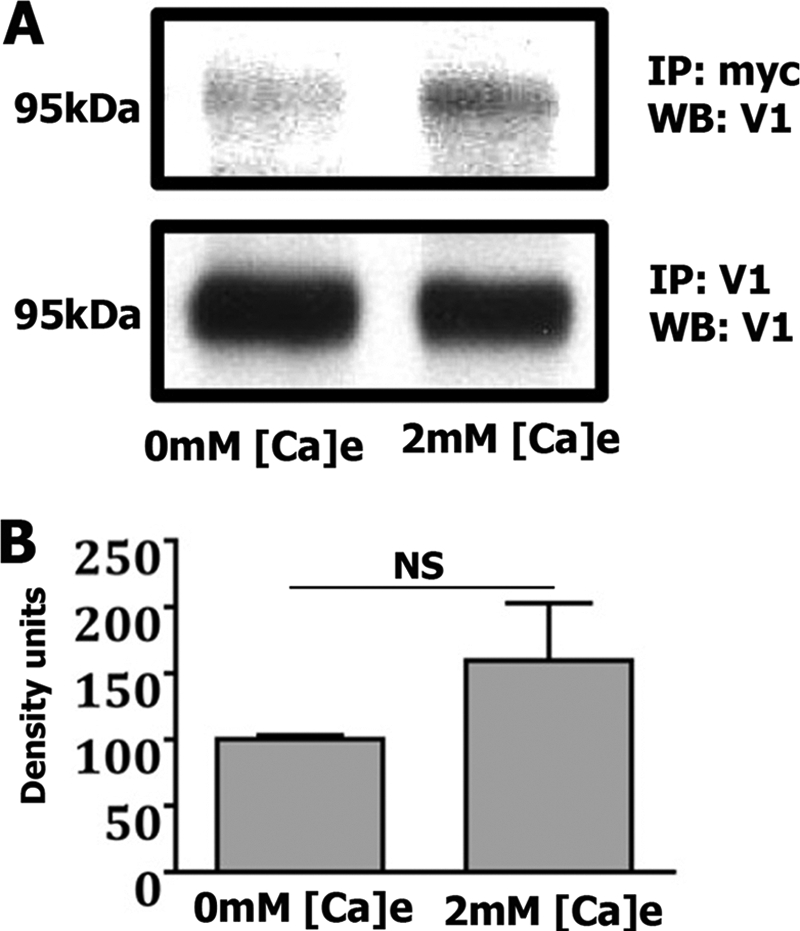
An external Ca2+ does not significantly affect co-IP between TRPV1 and TRPA1 channels expressed in CHO cells. A, co-IP of Myc-TRPA1 and TRPV1 from transfected CHO cells grown in Ca2+-free (0 mm Ca2+) and normal media (2 mm Ca2+). Concentrations of extracellular Ca2+ in media are indicated at the bottom. Antibodies for IP and Western blot (WB) are indicated at the right. The molecular mass of the TRPV1 channel is noted. B, Western blot results normalized to total immunoprecipitated TRPV1, with band densities quantified and expressed as density units. NS, non-significant; p > 0.05, unpaired t tests, n = 3. Error bars, S.E.
Role of the Ca2+-free Intracellular Solution in Regulation of TRPA1 by TRPV1
It has been suggested that elevation in [Ca2+]i by inflammation-induced activation of TRPV1 and/or internal Ca2+ stores may play a key role in functional interaction between TRPA1 and TRPV1 channels (1, 32). The role of [Ca2+]i in TRPA1-TRPV1 interactions could be examined by investigating single channel TRPA1-mediated currents recorded in Ca2+-free bath solution in inside-out configuration. Single channel IMO runs down in inside-out configuration (28, 29). However, it has been reported that other TRPA1 agonists (such as calcium and cannabinoids) can generate prolonged single channel responses even in inside-out configuration (29). Therefore, we used the TRPA1 agonist, cannabinoid WIN (11), for inside-out recording from TRPA1-expressing cells. All experiments were also conducted in a Ca2+-free bath solution because the presence of physiological concentrations of Ca2+ (2 mm) in the bath solution activates TRPA1 in inside-out configuration (14, 29).
WIN-gated inside-out single channel currents (IWIN) in TRPA1- and TRPA1-TRPV1-expressing CHO cells (n = 12–20) were recorded for at least 2 min (Fig. 9A). No significant run-down of activity for single channel IWIN was measured within the recording time (2–3 min). Thus, Po during 20–40 s of WIN application was similar to Po measured during the last 20–30 s of the 2-min treatment. Single channel IWIN in the Ca2+-free bath solution did not exhibit subconductance states either at negative or positive potentials (Fig. 9A).
FIGURE 9.

Inside-out single channel IWIN recordings from CHO cells containing TRPA1 and TRPA1-TRPV1 in a Ca2+-free bath solution. All recordings were performed in inside-out voltage-clamp configuration and in Ca2+-free bath solution. Cannabinoid WIN55,212-2 (WIN) was applied for 1–2 min. A, representative traces of single channel IWIN (25 μm) recordings at three different holding potentials (−60, 0, and +60 mV) in CHO cells expressing TRPA1 (top) or TRPA1-TRPV1 (bottom) channels. The holding membrane potentials are indicated near the traces. c, the closed state. B and C, averaged single channel IWIN (25 μm) recorded from CHO cells expressing TRPA1 (B) and TRPA1-TRPV1 (C). n = 11–16. D, Po for single channel IWIN (25 μm) acquired at +60 and −60 mV from CHO cells expressing TRPA1 and TRPA1-TRPV1. Statistical analyses used unpaired t tests; **, p < 0.01, n = 8–13. Error bars, S.E.
IWIN was recorded in a range of holding potentials in TRPA1-expressing (Fig. 9A, top) and TRPA1-TRPV1-expressing CHO cells (Fig. 9A, bottom). The reversal potential of single channel IWIN in Ca2+-free solution was approximately −5 mV (Fig. 9, B and C). Similarly to single channel IMO recorded in physiological conditions (Fig. 5, B and C), the single channel IWIN I-V relationship in TRPA1-expressing cells exhibited almost no rectification; the mean slope conductance through positive potentials was 50.67 ± 7.85 pS (n = 7), and for negative potentials, it was 43.5 ± 4.63 pS (n = 7; Fig. 9B). In contrast, despite the absence of Ca2+ in the bath solution, IWIN in TRPA1-TRPV1-containing cells showed outward rectification, with a conductance slope of 59.03 ± 5.68 pS (n = 11) and 24.76 ± 2.85 pS (n = 12) for the outward and inward parts of the I-V curve, respectively (Fig. 9C). Furthermore, the examination of single channel IWIN voltage dependence demonstrated that cells expressing both TRPA1 and TRPV1, but not TRPA1 alone, had greater Po at positive voltages (Fig. 9D). Altogether, modulation of intrinsic characteristics of the TRPA1 channel by TRPV1 in this expression system was not influenced by intracellular Ca2+.
DISCUSSION
Recent studies have demonstrated functional interactions between the TRPA1 and TRPV1 channels that involve cross-desensitization between channels and mutual transduction of nociceptive signal during certain inflammatory conditions (1, 3, 10, 11, 33). Furthermore, several whole-cell properties of TRPA1 are regulated by the presence of the TRPV1 channel (9). Such cross-modulation of the biophysical as well as regulatory properties could affect behavior of the channel in a variety of physiological and pathological conditions (34–38). Despite this wealth of research, no study has evaluated whether TRPA1 and TRPV1 channels could assemble into complexes on the plasma membrane, whether association between TRPA1 and TRPV1 depends on extracellular Ca2+, whether interactions of TRPA1 with TRPV1 affect intrinsic (i.e. single channel) characteristics of TRPA1-mediated currents, or whether intracellular Ca2+ and/or TRPV1 channels alone influence single channel properties of the TRPA1 channel.
The present data demonstrate that the TRPA1 and TRPV1 channels can be co-immunoprecipitated from rat and mouse sensory neurons and from the TRPA1-TRPA1 expression system (Figs. 1 and 2D). It appears that interactions of TRPA1 with TRPV1 occur within cells because independently prepared extracts from TRPA1- or TRPV1-expressing cells did not undergo co-IP (Fig. 1). Complex formation between the TRPA1 and TRPV1 was confirmed by an alternative approach, FRET analysis. FRET analysis also demonstrated that the strength of the TRPA1-TRPV1 interaction is comparable with complex tightness measured for TRPA1-TRPA1 as well as TRPV1-TRPV1 homomers (Fig. 3B) (27). Finally, we demonstrated that TRPA1 and TRPV1 form complexes on the cytoplasmic membrane, given that FRET interaction was detected by TIRF microscopy.
We next showed that single channel IMO properties are regulated by the TRPV1 channel in our expression system and in sensory neurons. Co-expression of TRPV1 with TRPA1 led to slight but outward rectification in single channel IMO I-V (Fig. 5) and a significant reduction in open probability for single channel IMO at negative holding potentials (Figs. 5 and 6). TRPV1 regulates whole-cell current-voltage characteristics of the TRPA1 channel (9). Thus, a dramatic outward rectification for the whole-cell I-V relationship of IMO is observed in WT but not TRPV1 KO TG neurons (9) or TRPA1-expressing cells (30, 32). Data presented here suggest that the whole-cell voltage dependence of IMO in WT TG neurons may be mediated by a slight outward rectification of single channel conductance but is primarily mediated by a reduction in Po at negative potentials in TRPA1-TRPV1-co-expressing CHO cells or sensory neurons.
It has been reported that MO-activated responses are larger in sensory neurons containing TRPV1 (9, 10). In addition, whole-cell IMO was recorded from a lesser number of sensory neurons in the absence of TRPV1 (9). We observed single channel IMO in a lesser number of sensory neurons and a slight decrease in channel activity in neurons lacking TRPV1 (Fig. 6C). Because single channel recordings showed only a slight decrease in channel activity in neurons lacking TRPV1 (Fig. 6C), the reduction in magnitude of whole-cell IMO in TRPV1 KO TG (9) could be attributable to a decrease in the density of functionally active TRPA1 channels on the plasma membrane. This decrease in density of TRPA1 on plasma membranes may be explained either by a possible down-regulation of TRPA1 expression in TRPV1 KO mouse TG neurons or by a requirement of TRPV1 for functional stability of the TRPA1 channels on the plasma membranes.
Regulation of TRPA1 properties by TRPV1 is dependent on extracellular Ca2+. Thus, in cells expressing both TRPA1 and TRPV1, Ca2+ substantially suppresses whole-cell IMO (9, 10). Dramatic outward rectification for whole-cell I-V IMO observed in sensory neurons is also influenced by extracellular Ca2+ (9). There are two possibilities to explain this effect; extracellular Ca2+ affects the interaction between TRPA1 and TRPV1, or it directly modulates properties of the TRPA1-TRPV1 heteromer. Here, we showed that extracellular Ca2+ did not significantly alter association of TRPA1 with TRPV1 (Fig. 8). In contrast, single channel recordings of IMO with a Ca2+-free pipette solution (i.e. extracellular solution) illustrated that regulation of certain intrinsic properties of TRPA1 by the TRPV1 channel is Ca2+-dependent. Indeed, single channel IMO characteristics are almost identical when recorded in a Ca2+-free condition from either TRPA1- or TRPA1-TRPV1-expressing cells (Fig. 7). These data imply that external Ca2+ could partially block the influx of Na+ ions into cells. Such a phenomenon when divalent cations block entrance of monovalent cations through pores has been reported for several Ca2+-permeable channels, including TRPV4 (39), TRPV5 (40), and TRPV6 (41).
A functional interaction between TRPA1 and TRPV1 could occur through two possible mechanisms. The first mechanism may involve messengers responsible for communication between TRPA1 and TRPV1 (1). Thus, intracellular Ca2+ was proposed as such a messenger (1). BK-stimulated [Ca2+]i accumulation via depletion of intracellular stores and/or activation of TRPV1 (42, 43) could be activating TRPA1 (14, 44). Single channel IMO regulation by the TRPV1 channel may also be mediated via increases in intracellular Ca2+ and subsequent alterations of single channel characteristics (16, 30). Alternatively, a functional interaction between TRPA1 and TRPV1 channels could take place within a complex independently of soluble messengers. Thus, it is well documented that complex formation between channels can influence single channel characteristics (45–48). To address this question, we investigated TRPA1-mediated single channel currents recorded in inside-out configuration. This allowed for manipulation of intracellular concentrations of soluble factors, including removal of Ca2+. WIN55,212 has been used as a TRPA1 agonist because single channel IWIN does not run-down in inside-out configuration (Fig. 9) (11, 29). Our results from single channel IWIN recorded in inside-out configuration in Ca2+-free bath solution imply that intracellular Ca2+ does not alter TRPV1-dependent regulation of the TRPA1 channel (Fig. 9).
In summary, these data provide evidence supporting a role for TRPV1 modulation of TRPA1 characteristics, most likely through direct interaction of the channels within a complex. This complex formation between TRPA1 and TRPV1 channels may subserve the functional interactions between TRPA1 and TRPV1, leading to regulatory control of transduction for nociceptive signals.
Acknowledgments
We thank Mayur Patil for technical assistance as well as Dr. David Julius (University of California, San Francisco) and Dr. Ardem Patapoutian (The Scripps Research Institute) for kindly providing materials used in this study.
This work was supported, in whole or in part, by National Institutes of Health Grants DE017696 and DE019311 (to A. N. A.) and NS061884 (to N. A. J.). This work was also supported by American Heart Association Grant 0730111N and a Carl W. Gottschalk Research Scholar Grant from the American Society of Nephrology (to A. S.).
- TG
- trigeminal ganglia
- CHO
- Chinese hamster ovary
- IP
- immunoprecipitation
- YFP
- yellow fluorescent protein
- CFP
- cyan fluorescent protein
- TIRF
- total internal reflection fluorescence
- FRET
- fluorescence resonance energy transfer
- WT
- wild type
- KO
- knock-out
- BP
- blocking peptide
- MO
- mustard oil
- pS
- picosiemens
- WIN
- WIN55,212-2.
REFERENCES
- 1.Bautista D. M., Jordt S. E., Nikai T., Tsuruda P. R., Read A. J., Poblete J., Yamoah E. N., Basbaum A. I., Julius D. (2006) Cell 124, 1269–1282 [DOI] [PubMed] [Google Scholar]
- 2.Caterina M. J., Leffler A., Malmberg A. B., Martin W. J., Trafton J., Petersen-Zeitz K. R., Koltzenburg M., Basbaum A. I., Julius D. (2000) Science 288, 306–313 [DOI] [PubMed] [Google Scholar]
- 3.Kwan K. Y., Allchorne A. J., Vollrath M. A., Christensen A. P., Zhang D. S., Woolf C. J., Corey D. P. (2006) Neuron 50, 277–289 [DOI] [PubMed] [Google Scholar]
- 4.Obata K., Katsura H., Mizushima T., Yamanaka H., Kobayashi K., Dai Y., Fukuoka T., Tokunaga A., Tominaga M., Noguchi K. (2005) J. Clin. Invest. 115, 2393–2401 [DOI] [PMC free article] [PubMed] [Google Scholar]
- 5.Petrus M., Peier A. M., Bandell M., Hwang S. W., Huynh T., Olney N., Jegla T., Patapoutian A. (2007) Mol. Pain 3, 40. [DOI] [PMC free article] [PubMed] [Google Scholar]
- 6.McNamara C. R., Mandel-Brehm J., Bautista D. M., Siemens J., Deranian K. L., Zhao M., Hayward N. J., Chong J. A., Julius D., Moran M. M., Fanger C. M. (2007) Proc. Natl. Acad. Sci. U.S.A. 104, 13525–13530 [DOI] [PMC free article] [PubMed] [Google Scholar]
- 7.Schaefer M. (2005) Pflugers Arch. 451, 35–42 [DOI] [PubMed] [Google Scholar]
- 8.García-Sanz N., Fernández-Carvajal A., Morenilla-Palao C., Planells-Cases R., Fajardo-Sánchez E., Fernández-Ballester G., Ferrer-Montiel A. (2004) J. Neurosci. 24, 5307–5314 [DOI] [PMC free article] [PubMed] [Google Scholar]
- 9.Salas M. M., Hargreaves K. M., Akopian A. N. (2009) Eur. J. Neurosci. 29, 1568–1578 [DOI] [PMC free article] [PubMed] [Google Scholar]
- 10.Akopian A. N., Ruparel N. B., Jeske N. A., Hargreaves K. M. (2007) J. Physiol. 583, 175–193 [DOI] [PMC free article] [PubMed] [Google Scholar]
- 11.Akopian A. N., Ruparel N. B., Patwardhan A., Hargreaves K. M. (2008) J. Neurosci. 28, 1064–1075 [DOI] [PMC free article] [PubMed] [Google Scholar]
- 12.Macpherson L. J., Dubin A. E., Evans M. J., Marr F., Schultz P. G., Cravatt B. F., Patapoutian A. (2007) Nature 445, 541–545 [DOI] [PubMed] [Google Scholar]
- 13.Ruparel N. B., Patwardhan A. M., Akopian A. N., Hargreaves K. M. (2008) Pain 135, 271–279 [DOI] [PMC free article] [PubMed] [Google Scholar]
- 14.Zurborg S., Yurgionas B., Jira J. A., Caspani O., Heppenstall P. A. (2007) Nat. Neurosci. 10, 277–279 [DOI] [PubMed] [Google Scholar]
- 15.Akopian A. N., Ruparel N. B., Jeske N. A., Patwardhan A., Hargreaves K. M. (2009) Trends Pharmacol. Sci. 30, 79–84 [DOI] [PMC free article] [PubMed] [Google Scholar]
- 16.Premkumar L. S., Agarwal S., Steffen D. (2002) J. Physiol. 545, 107–117 [DOI] [PMC free article] [PubMed] [Google Scholar]
- 17.Staruschenko A. V., Sudarikova A. V., Negulyaev Y. A., Morachevskaya E. A. (2006) Cell Res. 16, 723–730 [DOI] [PubMed] [Google Scholar]
- 18.Story G. M., Peier A. M., Reeve A. J., Eid S. R., Mosbacher J., Hricik T. R., Earley T. J., Hergarden A. C., Andersson D. A., Hwang S. W., McIntyre P., Jegla T., Bevan S., Patapoutian A. (2003) Cell 112, 819–829 [DOI] [PubMed] [Google Scholar]
- 19.Jeske N. A., Patwardhan A. M., Gamper N., Price T. J., Akopian A. N., Hargreaves K. M. (2006) J. Biol. Chem. 281, 32879–32890 [DOI] [PMC free article] [PubMed] [Google Scholar]
- 20.Caterina M. J., Schumacher M. A., Tominaga M., Rosen T. A., Levine J. D., Julius D. (1997) Nature 389, 816–824 [DOI] [PubMed] [Google Scholar]
- 21.Staruschenko A., Adams E., Booth R. E., Stockand J. D. (2005) Biophys. J. 88, 3966–3975 [DOI] [PMC free article] [PubMed] [Google Scholar]
- 22.Fowler C. E., Aryal P., Suen K. F., Slesinger P. A. (2007) J. Physiol. 580, 51–65 [DOI] [PMC free article] [PubMed] [Google Scholar]
- 23.Zal T., Gascoigne N. R. (2004) Biophys. J. 86, 3923–3939 [DOI] [PMC free article] [PubMed] [Google Scholar]
- 24.Pochynyuk O., Staruschenko A., Bugaj V., Lagrange L., Stockand J. D. (2007) J. Biol. Chem. 282, 14576–14585 [DOI] [PubMed] [Google Scholar]
- 25.Steyer J. A., Almers W. (2001) Nat. Rev. Mol. Cell Biol. 2, 268–275 [DOI] [PubMed] [Google Scholar]
- 26.Staruschenko A., Medina J. L., Patel P., Shapiro M. S., Booth R. E., Stockand J. D. (2004) J. Biol. Chem. 279, 27729–27734 [DOI] [PubMed] [Google Scholar]
- 27.Hellwig N., Albrecht N., Harteneck C., Schultz G., Schaefer M. (2005) J. Cell Sci. 118, 917–928 [DOI] [PubMed] [Google Scholar]
- 28.Kim D., Cavanaugh E. J. (2007) J. Neurosci. 27, 6500–6509 [DOI] [PMC free article] [PubMed] [Google Scholar]
- 29.Cavanaugh E. J., Simkin D., Kim D. (2008) Neuroscience 154, 1467–1476 [DOI] [PubMed] [Google Scholar]
- 30.Nagata K., Duggan A., Kumar G., García-Añoveros J. (2005) J. Neurosci. 25, 4052–4061 [DOI] [PMC free article] [PubMed] [Google Scholar]
- 31.Diogenes A., Akopian A. N., Hargreaves K. M. (2007) J. Dent. Res. 86, 550–555 [DOI] [PubMed] [Google Scholar]
- 32.Jordt S. E., Bautista D. M., Chuang H. H., McKemy D. D., Zygmunt P. M., Högestätt E. D., Meng I. D., Julius D. (2004) Nature 427, 260–265 [DOI] [PubMed] [Google Scholar]
- 33.Karashima Y., Prenen J., Meseguer V., Owsianik G., Voets T., Nilius B. (2008) Pflugers Arch. 457, 77–89 [DOI] [PubMed] [Google Scholar]
- 34.Strübing C., Krapivinsky G., Krapivinsky L., Clapham D. E. (2001) Neuron 29, 645–655 [DOI] [PubMed] [Google Scholar]
- 35.Xu X. Z., Chien F., Butler A., Salkoff L., Montell C. (2000) Neuron 26, 647–657 [DOI] [PubMed] [Google Scholar]
- 36.Ambudkar I. S. (2007) Handb. Exp. Pharmacol. 541–557 [DOI] [PubMed] [Google Scholar]
- 37.Bobanovic L. K., Royle S. J., Murrell-Lagnado R. D. (2002) J. Neurosci. 22, 4814–4824 [DOI] [PMC free article] [PubMed] [Google Scholar]
- 38.Köttgen M., Buchholz B., Garcia-Gonzalez M. A., Kotsis F., Fu X., Doerken M., Boehlke C., Steffl D., Tauber R., Wegierski T., Nitschke R., Suzuki M., Kramer-Zucker A., Germino G. G., Watnick T., Prenen J., Nilius B., Kuehn E. W., Walz G. (2008) J. Cell Biol. 182, 437–447 [DOI] [PMC free article] [PubMed] [Google Scholar]
- 39.Owsianik G., Talavera K., Voets T., Nilius B. (2006) Annu. Rev. Physiol. 68, 685–717 [DOI] [PubMed] [Google Scholar]
- 40.Vennekens R., Owsianik G., Nilius B. (2008) Curr. Pharm. Des. 14, 18–31 [DOI] [PubMed] [Google Scholar]
- 41.Vennekens R., Prenen J., Hoenderop J. G., Bindels R. J., Droogmans G., Nilius B. (2001) J. Physiol. 530, 183–191 [DOI] [PMC free article] [PubMed] [Google Scholar]
- 42.Chuang H. H., Prescott E. D., Kong H., Shields S., Jordt S. E., Basbaum A. I., Chao M. V., Julius D. (2001) Nature 411, 957–962 [DOI] [PubMed] [Google Scholar]
- 43.Shin J., Cho H., Hwang S. W., Jung J., Shin C. Y., Lee S. Y., Kim S. H., Lee M. G., Choi Y. H., Kim J., Haber N. A., Reichling D. B., Khasar S., Levine J. D., Oh U. (2002) Proc. Natl. Acad. Sci. U.S.A. 99, 10150–10155 [DOI] [PMC free article] [PubMed] [Google Scholar]
- 44.Doerner J. F., Gisselmann G., Hatt H., Wetzel C. H. (2007) J. Biol. Chem. 282, 13180–13189 [DOI] [PubMed] [Google Scholar]
- 45.Erreger K., Dravid S. M., Banke T. G., Wyllie D. J., Traynelis S. F. (2005) J. Physiol. 563, 345–358 [DOI] [PMC free article] [PubMed] [Google Scholar]
- 46.Kim D., Cavanaugh E. J., Kim I., Carroll J. (2009) J. Physiol. 587, 2963–2975 [DOI] [PMC free article] [PubMed] [Google Scholar]
- 47.Swanson G. T., Kamboj S. K., Cull-Candy S. G. (1997) J. Neurosci. 17, 58–69 [DOI] [PMC free article] [PubMed] [Google Scholar]
- 48.Das S., Sasaki Y. F., Rothe T., Premkumar L. S., Takasu M., Crandall J. E., Dikkes P., Conner D. A., Rayudu P. V., Cheung W., Chen H. S., Lipton S. A., Nakanishi N. (1998) Nature 393, 377–381 [DOI] [PubMed] [Google Scholar]