The structure of human carbonic anhydrase II has been solved with a sulfonamide inhibitor at 0.9 Å resolution. Structural variation and flexibility is seen on the surface of the protein and is consistent with the anisotropic ADPs obtained from refinement. Comparison with 13 other atomic resolution carbonic anhydrase structures shows that surface variation exists even in these highly ordered isomorphous crystals.
Keywords: carbonic anhydrase, structure comparison, metalloproteins, atomic resolution
Abstract
Carbonic anhydrase has been well studied structurally and functionally owing to its importance in respiration. A large number of X-ray crystallographic structures of carbonic anhydrase and its inhibitor complexes have been determined, some at atomic resolution. Structure determination of a sulfonamide-containing inhibitor complex has been carried out and the structure was refined at 0.9 Å resolution with anisotropic atomic displacement parameters to an R value of 0.141. The structure is similar to those of other carbonic anhydrase complexes, with the inhibitor providing a fourth nonprotein ligand to the active-site zinc. Comparison of this structure with 13 other atomic resolution (higher than 1.25 Å) isomorphous carbonic anhydrase structures provides a view of the structural similarity and variability in a series of crystal structures. At the center of the protein the structures superpose very well. The metal complexes superpose (with only two exceptions) with standard deviations of 0.01 Å in some zinc–protein and zinc–ligand bond lengths. In contrast, regions of structural variability are found on the protein surface, possibly owing to flexibility and disorder in the individual structures, differences in the chemical and crystalline environments or the different approaches used by different investigators to model weak or complicated electron-density maps. These findings suggest that care must be taken in interpreting structural details on protein surfaces on the basis of individual X-ray structures, even if atomic resolution data are available.
1. Introduction
The resolution of diffraction data sets provides a rough measure of the model quality possible from a crystal structure determination. At atomic resolution, details of hydrogen bonding, conformational distortions and other subtle structural features become more apparent and useful for detailed correlations with chemical and biological properties. It is generally assumed that structures at this high level of resolution leave little room for ambiguity and that the structural models should have high precision. One way to assess this is by comparing isomorphous atomic resolution structures of the same protein. For this purpose, we require a suitable crystallographic model system and hence have focused on carbonic anhydrase, for which a wealth of structural information is available. Here, we present a comparison of several isomorphous atomic resolution structures and show that some parts of the structural models are very similar while other parts vary, even after refinement at atomic resolution.
Carbonic anhydrase (EC 4.2.1.1) catalyzes the hydration of carbon dioxide to bicarbonate and is important for maintaining blood pH and for the transport of carbon dioxide in respiration. Human carbonic anhydrase II (HCA II) carries out its reaction extremely quickly, with a k cat of 106 s−1 (Steiner et al., 1975 ▶). Its structure has been known for some time (Liljas et al., 1972 ▶; Fig. 1 ▶). Crystallographic studies of hundreds of HCA II complexes with inhibitors and other ligands have been carried out and several atomic resolution structures of the enzyme and its inhibitor complexes are available (Table 1 ▶).
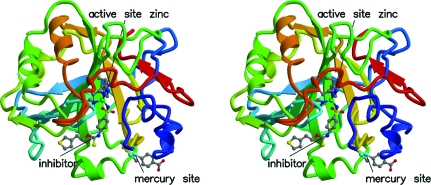
Figure 1.
Stereoview showing the overall structure of HCA II bound to inhibitor SUA. Rainbow colors denote the polypeptide chain, with blue at the N-terminus and red at the C-terminus. The active-site zinc, the inhibitor and the mercurial binding site are shown in ball-and-stick representation.
Table 1. Structures of human carbonic anhydrase II at higher than 1.25 Å resolution.
PDB entry 1lug was omitted from this table because it was refined against the same data set as this work. PDB entry 2nxt was omitted owing to refinement of isotropic ADPs.
| PDB code | Molecular description† | Reference |
|---|---|---|
| 1moo | H64A HCA II + 4-methylimidazole | Duda et al. (2001 ▶, 2003 ▶) |
| 2eu2 | HCA II + TDM | Fisher et al. (2006 ▶) |
| 2foq | HCA II + BR15 | Jude et al. (2006 ▶) |
| 2fos | HCA II + BR17 | Jude et al. (2006 ▶) |
| 2fou | HCA II + BR22 | Jude et al. (2006 ▶) |
| 2fov | HCA II + BR30 | Jude et al. (2006 ▶) |
| 2ili | HCA II | Fisher et al. (2007 ▶) |
| 2nng | HCA II + pAEBS | Srivastava et al. (2007 ▶) |
| 2nno | HCA II + MH 1.25 | Srivastava et al. (2007 ▶) |
| 2nns | HCA II + pCEBS | Srivastava et al. (2007 ▶) |
| 2nnv | HCA II + MH 1.29 | Srivastava et al. (2007 ▶) |
| 3d92 | HCA II + CO2 | Domsic et al. (2008 ▶) |
| 3d93 | HCA II (apoenzyme) | Domsic et al. (2008 ▶) |
| 3k34 | HCA II + SUA | This work |
TDM, 2-dimethylamino-5-sulfonamido(aminomethyl)-1,3,4-thiadiazole; pAEBS, 4-aminoethylbenzenesulfonamide; MH 1.25, 4-(acetyl-2-aminoethyl)benzenesulfonamide; pCEBS, 4-carboxyethylbenzenesulfonamide; MH 1.29, 4-carboxyethylbenzenesulfonamide ethyl ester.
A hallmark of potent carbonic anhydrase inhibitors is the presence of a sulfonamide group that completes the catalytically relevant zinc coordination sphere in the active site of the enzyme. We have determined the atomic resolution structure of HCA II with a selected sulfonamide inhibitor (Behnke, 2000 ▶); here, we present its comparison with other atomic resolution structures of carbonic anhydrase complexes.
2. Material and methods
2.1. Crystallization
HCA II was purchased from Sigma Chemical Company (St Louis, USA; catalog No. C6165). The enzyme was cocrystallized with p-hydroxymercuribenzoate (pHMB) and an inhibitor (3-{2-[({[4-(aminosulfonyl)phenyl]amino}-carbonothioyl)oxy]ethyl}-3H-thiophenium; SUA); the latter was provided by MDS Panlabs.
Crystals were grown in hanging drops based on the method of Tilander et al. (1965 ▶). The protein solution consisted of HCA II dissolved in water at 10 mg ml−1 without pH adjustment. The reservoir solution consisted of 3 M ammonium sulfate, 50 mM Tris–HCl and 2 mM pHMB with the pH adjusted to 7.5. The protein and reservoir solutions were combined in a 1:1 ratio and placed over 500 µl reservoir solution to equilibrate. Crystals grew within 24 h but showed a large number of flaws. Crystals with a better appearance were obtained when 5% DMSO was added to the drop. Crystals were obtained ranging from 0.4 to 1.1 mm in length and from 0.3 to 0.5 mm in width.
2.2. Cryoprotection
Mixtures of glycerol and the reservoir solution were screened as potential cryoprotectants. Successful cooling of the crystals was only possible with a modified reservoir solution containing a lower ammonium sulfate concentration. The cryoprotectant used for data collection consisted of 2.5 M ammonium sulfate, 35 mM Tris–HCl pH 7.5 and 26%(v/v) glycerol.
Crystals for data collection were placed in the cryoprotectant for 5–10 s before cooling in a 100 K cryostream. A longer exposure to the cryoprotectant resulted in better diffraction patterns, but the near-saturated ammonium sulfate solution rapidly began to crystallize, so care was required to prevent damage to the protein crystal from salt-crystal growth and to exclude salt crystals from the loop.
2.3. Data collection and processing
A 0.9 Å resolution data set for HCA II complexed with the inhibitor SUA was collected on beamline 9-1 at Stanford Synchrotron Radiation Laboratory (SSRL). Three data-collection passes of 150° each were required to collect both the high-resolution and the low-resolution reflections without exceeding the dynamic range of the detector. A MAR 345 (MAR Research) image-plate detector was used with a fixed 2θ of 0°. For the highest resolution pass the crystal-to-detector distance was set to the minimum possible (100 mm) and 2 min exposures were used. A large aluminium attenuator was placed behind the beamstop to limit the number of overloaded low-resolution reflections. Data were collected in this first pass from 2.2 to 0.90 Å resolution.
For the second pass, the detector was moved back to 150 mm from the crystal. The same attenuator was used and 30 s exposures were collected. Data from 2.9 to 1.06 Å resolution were collected from these data frames. A final set of frames was collected using 10 s exposures, again with the detector at 150 mm but with no attenuator. Data from 20 to 1.5 Å resolution were obtained from this pass. Data processing was carried out using DENZO and SCALEPACK (Otwinowski & Minor, 1997 ▶). Data-set statistics are presented in Table 2 ▶.
Table 2. Data-set statistics.
Values in parentheses are for the last shell.
| No. of reflections measured | 665315 |
| No. of unique reflections | 172463 |
| Resolution range (Å) | 20–0.90 (0.92–0.90) |
| Completeness | 0.98 (0.96) |
| 〈I〉/〈σ(I)〉 | 17.0 (1.34) |
| Rmerge | 0.069 (0.440) |
| Mosaicity (°) | 0.235 |
2.4. Structure refinement
Refinement of the structure started with the coordinates of native carbonic anhydrase (PDB entry 2cba; Håkansson et al., 1992 ▶). All solvent and metal atoms were removed from the starting model. Since the crystals were isomorphous, the starting model could be used to directly phase the new data and no molecular-replacement search was necessary.
Refinement was carried out using SHELXL-97 (Sheldrick, 2008 ▶) in conjugate-gradient least-squares mode, with 5% of the reflections reserved for cross-validation. No I/σ(I) cutoff was applied to the reflections. Initial refinement was carried out at moderate resolution (2.2–1.5 Å) and solvent atoms, metals (zinc and mercury), the sulfonamide moiety of the inhibitor and the remainder of the pHMB additive were added after examination of electron-density maps. Refinement continued with isotropic ADPs at 1.2 Å. Alternate conformations were added for a number of residues. Anisotropic ADPs were refined for the protein atoms and then for all atoms. The resolution was then increased stepwise to the maximum justified by the collected data. Restraints were relaxed as long as the geometry of the structure remained reasonable. However, even at the highest resolution restraints could not be completely removed without parts of the model becoming geometrically unreasonable. Refinement statistics are presented in Table 3 ▶.
Table 3. Refinement statistics.
| Model | 3k34 | 1lug (full-matrix refinement) |
|---|---|---|
| Resolution (Å) | 18–0.90 | 15–0.95 |
| No. of reflections, working set | 163837 | 147440 |
| No. of reflections with Fo > 4σ(Fo), working set | 123349 | 115415 |
| No. of reflections, test set | 8614 | 7313 |
| No. of reflections with Fo > 4σ(Fo), test set | 6462 | 6041 |
| Rcryst, Fo > 4σ(Fo) | 0.125 | 0.109 |
| Rcryst, all data | 0.141 | 0.119 |
| Rfree, Fo > 4σ(Fo) | 0.143 | 0.130 |
| Rfree, all data | 0.160 | 0.141 |
| R.m.s. deviation from ideal bond lengths (Å) | 0.033 | 0.030 |
| No. of protein atoms | 2098 | 2120 |
| No. of heteroatoms | 22 | 58 |
| No. of solvent atoms | 364 | 338 |
| Residues in (%) | 88.9 | 88.5 |
| Most favored regions (%) | 88.9 | 88.5 |
| Additional allowed regions (%) | 11.1 | 11.0 |
| Generously allowed and disallowed regions (%) | 0.0 | 0.5 |
SHELXPRO was used for file formatting, model and data analyses and calculations of σA-weighted |F o| − |F c| and 2|F o| − |F c| coefficients for electron-density maps (Read, 1986 ▶). The graphical evaluation of the model and electron-density maps was carried out with XtalView (McRee, 1999 ▶). The stereochemistry of the protein was checked during the refinement process with the programs PROCHECK (Laskowski et al., 1993 ▶) and WHAT IF (Vriend & Sander, 1993 ▶). Most of the refined water positions were found by SHELXWAT and the geometry of each water molecule was checked interactively. Figures were drawn with XtalView (McRee, 1999 ▶), MolScript (Kraulis, 1991 ▶), Raster3D (Merritt & Bacon, 1997 ▶) and RASTEP (Merritt, 1999a ▶). The coordinates and structure factors for the refined structure have been deposited in the Protein Data Bank (PDB code 3k34).
Full-matrix refinement was also carried out using the 0.95 Å resolution data (Table 3 ▶). The resulting model has been deposited in the Protein Data Bank (PDB code 1lug).
3. Results and discussion
3.1. The structure of HCA II with the inhibitor SUA
Fig. 1 ▶ provides an overview of our HCA II structure in complex with SUA and its active site (PDB entry 3k34). The protein model contains residues 3–261, with one missing residue number (126), which is a feature of many HCA II models in the PDB. The active-site zinc is bound to three histidine residues at the bottom of the active-site cleft (Fig. 2 ▶). The active-site zinc is tetrahedrally bound to three histidine residues from the protein and the inhibitor is bound at the fourth position. The inhibitor, which is a derivative of a common benzenesulfonamide carbonic anhydrase inhibitor, was selected on the basis of computational docking studies using the canonical zinc coordination sphere as an ‘anchor’ for modeled inhibitors (J. W. Godden and J. Bajorath, unpublished work). The inhibitor is a larger sulfonamide than is often seen in carbonic anhydrase structures and was selected for crystallographic analysis because it was predicted to fill the entire active site, with its dihydrothiophene moiety reaching out to the entrance. In addition, the structure includes pHMB bound to Cys206, shown at the bottom of Fig. 1 ▶. Most preparations of HCA II are stabilized by the addition of mercurials.
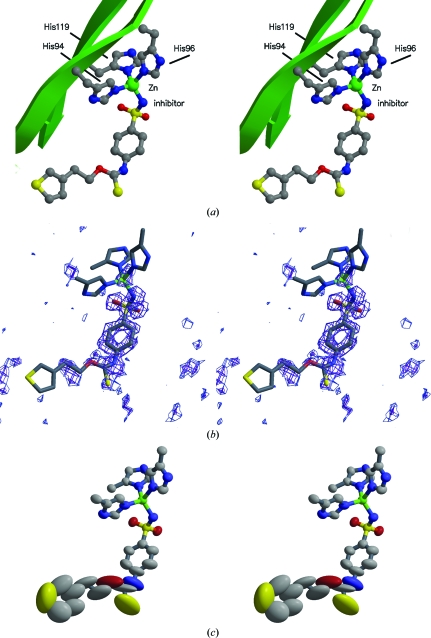
Figure 2.
Stereoview showing the active site in detail. (a) The zinc is bound to three histidine side chains from the protein and the inhibitor binds to complete the tetrahedral coordination around the zinc. Nearby pieces of the protein are shown as green ribbons and coils. (b) Difference electron density (|F o| − |F c|) for the inhibitor obtained using phases calculated for a model with no inhibitor atoms included (contoured at 3.5σ). Note the weak density for parts of the inhibitor distant from the metal. (c) Anisotropic displacement ellipsoids for the metal complex and inhibitor. Atoms with large ellipsoids are associated with weak density. Ellipsoids are shown as 50% probability surfaces.
Fig. 2 ▶ shows the electron density for the inhibitor SUA together with its thermal ellipsoids. All atoms were observed as individual peaks in difference electron-density maps as the refinement progressed, but in the map generated using phases calculated for a model with the inhibitor absent the density was weak for the parts of the inhibitor distant from the Zn atom and in particular for the thiophene group at the entrance of the active site. This is consistent with the thermal ellipsoids for these atoms. It is interesting to note that high-resolution diffraction data do not preclude the possibility of flexible regions in the protein that may be spatially or temporally disordered.
Full-matrix nonrestrained refinement (model 1lug) provides an opportunity to assess stereochemical deviations from ideality for selected bond lengths and angles. The average Cα—Cβ bond distance for 237 residues is 1.53 (3) Å (the r.m.s. deviation of the sample is given in parentheses). The average Cα—C distance is 1.52 (3) Å, the average Cα—N distance is 1.45 (2) Å, the average C—O distance is 1.23 (2) Å and the average C—N distance is 1.33 (2) Å. The average N—Cα—C angle is 110.8 (2.9)°. These values do not significantly differ from the restraint values used in SHELXL or from average values seen in other high-resolution structures (Jaskolski et al., 2007 ▶).
3.2. Comparison with other atomic resolution HCA II crystal structures
14 crystal structures of HCA II at resolutions higher than 1.25 Å and with anisotropic atomic displacement parameters (ADPs) have been deposited in the PDB (Table 1 ▶) and can be compared to assess the precision of the models and how they might differ. The structures have been solved by three different laboratories using different preparations of protein and inhibitors or substrates. However, the crystallization conditions were similar for these structures and generally used Tris buffer at pH 7.8 and ammonium sulfate or sodium citrate as precipitants (Table 4 ▶). Diffraction data for these structures have been collected on different beamlines at different synchrotrons using different detectors. All of the data sets were processed using DENZO and SCALEPACK (Table 5 ▶).
Table 4. Crystallization information for 14 isomorphous atomic resolution structures of HCA II.
| Crystallization conditions | ||||
|---|---|---|---|---|
| PDB code | Method | Drop composition | Protein solution | Precipitant solution |
| 1moo | Hanging-drop vapor diffusion | 5 µl protein solution + 5 µl precipitant solution | 10 mg ml−1 in 50 mM Tris–HCl pH 7.8, 1 mM HgCl2 | 2.3–2.5 M (NH4)2SO4 in 50 mM Tris–HCl pH 7.8, 1 mM HgCl2 |
| 2eu2 | Hanging-drop vapor diffusion | 5 µl protein solution + 5 µl precipitant solution | ∼15 mg ml−1 in 50 mM Tris–HCl pH 7.8 | 50 mM Tris–HCl pH 7.8, 2.6 M (NH4)2SO4 |
| 2foq | Hanging-drop vapor diffusion | 5 µl protein solution + 5 µl precipitant solution | 10 mg ml−1 in 1 mM methylmercuric acetate, 50 mM Tris–sulfate pH 8.0 | 2.5 M (NH4)2SO4, 50 mM Tris–sulfate pH 7.7 |
| 2fos | ||||
| 2fou | ||||
| 2fov | ||||
| 2ili | Hanging-drop vapor diffusion | 5 µl protein solution + 5 µl precipitant solution | ∼25 mg ml−1 in 50 mM Tris–HCl pH 8.2 | 100 mM Tris–HCl pH 7.8, 1.15 M sodium citrate |
| 2nng | Hanging-drop vapor diffusion | 5 µl protein solution + 5 µl precipitant solution | 10 mg ml−1 in 1 mM methylmercuric acetate, 50 mM Tris–sulfate pH 8.0 | 2.5 M (NH4)2SO4, 50 mM Tris–sulfate pH 7.7 |
| 2nno | ||||
| 2nns | ||||
| 2nnv | ||||
| 3d92 | Hanging-drop vapor diffusion | 5 µl protein solution + 5 µl precipitant solution | 1.3 M sodium citrate, 100 mM Tris–HCl pH 7.8 | |
| 3d93 | ||||
| 3k34 | Hanging-drop vapor diffusion | 1:1 mixture of protein and precipitant solution | 10 mg ml−1 in water | 3 M (NH4)2SO4 in 50 mM Tris–HCl pH 7.5 and 2 mM pHMB |
Table 5. Data-collection information for 14 isomorphous atomic resolution structures of HCA II.
| PDB code | X-ray source | Detector | Temperature (K) | Cryoprotectant | Wavelength (Å) | Resolution (Å) | Data-processing software | Rmerge† |
|---|---|---|---|---|---|---|---|---|
| 1moo | CHESS F1 | ADSC Quantum 4 | 100 | 30% glycerol | 0.938, 1.54 | 1.05 | DENZO, SCALEPACK | 0.106 (0.316) |
| 2eu2 | CHESS A1 | ADSC Quantum 210 | 100 | 30% glycerol | 0.978 | 1.15 | DENZO, SCALEPACK | 0.099 (0.323) |
| 2foq | CHESS F1, A1 | ADSC Quantum 4 | 100 | 30% glycerol | 0.9124 | 1.25 | HKL-2000 | 0.086 (0.828) |
| 2fos | 100 | 30% glycerol | 0.9124 | 1.10 | 0.088 (0.413) | |||
| 2fou | 100 | 30% glycerol | 0.9124 | 0.99 | 0.093 (0.479) | |||
| 2fov | 100 | 30% glycerol | 0.9124 | 1.15 | 0.062 (0.581) | |||
| 2ili | ESRF ID29 | ADSC Quantum 210 | 100 | 20% glycerol | 1.00522 | 1.05 | DENZO, SCALEPACK | 0.079 (0.404) |
| 2nng | ALS 5.0.2 | ADSC Quantum 315 | 100 | 30% glycerol | 1.1 | 1.20 | HKL-2000 | 0.076 (0.270) |
| 2nno | 100 | 30% glycerol | 1.0 | 1.03 | 0.061 (0.283) | |||
| 2nns | 100 | 30% glycerol | 1.0 | 1.01 | 0.064 (0.345) | |||
| 2nnv | 100 | 30% glycerol | 1.1 | 1.10 | 0.072 (0.348) | |||
| 3d92 | CHESS A1 | ADSC Quantum 210 | 100 | 20% glycerol | 0.9772 | 1.10 | HKL-2000 | 0.088 (0.519) |
| 3d93 | 100 | 20% glycerol | 0.9772 | 1.10 | 0.080 (0.506) | |||
| 3k34 | SSRL 9-1 | MAR 345 | 100 | 26% glycerol | 0.78 | 0.90 | DENZO, SCALEPACK | 0.068 (0.440) |
Values in parentheses are for the highest resolution shell.
The 14 structures are isomorphous (space group P21) with one molecule in the asymmetric unit (Table 6 ▶). The unit-cell parameters, averaged over the 14 structures, are a = 42.4 (2), b = 41.5 (2), c = 72.2 (3) Å, β = 104.4 (2)° (the standard deviations were derived from the distribution of values). None of the individual values differed by more than 3σ from the mean values. The largest deviations occurred for structures where there were differences between the published and deposited values. The values used for the averages were those from the PDB files since they are consistent with the transformations relating the crystallographic axes to the orthogonal Angstrom axes. No discussion of the differences between the published and deposited values could be found in the literature.
Table 6. Unit-cell parameters for 14 isomorphous atomic resolution structures of HCA II.
The structures all have the symmetry of space group P21. Statistics are based on values taken from the PDB files. Δ = value − average. Values in parentheses are those from the published papers where these differ from the values in the deposited files. All unit-cell parameters were determined at 100 K.
| PDB code | a (Å) | |Δ|/σ | b (Å) | |Δ|/σ | c (Å) | |Δ|/σ | β (°) | |Δ|/σ |
|---|---|---|---|---|---|---|---|---|
| 1moo | 42.19 | 0.8 | 41.44 | 0.2 | 72.04 | 0.7 | 104.26 | 0.6 |
| 2eu2 | 42.97 (42.5) | 2.5 | 42.06 (41.6) | 2.5 | 72.41 (72.7) | 0.5 | 104.03 (103.9) | 1.7 |
| 2foq | 42.35 | 0.1 | 41.36 | 0.6 | 72.17 | 0.2 | 104.34 | 0.2 |
| 2fos | 42.44 | 0.3 | 41.64 | 0.7 | 72.28 | 0.1 | 104.24 | 0.7 |
| 2fou | 42.56 | 0.8 | 41.70 | 0.9 | 72.71 | 1.5 | 104.38 | 0.0 |
| 2fov | 42.36 | 0.1 | 41.48 | 0.0 | 72.23 | 0.0 | 104.34 | 0.2 |
| 2ili | 42.21 | 0.7 | 41.29 | 0.9 | 72.15 | 0.3 | 104.39 | 0.0 |
| 2nng | 42.29 | 0.4 | 41.44 | 0.2 | 71.98 (72.36) | 0.9 | 104.56 | 0.9 |
| 2nno | 42.28 | 0.4 | 41.36 | 0.6 | 72.14 | 0.3 | 104.50 | 0.6 |
| 2nns | 42.26 | 0.5 | 41.34 | 0.6 | 71.98 | 0.9 | 104.50 | 0.6 |
| 2nnv | 42.37 (42.34) | 0.0 | 41.21 (41.19) | 1.2 | 72.15 (72.08) | 0.3 | 104.83 | 2.2 |
| 3d92 | 42.7 (42.4) | 1.4 | 41.7 (41.5) | 0.9 | 73.0 (72.4) | 2.5 | 104.6 (104.1) | 1.1 |
| 3d93 | 42.22 | 0.7 | 41.51 | 0.1 | 72.35 | 0.3 | 104.15 | 1.1 |
| 3k34 | 42.05 | 1.4 | 41.27 | 1.0 | 71.82 | 1.4 | 104.23 | 0.7 |
| Average value | 42.38 | 41.49 | 72.24 | 104.38 | ||||
| Standard deviation | 0.24 | 0.23 | 0.31 | 0.21 |
Standard deviations in unit-cell parameters are not normally reported for macromolecular crystal structures. Lattice disorder and radiation damage produce variations of the unit-cell parameters during collection of a single data set, so it is unclear what error estimates are appropriate for these quantities. We find it interesting though that for these HCA II structures that diffract to high resolution the unit-cell parameters agree to within one part in 250 despite the fact that the unit-cell contents are not strictly identical as the active-site contents vary. This is not the precision reported for small-molecule crystals, but it might be representative of the precision that is possible for measurements of well ordered macromolecular crystals.
All 14 structures were refined with a version of SHELXL, as summarized in Table 7 ▶. The models differ in the numbers of protein atoms, heteroatoms and solvent atoms; this reflects the different approaches used to account for disordered side chains and solvent. The models also differ in the number and nature of alternate side-chain conformations and the way that they treat the disordered mercury complex bound to Cys206.
Table 7. Refinement information for 14 isomorphous atomic resolution structures of HCA II.
Values are taken from the PDB files. Values in parentheses are those from the published paper where these differ from those in the deposited file.
| No. of atoms | ADP treatment† | |||||||||
|---|---|---|---|---|---|---|---|---|---|---|
| PDB code | Resolution (Å) | R value | Rfree | Protein | Hetero | Solvent | Protein | Hetero | Solvent | Refinement program |
| 1moo | 1.05 | 0.158 | 0.177 | 2048 | 21 | 308 | Aniso | Mixed | Iso | SHELXL |
| 2eu2 | 1.15 | 0.136 | 0.166 | 2059 | 15 | 310 | Aniso | Aniso | Aniso | SHELXL-97 |
| 2foq | 1.25 | 0.164 | 0.213 | 2054 | 31 | 245 | Aniso | Aniso | Iso | SHELX-97 |
| 2fos | 1.10 | 0.127 | 0.153 | 2161 | 38 | 326 | Aniso | Aniso | Aniso | SHELX-97 |
| 2fou | 0.99 | 0.123 | 0.135 | 2123 | 70 | 291 | Aniso | Aniso | Aniso | SHELX-97 |
| 2fov | 1.15 | 0.143 | 0.187 | 2116 | 52 | 272 | Aniso | Aniso | Aniso | SHELX-97 |
| 2ili | 1.05 | 0.120 | 0.151 | 2065 | 1 | 311 | Aniso | Aniso | Aniso | SHELXL-97 |
| 2nng | 1.20 | 0.132 | 0.165 | 2082 | 14 | 279 | Aniso | Aniso | Aniso | SHELX-97 |
| 2nno | 1.01 | 0.122 | 0.148 | 2116 | 31 | 346 | Aniso | Aniso | Aniso | SHELX-97 |
| 2nns | 1.03 | 0.129 | 0.164 | 2110 | 34 | 370 | Aniso | Aniso | Aniso | SHELX-97 |
| 2nnv | 1.10 | 0.132 | 0.164 | 2126 | 35 | 262 | Aniso | Aniso | Aniso | SHELX-97 |
| 3d92 | 1.10 | 0.100 (0.109) | 0.129 | 2096 | 7 | 319 (404) | Aniso | Aniso | Aniso | SHELXL |
| 3d93 | 1.10 | 0.104 | 0.139 | 2121 | 6 | 358 | Aniso | Aniso | Aniso | SHELXL |
| 3k34 | 0.90 | 0.141 | 0.160 | 2098 | 22 | 364 | Aniso | Aniso | Aniso | SHELXL-97 |
Atoms in each class were refined with anisotropic ADPs (Aniso), isotropic ADPs (Iso) or a mixture of the two (Mixed).
3.3. Comparison of the zinc sites
Table 8 ▶ lists the bond distances and angles for the zinc complexes in 13 of the atomic resolution structures (structure 3d93 is an apo structure without the zinc cofactor). Table 8 ▶ also contains average values and the standard deviations derived from the distribution of individual bond lengths and angles. In 2eu2 His96 is oriented to place CE1 instead of NE2 close to the zinc. No chemical justification for this is available, so the zinc complex in 2eu2 has been omitted from further consideration.
Table 8. Bond distances (Å) and angles (°) for the zinc complexes in the superposed structures.
| PDB code | Zn—His94 | Zn—His96 | Zn—His119 | Zn—ligand | His94—Zn—His96 | His94—Zn—His119 | His94—Zn—ligand | His96—Zn—His119 | His96—Zn—ligand | His119—Zn—ligand |
|---|---|---|---|---|---|---|---|---|---|---|
| 1moo | 2.15 | 2.08 | 2.10 | 1.81 | 97.4 | 107.9 | 96.0 | 97.6 | 128.0 | 125.1 |
| 2eu2 | 2.02 | — | 2.07 | 2.01 | — | 112.4 | 112.7 | — | — | 114.7 |
| 2foq | 2.00 | 2.08 | 2.04 | 2.01 | 103.5 | 113.9 | 111.5 | 98.3 | 113.0 | 115.4 |
| 2fos | 2.01 | 2.02 | 2.02 | 1.97 | 104.2 | 112.9 | 109.4 | 99.4 | 114.3 | 115.7 |
| 2fou | 2.00 | 2.00 | 2.03 | 1.93 | 104.2 | 111.9 | 111.2 | 98.6 | 113.9 | 115.8 |
| 2fov | 2.00 | 2.05 | 2.05 | 1.94 | 104.7 | 112.0 | 111.1 | 98.4 | 113.2 | 116.4 |
| 2ili | 1.99 | 2.00 | 2.00 | 1.88 | 105.0 | 115.1 | 104.8 | 99.5 | 116.8 | 115.6 |
| 2nng | 1.99 | 2.03 | 2.04 | 1.93 | 105.0 | 112.9 | 110.1 | 97.5 | 112.7 | 117.4 |
| 2nno | 1.98 | 2.02 | 2.01 | 1.95 | 103.8 | 112.1 | 111.2 | 99.3 | 113.3 | 116.0 |
| 2nns | 2.00 | 2.05 | 2.02 | 1.90 | 103.5 | 111.9 | 111.4 | 98.3 | 114.8 | 115.6 |
| 2nnv | 1.99 | 2.00 | 2.03 | 1.92 | 102.6 | 111.7 | 112.4 | 98.7 | 113.7 | 116.2 |
| 3d92 | 1.99 | 2.04 | 2.05 | 1.92 | 105.2 | 115.5 | 113.5 | 99.8 | 110.2 | 111.5 |
| 3k34 | 1.97 | 2.02 | 2.01 | 1.94 | 103.2 | 113.2 | 110.4 | 98.8 | 113.9 | 116.1 |
| Average/standard deviation (omitting 2eu2; 12 structures)† | ||||||||||
| Average | 2.01 | 2.03 | 2.03 | 1.93 | 103.5 | 112.6 | 109.4 | 98.7 | 114.8 | 116.4 |
| Standard deviation | 0.05 | 0.03 | 0.03 | 0.05 | 2.0 | 1.8 | 4.7 | 0.7 | 4.4 | 3.1 |
| Average/standard deviation (omitting 2eu2, 1moo; 11 structures)†‡ | ||||||||||
| Average | 1.99 | 2.03 | 2.03 | 1.94 | 104.1 | 113.0 | 110.6 | 98.8 | 113.6 | 115.6 |
| Standard deviation | 0.01 | 0.02 | 0.02 | 0.04 | 0.8 | 1.3 | 2.2 | 0.7 | 1.6 | 1.5 |
| Average/standard deviation (nitrogen ligands; nine structures)†‡§ | ||||||||||
| Average | 1.99 | 2.03 | 2.03 | 1.94 | 103.9 | 112.5 | 111.0 | 98.6 | 113.6 | 116.1 |
| Standard deviation | 0.01 | 0.02 | 0.02 | 0.03 | 0.7 | 0.7 | 0.9 | 0.6 | 0.7 | 0.6 |
The zinc–histidine distances and the histidine–zinc–histidine angles are in close agreement across the set of structures. The standard deviations in the average bond distances for the 12 structures are of the order of 0.04 Å.
The diffraction data set used for 3k34 was also used in an unrestrained full-matrix refinement (PDB entry 1lug) and the bond-length e.s.d.s (estimated standard deviations) resulting from this refinement for the zinc–histidine distances are about 0.005 Å, which is an order of magnitude smaller than those obtained from the distribution of values.
This disagreement between these estimates is strongly influenced by which structures are used for the averaging. Firstly, the zinc complex in structure 1moo differs somewhat from the others (Table 8 ▶). The zinc–histidine distances are longer than the average values for the complexes, while the zinc–ligand distance is shorter. The ligand for 1moo is modeled as a water molecule, as is the ligand in 2ili and 3d92. These structures are ostensibly chemically identical, but their metal complexes differ significantly. When the proteins are superposed, the Zn atom in 1moo is about 0.25 Å from the cluster of Zn atoms formed by the other structures. Refinement of the 2ili model against the 1moo diffraction data results in movement of the Zn atom to its position in 1moo (results not shown). Whatever the cause of the different zinc position, omission of 1moo from the comparison of the metal complexes significantly reduces the standard deviations (Table 8 ▶). The standard deviations for the zinc bond distances when 1moo is omitted from the averaging are about 0.01 Å, a value that is within a factor of two of those obtained from the full-matrix refinement.
Two other things should be noted about the values presented in Table 8 ▶. The values may or may not come from restrained refinements. It is not clear from the information in the published papers or the PDB files whether restraints were applied to the zinc complexes. Nor, in the case of restrained refinements, are the actual restraint values and weightings known. The mis-orientation of His96 in 2eu2 suggests that metal–histidine restraints were not applied at least in that structure. Application of the restraint would be likely to have reoriented the ring.
Secondly, the zinc complexes in these structures also differ in that three of them have water molecules (or at least oxygen species) bound to the Zn atom (1moo, 2ili and 3d92), while the others have N atoms completing the tetrahedral complex. This results in slightly shorter zinc–ligand distances for the oxygen-bound structures. Including only the nine structures containing nitrogen ligands in the averages further reduces the standard deviations (Table 8 ▶). While the sample size for the oxygen-liganded structures is small, the chemical differences in the zinc coordination sphere can be observed in these atomic resolution structures.
Even in light of these complications, the consistency of the zinc bond distances and angles show that the metal site is distorted from an ideal tetrahedrally coordinated zinc. The large number of structures compared here provides an estimate of the standard deviations of the distances and angles and shows that the His96–Zn–His119 angle differs significantly from 109°.
3.4. Comparison of the HCA II protein structures
For the purpose of comparison, the structures were superposed on structure 2ili, a 1.05 Å resolution structure of the native enzyme with water as the fourth ligand of the zinc (Table 9 ▶). While all the crystals are isomorphous, the placement of the structural model along the monoclinic axis is arbitrary in this polar space group. An in-house program based on the method of Ferro & Hermans (1977 ▶) was used to superpose the structures using the Cα coordinates. The largest r.m.s.d. values were for 2eu2, which also shows the largest deviations from the average unit-cell parameters (Table 6 ▶).
Table 9. Superposition of structures with 2ili .
| Structure | R.m.s.d.† (Å) |
|---|---|
| 1moo | 0.199 |
| 2eu2 | 0.320 |
| 2foq | 0.163 |
| 2fos | 0.193 |
| 2fou | 0.230 |
| 2fov | 0.184 |
| 2nng | 0.151 |
| 2nno | 0.182 |
| 2nns | 0.176 |
| 2nnv | 0.187 |
| 3d92 | 0.208 |
| 3d93 | 0.159 |
| 3k34 | 0.234 |
R.m.s. differences for 240 Cα atoms after superposition on structure 2ili.
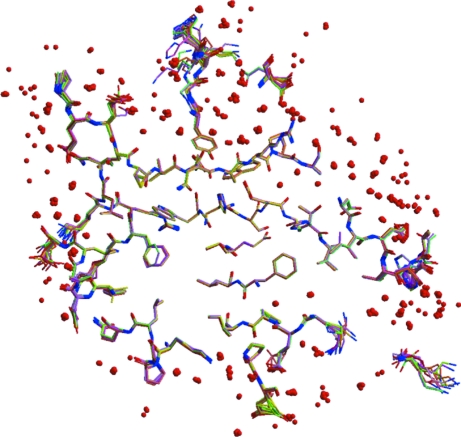
At the centers of the molecules the structures overlap very well, as seen in Fig. 3 ▶. The structural differences for the residues at the core of the protein (center of Fig. 3 ▶) are so small that it is difficult to discern 14 superposed structures in these regions. However, the r.m.s. deviations of the atoms from their average positions after superposition of the 14 structures are generally far in excess of the positional e.s.d.s from the full-matrix refinement (1lug). For instance, only 15 of the 260 Cα atoms have r.m.s. deviations less than three times their e.s.d.s. This indicates that structural variation exists throughout the polypeptide models, but at the surface of the molecules where conformational flexibility and solvent disorder tend to occur the structural differences become increasingly apparent (edges of Fig. 3 ▶).
Figure 3.
A 10 Å thick slab through the 14 superposed atomic resolution HCA II structures. The cores of the proteins (center of the view) overlap well, while residues near the surface (edges) show more variability in their structures. Water molecules are shown as red spheres.
In each of the 14 structures alternate conformations have been included in the models to fit their electron-density maps. The number of residues with alternate conformations varies from structure to structure, with 2fos and 2foq having the maximum of 16 each and 2foq having the minimum of one. A total of 46 residues (of 260) have alternate conformations in at least one of the 14 structures. However, when the structures are superposed there are a number of residues in which the modeled side chains take on a range of conformations. This variation could be the result of random sampling of multiple conformations or modeling of structural variation across the set of 14 structures. Only 141 nonglycine and nonalanine residues are found in the same conformation in all 14 structures.
Fig. 4 ▶ shows the superposed structures near the C-terminal residue Lys261. This residue points away from the protein surface into a cavity in this crystal form. In most of the compared structures the N- and C-terminal residues have large ADPs. The many alternative conformations of Lys261 might suggest that this region is disordered and that different investigators have modeled it in different ways. However, it should be remembered that these crystal structures are not chemically identical and more detailed analysis and experiments will be necessary before ascribing this structural variation to disorder.
Figure 4.
An example of considerable structural variability is seen at the C-terminal Lys261 when the 14 structures are superposed. Note the clusters of water molecules formed by the superposition.
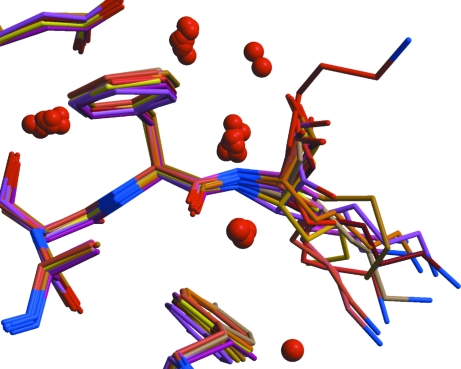
A similar situation occurs near the active site (Fig. 5 ▶). Here, the zinc coordination spheres superpose closely, but consistent with the reduced electron density seen in Fig. 2 ▶ portions of the inhibitors further away from the metal are not well tethered to the protein. The lack of interactions between these parts of the small-molecule ligands and the protein might permit sampling of the conformation space accessible to the ligand. Because most of the inhibitors share the sulfonamide group coordinating the zinc that is largely responsible for inhibition, disordered portions of the inhibitors that are involved in only a few intermolecular interactions are not likely to contribute to specific inhibition. The high-resolution diffraction data obtained for these 14 crystals must be associated with well ordered parts of the molecules that pack consistently in this crystal form.
Figure 5.
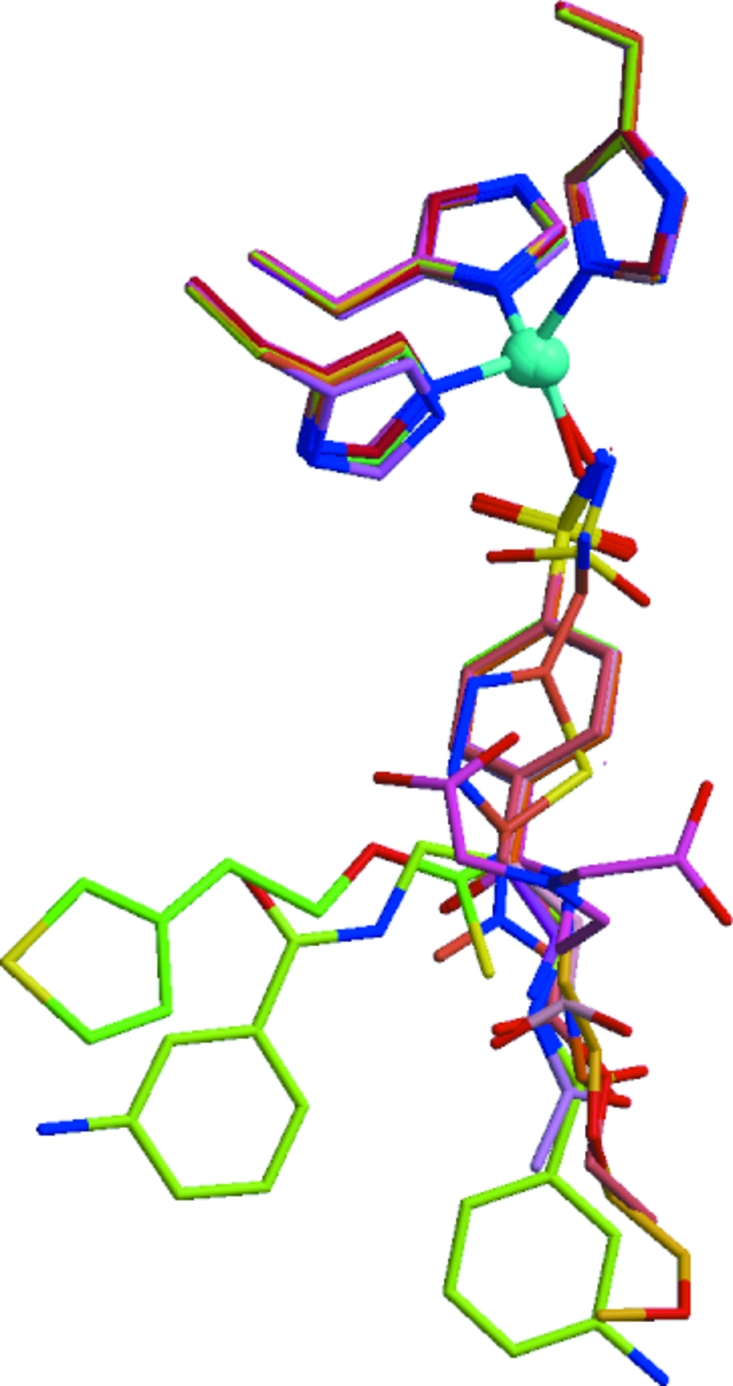
The metal site and ligands for the 14 superposed structures. The zinc and histidines are well ordered but the inhibitors take on a range of conformations and structures.
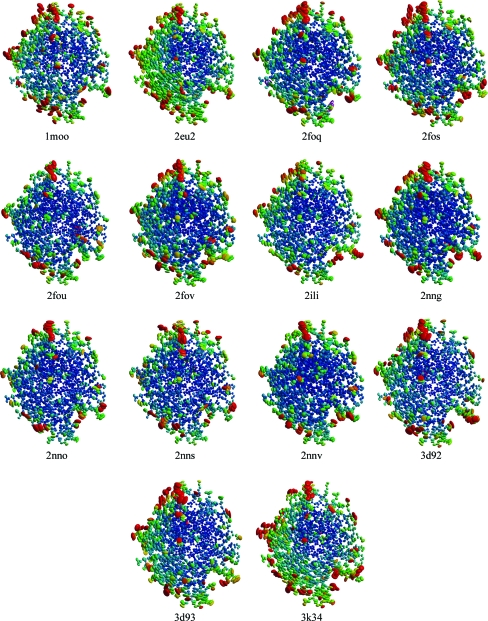
The flexible surface and relatively rigid core residues are also observed when comparing the ADPs for the structures. Fig. 6 ▶ shows overall views of the anisotropic ADPs for each of the structures, color coded with the largest values in red and the lowest in blue. Consistent with the structural view in Fig. 3 ▶, the cores of the molecules have low ADPs while the surface residues show more static or temporal disorder. While this overall pattern is seen in the 14 structures, there are variations on the theme. For instance, the shape and magnitudes of the ADPs for the residues at the top of each molecule vary across the series. Two of the structures (2eu2 and 3k34) have larger ADPs for parts of their structures (left side of the views in Fig. 6 ▶). It remains unclear whether these types of results arise from ligand-induced structural differences, systematic experimental errors or the inadequacy of the refinement models to account for disorder.
Figure 6.
Thermal ellipsoids for the atoms in each of the 14 structures. The smallest ellipsoids are colored blue, while the largest are colored red. Thermal ellipsoids are drawn as 50% probability surfaces.
Another way to compare the ADPs across the series of structures is to examine the average isotropic B value for each residue (Fig. 7 ▶). As would be expected, the average values correlate with surface accessibility and structural elements (internal strands and helices and external turns). The distribution of B values for any one residue across the 14 structures is relatively tight. For the main-chain atoms at the core of the protein the standard deviation in the average B values is about 1–2 Å2. For well ordered side chains with low average B values the variability is also low, but side chains with higher B values also show increased variability across the different structures.
Figure 7.
Average equivalent isotropic B values for the residues in the 14 HCA II structures. Average values were calculated for each residue in each structure. The vertical lines for each residue cover the range of average values from the 14 structures. The mean values for each range are joined by the lines running from residue to residue. (a) Average values for main-chain atoms. (b) Average values for side-chain atoms. B eq = (8/3)π2 (U 11 + U 22 + U 33).
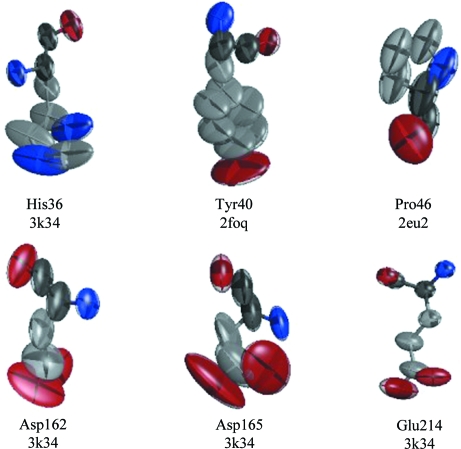
One component of the ADP analysis performed by PARVATI (Merritt, 1999a ▶) is the identification of the residues within a structure where the anisotropy is the largest. No residue shows large anisotropy in all of the structures. However, eight residues have large anisotropies in at least seven of the 14 structures. Selected examples of their thermal ellipsoids are shown in Fig. 8 ▶. None of these examples show wildly varying or distorted ellipsoids, perhaps as a consequence of the application of restraints during refinement.
Figure 8.
Selected examples of residues containing atoms with large anisotropies. Some of the larger anisotropies might be associated with rigid-body-type motion of the residue. Atoms are colored by atom type (carbon, gray; oxygen, red; nitrogen, blue). Thermal ellipsoids are drawn as 50% probability surfaces.
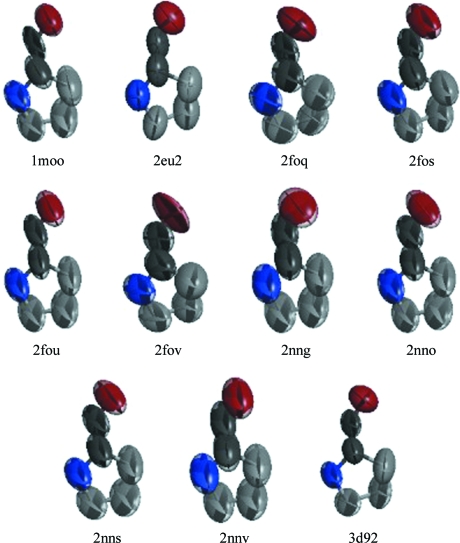
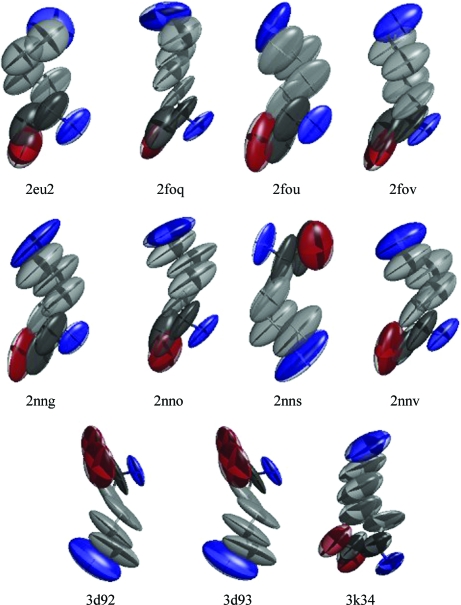
Figs. 9 ▶ and 10 ▶ show the thermal ellipsoids for Pro42 and Lys261 (the C-terminal residue). These two residues have large anisotropies in 11 of the 14 structures. The thermal ellipsoids for Pro42 show some variation, with the smallest appearing in 3d92. However, the thermal ellipsoids for Lys261 are quite large and variable. This is consistent with the range of conformations found for this residue (Fig. 4 ▶). The views in Fig. 10 ▶ are obtained from HCA II molecules in the same orientation, so the variation in orientation of the Lys261 side chains is associated with alternate conformations for that residue obtained during refinement.
Figure 9.
Anisotropic ADPs for Pro42 showing large anisotropies. Pro42 was identified as one of the residues with the largest anisotropies in 11 of the 14 HCA II structures. Atoms are colored by atom type (carbon, gray; oxygen, red; nitrogen, blue). Thermal ellipsoids are drawn as 50% probability surfaces.
Figure 10.
Anisotropic ADPs for Lys261 showing large anisotropies. Lys261 was identified as one of the residues with the largest anisotropies in 11 of the 14 HCA II structures. Atoms are colored by atom type (carbon, gray; oxygen, red; nitrogen, blue). Thermal ellipsoids are drawn as 50% probability surfaces.
Two of the residues with large anisotropies in several of the structures (Pro42 and Pro46) are flagged by a validation test in PARVATI based on the correlation coefficient between the ADPs of the C and N atoms joined by the peptide bond (Merritt, 1999b ▶). These proline residues are located in a part of the protein models that displays considerable structural variation. The conformations of the proline rings are not the same in all 14 structures, nor are their positions. Additionally, for Pro46 in structure 2eu2 the peptide between Pro46 and Leu47 is flipped relative to the other structures. As noted before, these residues may be located in a disordered region and the variation seen in the structures and ADPs might be a consequence of an incomplete model using anisotropic ADPs to account for multiple polypeptide conformations.
4. Conclusions
The 14 atomic resolution structures analyzed here provide many potentially conflicting views of the current practice of crystal structure determination. The isomorphous structures have very similar unit-cell parameters and the molecular structures align very well.
However, at the same time there are portions of the molecular structures that are different, i.e. regions on the surface of the protein where conformational flexibility is possible. Several things might contribute to the variation in the deposited structural models for these areas. Firstly, the structures are chemically different in that they have different inhibitors and ligands in the active site. This is readily seen in Fig. 5 ▶, where the parts of the inhibitors closest to the zinc are fairly well ordered but their components away from the zinc are oriented in many different directions. Secondly, while their crystallization conditions are similar, they are not identical. This could lead to small structural differences in the protein or bound solvent. Thirdly, the structures differ in which mercurial (if any) was used to stabilize the protein. Addition of bulky mercurial substituents to Cys206 will affect the structure both sterically and chemically. Localized radiation damage near the Hg atom could have a major effect on the variability of the structures. Finally, differences in the way disorder is handled by different investigators might result in different models for the crystal structure. Alternate side-chain conformations and different solvent models could contribute to the variation seen when the structures are compared.
These HCA II structures with diffraction patterns extending to atomic resolution are examples of crystal structures that are somewhere in the middle of the continuum from extremely well ordered small-molecule structures to disordered macromolecular structures that only diffract to low resolution. The presence of disorder often limits the precision of a structural model owing to difficulties in modeling overlapping structures. The structures compared here allow an assessment of the errors in the derived bond lengths and angles and the magnitude of these errors seems to be quite reasonable for structures with atomic resolution data and R values above 10%. Overall, the 14 HCA II crystal and molecular structures are remarkably similar. However, there are structural differences in some regions and this suggests that care should be taken when analyzing surface features, even when dealing with high-resolution or atomic resolution models.
Despite a rapid increase in the number of very high resolution protein structure determinations deposited in the PDB, very few structures have been independently determined multiple times. Carbonic anhydrase offers an opportunity to compare features such as metal–ligand distances with the corresponding statistically estimated accuracy based on full-matrix treatment of a single atomic resolution structure. For example, Kolling et al. (2007 ▶) found e.s.d.s for Fe—S and Fe—N bond lengths of 0.01 and 0.02 Å, respectively, from full-matrix treatment of the Rieske Fe–S protein at 1.2 Å resolution, but no other similarly high-resolution refinements of this protein are available for comparison. Liu et al. (2002 ▶) compared the differences observed for Fe–S distances with the corresponding e.s.d.s from full-matrix treatment of the Thermochromatium tepidum and Allochromatium vinosum HiPIP proteins at 0.8 and 0.9 Å resolution, respectively (Parisini et al., 1999 ▶). In this case the empirical differences between structures were larger than the individual e.s.d.s, but these structures are not isomorphous nor are the proteins identical. From these and other full-matrix treatments one might conclude that if the achievable accuracy of a refined protein structure were limited solely by the data quality and by current crystallographic treatment of model generation and refinement then the accuracy of bond lengths determined for well defined structural elements such as a fully liganded transition metal would be of the order of 0.002–0.020 Å. This range of accuracy corresponds to resolutions in the range 0.8–1.2 Å. We find from the current analysis that this level of agreement for metal–ligand distances is indeed achieved among a set of 12 independent structure determinations at <1.25 Å resolution, but only after excluding a pair of structures exhibiting internal validation problems from consideration. On the one hand this supports the statistical error estimates derived from single structure determinations as being empirically valid, but on the other it highlights the importance of validation and the possible presence of avoidable error even in atomic resolution structural models.
Supplementary Material
PDB reference: carbonic anhydrase II, 3k34
PDB reference: 1lug
Acknowledgments
Portions of this research were supported by NIH grant GM 080232 (EAM, PI) and were carried out at the Stanford Synchrotron Radiation Laboratory, a national user facility operated by Stanford University on behalf of the US Department of Energy, Office of Basic Energy Sciences. The SSRL Structural Molecular Biology Program is supported by the Department of Energy, Office of Biological and Environmental Research and by the National Institutes of Health, National Center for Research Resources, Biomedical Technology Program and the National Institute of General Medical Sciences. We are grateful to E. C. Lingafelter, V. Schomaker and L. H. Jensen for teaching us the joys of analyzing tables of numbers.
References
- Behnke, C. A. (2000). PhD dissertation. University of Washington, Seattle, USA.
- Domsic, J. F., Avvaru, B. S., Kim, C. U., Gruner, S. M., Agbandje-McKenna, M., Silverman, D. N. & McKenna, R. (2008). J. Biol. Chem.283, 30766–30771. [DOI] [PMC free article] [PubMed]
- Duda, D., Govindasamy, L., Agbandje-McKenna, M., Tu, C., Silverman, D. N. & McKenna, R. (2003). Acta Cryst. D59, 93–104. [DOI] [PubMed]
- Duda, D., Tu, C., Silverman, D. N., Kalb (Gilboa), A. J., Agbandje-McKenna, M. & McKenna, R. (2001). Protein Pept. Lett.8, 63–67.
- Ferro, D. R. & Hermans, J. (1977). Acta Cryst. A33, 345–347.
- Fisher, S. Z., Govindasamy, L., Boyle, N., Agbandje-McKenna, M., Silverman, D. N., Blackburn, G. M. & McKenna, R. (2006). Acta Cryst. F62, 618–622. [DOI] [PMC free article] [PubMed]
- Fisher, S. Z., Maupin, C. M., Budayova-Spano, M., Govindasamy, L., Tu, C., Agbandje-McKenna, M., Silverman, D. N., Voth, G. A. & McKenna, R. (2007). Biochemistry, 46, 2930–2937. [DOI] [PubMed]
- Håkansson, K., Carlsson, M., Svensson, L. A. & Liljas, A. (1992). J. Mol. Biol.227, 1192–1204. [DOI] [PubMed]
- Jaskolski, M., Gilski, M., Dauter, Z. & Wlodawer, A. (2007). Acta Cryst. D63, 611–620. [DOI] [PubMed]
- Jude, K. M., Banerjee, A. L., Haldar, M. K., Manokaran, S., Roy, B., Mallik, S., Srivastava, D. K. & Christianson, D. W. (2006). J. Am. Chem. Soc.128, 3011–3018. [DOI] [PMC free article] [PubMed]
- Kolling, D. J., Brunzelle, J. S., Lhee, S., Crofts, A. R. & Nair, S. K. (2007). Structure, 15, 29–38. [DOI] [PMC free article] [PubMed]
- Kraulis, P. J. (1991). J. Appl. Cryst.24, 946–950.
- Laskowski, R. A., MacArthur, M. W., Moss, D. S. & Thornton, J. M. (1993). J. Appl. Cryst.26, 283–291.
- Liljas, A., Kannan, K. K., Bergsten, P. C., Waara, I., Fridborg, K., Strandberg, B., Carlbom, U., Järup, L., Lövgren, S. & Petef, M. (1972). Nature New Biol.235, 131–137. [DOI] [PubMed]
- Liu, L., Nogi, T., Kobayashi, M., Nozawa, T. & Miki, K. (2002). Acta Cryst. D58, 1085–1091. [DOI] [PubMed]
- McRee, D. E. (1999). J. Struct. Biol.125, 156–165. [DOI] [PubMed]
- Merritt, E. A. (1999a). Acta Cryst. D55, 1109–1117. [DOI] [PubMed]
- Merritt, E. A. (1999b). Acta Cryst. D55, 1997–2004. [DOI] [PubMed]
- Merritt, E. A. & Bacon, D. J. (1997). Methods Enzymol.277, 505–524. [DOI] [PubMed]
- Otwinowski, Z. & Minor, W. (1997). Methods Enzymol.276, 307–326. [DOI] [PubMed]
- Parisini, E., Capozzi, F., Lubini, P., Lamzin, V., Luchinat, C. & Sheldrick, G. M. (1999). Acta Cryst. D55, 1773–1784. [DOI] [PubMed]
- Read, R. J. (1986). Acta Cryst. A42, 140–149.
- Sheldrick, G. M. (2008). Acta Cryst. A64, 112–122. [DOI] [PubMed]
- Srivastava, D. K., Jude, K. M., Banerjee, A. L., Haldar, M. K., Manokaran, S., Kooren, J., Mallik, S. & Christianson, D. W. (2007). J. Am. Chem. Soc.129, 5528–5537. [DOI] [PMC free article] [PubMed]
- Steiner, H., Jonsson, B. H. & Lindskog, S. (1975). Eur. J. Biochem.59, 253–259. [DOI] [PubMed]
- Tilander, B., Strandeberg, B. & Fridborg, K. (1965). J. Mol. Biol.12, 740–760. [DOI] [PubMed]
- Vriend, G. & Sander, C. (1993). J. Appl. Cryst.26, 47–60.
Associated Data
This section collects any data citations, data availability statements, or supplementary materials included in this article.
Supplementary Materials
PDB reference: carbonic anhydrase II, 3k34
PDB reference: 1lug
PDB reference: carbonic anhydrase II, 3k34
PDB reference: 1lug


