The crystal structure of human carbonic anhydrase II with a doubled a axis from that of the usually observed monoclinic cell has been determined and refined to 1.4 Å resolution. The two molecules comprising the asymmetric unit are related by a noncrystallographic translation of ½ along a, but one of the molecules has two alternate orientations related by a rotation of approximately 2°.
Keywords: doubled axis, systematically weak data, crystal contacts, translational symmetry, rotational disorder
Abstract
The crystal structure of human carbonic anhydrase II with a doubled a axis from that of the usually observed monoclinic unit cell has been determined and refined to 1.4 Å resolution. The diffraction data with h = 2n + 1 were systematically weaker than those with h = 2n. Consequently, the scaling of the data, structure solution and refinement were challenging. The two molecules comprising the asymmetric unit are related by a noncrystallographic translation of ½ along a, but one of the molecules has two alternate positions related by a rotation of approximately 2°. This rotation axis is located near the edge of the central β-sheet, causing a maximum distance disparity of 1.7 Å between equivalent atoms on the diametrically opposite side of the molecule. The crystal-packing contacts are similar to two sequential combined unit cells along a of the previously determined monoclinic unit cell. Abnormally high final R cryst and R free values (20.2% and 23.7%, respectively) are not unusual for structures containing pseudo-translational symmetry and probably result from poor signal to noise in the weak h-odd data.
1. Introduction
Carbonic anhydrases (CAs) are widely distributed in all forms of living organisms. They catalyze the reversible conversion of CO2 and water to bicarbonate and play a significant role in a number of physiological processes including respiration, fluid secretion and pH control. Human CA II (HCA II), which is the most thoroughly studied of the CAs, is one of the fastest enzymes known, functioning at near diffusion control with a k cat/K m for hydration of 108 M −1 s−1. To date, nearly 300 wild-type and mutant HCA II crystal structures with and without inhibitors have been deposited in the Protein Data Bank (PDB; Berman et al., 2000 ▶). The overall topology of HCA II is a core ten-stranded twisted β-sheet with seven surface α-helices. Located near the center of the molecule is the active-site Zn atom, which lies at the base of a solvent-filled conical depression. The zinc is coordinated to three histidine residues and a water molecule or hydroxyl ion in a distorted tetrahedral geometry.
The most commonly occurring crystal polymorph of HCA II in the PDB belongs to the monoclinic space group P21, with unit-cell parameters a ≃ 42, b ≃ 41, c ≃ 73 Å, β ≃ 104°, and contains one molecule in the asymmetric unit. These monoclinic crystals were originally reported by Liljas and coworkers in 1988 (PDB code 1ca2; Eriksson et al., 1988 ▶). Over the past decade, there have been anecdotal reports of monoclinic crystals of HCA II with a doubled a axis that presumably contain two molecules in the asymmetric unit. However, a full structure determination based upon these rarely occurring crystals has not been reported. A brief report described partial high-resolution data measured from one of these crystals (Duda et al., 2001 ▶), but the structure was never determined. The structure of HCA II in the doubled unit cell (a = 84.0, b = 41.1, c = 73.6 Å, β = 109.3°) has been solved by molecular-replacement methods using synchrotron data and has been refined to 1.4 Å resolution. A comparison of this crystal polymorph with that in the more common smaller monoclinic unit cell shows that the molecules share the same lattice, but one of the two molecules in the larger cell is disordered.
2. Experimental procedures
2.1. Expression and purification
Cloning and expression of wild-type HCA II followed the procedures normally used in this laboratory (Domsic et al., 2008 ▶). The HCA II gene was expressed in a recombinant strain of Escherichia coli BL21 (DE3) pLysS containing a plasmid encoding the HCA II gene (Forsman et al., 1988 ▶). Purification was carried out using affinity chromatography as described previously (Khalifah et al., 1977 ▶). Briefly, cells were enzymatically lysed with hen egg-white lysozyme and the lysate was passed through agarose resin coupled with the HCA II inhibitor p-(aminomethyl)benzenesulfonamide. The bound HCA II was eluted with 0.4 M sodium azide, 100 mM Tris pH 7.0 and the azide was removed by extensive dialysis against 10 mM Tris pH 8.0. Protein concentration was carried out by centrifugal ultrafiltration; the final protein concentration was determined by spectrophotometric analysis and the purity was assessed by SDS–PAGE (data not shown).
2.2. Crystallization, diffraction data collection and structure solution
Crystals of HCA II were grown using the hanging-drop vapor-diffusion method at room temperature. Crystallization drops were prepared by mixing 5 µl protein at a concentration of ∼5 mg ml−1 in 50 mM Tris pH 7.8 with 5 µl precipitant solution consisting of the same Tris buffer containing 1.2 M sodium citrate. These drops were equilibrated against 1 ml precipitant solution. Crystals appeared within 7 d and were dipped into cryoprotectant solution [30%(v/v) glycerol in precipitant solution] before being flash-cooled at 100 K for X-ray data collection.
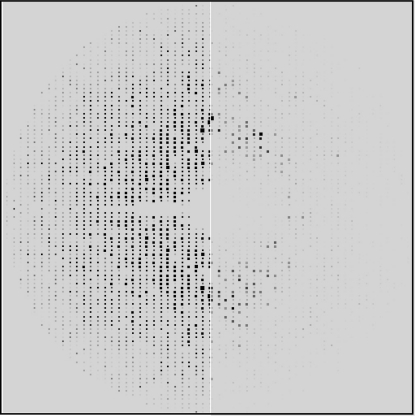
Diffraction data were measured on Cornell High Energy Synchrotron Source (CHESS) beamline A1 at a wavelength of 0.978 Å. A total of 300, 0.5° oscillation, frames were measured with an exposure time of 2 s and a crystal-to-detector distance of 90 mm. All diffraction data were integrated and scaled with HKL-2000 (Otwinoski & Minor, 1997 ▶). The data were characterized by alternating strong (h-even) and weak (h-odd) reflections. A pseudo-precession photograph of the 0kl and 1kl zones calculated from the scaled intensities is shown in Fig. 1 ▶.
Figure 1.
Pseudo-precession photograph calculated on intensities for 0kl (left) and 1kl (right) layers using the PRECESS_X utility from the PHASES package (Furey & Swaminathan, 1997 ▶). Both sides of figure are scaled equally, with an arbitrary floor of 790 for the highest intensity bin.
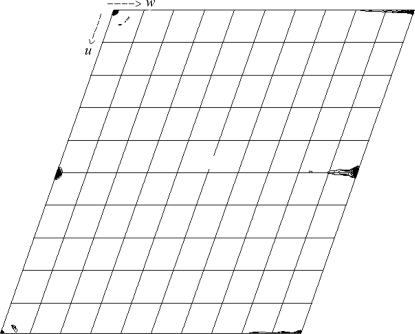
The structure of HCA II in the doubled monoclinic crystals was solved by the molecular-replacement method in space group P21 using the CNS software suite (Brünger et al., 1998 ▶). The structure of HCA II refined at 1.05 Å resolution (PDB code 2ili; Fisher et al., 2007 ▶) with all waters removed was used as the starting model. Diffraction data between 15 and 4 Å resolution were used for the rotation-function and translation-function searches. Pseudo-translational symmetry was apparent in the molecular-replacement results. A single highest peak was observed in both the cross rotation-function and translation-function searches, resulting in a Patterson correlation coefficient of 0.30 following the translation search. When the coordinates of the best solution (chain A) for the translation search were held fixed, a second cycle of translation search located the second molecule (chain B) at x′ ≃ x + a/2, with a correlation coefficient of 0.79. This translational symmetry was confirmed in the v = 0 section of a 3.5 Å Patterson map (Fig. 2 ▶). The 4 Å cross rotation and translation searches identified similar solutions, aside from an origin choice along the a axis, when used with either h-even or h-odd data only. However, only the solution from the h-odd data could be refined further. It is possible that the strongest low-angle data were overloaded and omitted from the h-even data, thus compromising the rotation or translation function using this portion of data.
Figure 2.
Native v = 0 Patterson map calculated at 3.5 Å resolution, showing the noncrystallographic translation peak at u = 1/2, w = 0. The map was calculated using CCP4 (Collaborative Computational Project, Number 4, 1994 ▶).
2.3. Refinement of the model
Preliminary refinement of the starting molecular model was performed with the CNS package at 2.5 Å and was extended to 1.7 Å resolution. This model was then used as the initial model for refinement at 1.4 Å resolution using the PHENIX software package (Adams et al., 2002 ▶). Changes to the model between cycles of refinement were made using the graphics program Coot (Emsley & Cowtan, 2004 ▶). Default protein restraints were based on accepted protein geometry (Engh & Huber, 1991 ▶). Individual restrained positional refinement was carried out on the A-chain atoms and the side-chain atoms of the B chain. The main-chain atoms of the two positions of the B chain (B′ and B′′; see §3.3) were refined independently as rigid bodies. All non-H atoms were refined with isotropic temperature factors and TLS treatment of the A and B chains as independent groups. Based on the temperature-factor ratios between atoms in alternate positions, fixed occupancies of 0.6 and 0.4 were set for the B′ and B′′ alternate positions of the B chain, respectively. Alternate positions for monomer A were not observed.
Originally, the high-resolution limit for processing of the data and refinement was 1.25 Å, but the R values of the refined model were elevated in the resolution bins beyond 1.4 Å and the higher resolution electron-density maps were qualitatively noisier. Analysis of the weak h-odd data showed that the mean I/σ(I) was only 1.4 beyond 1.4 Å resolution. Consequently, the data were rescaled using HKL-2000 (Otwinowski & Minor, 1997 ▶) to a resolution limit of 1.4 Å and the free-R list of reflections was retained. Data statistics are included in Table 1 ▶.
Table 1. Refinement and model statistics.
Values in parentheses are for the highest resolution bin.
| Space group | P21 |
| Unit-cell parameters (Å, °) | a = 84.0, b = 41.1, c = 73.6, β = 109.3 |
| Molecules in asymmetric unit | 2 |
| VM (Å3 Da−1) | 2.07 |
| Solvent content (%) | 40.6 |
| Resolution (Å) | 17.9–1.4 (1.45–1.4) |
| No. of unique reflections | 90672 (8910) |
| Completeness (%) | 96.8 (95.7) |
| Redundancy | 3.1 (3.1) |
| Rmerge† | 6.3 (19.6) |
| 〈I/σ(I)〉 | 14.5 (6.1) |
| No. of reflections used for Rcryst (|Fo| > 0) | 85788 |
| No. of reflections used for Rfree (|Fo| > 0) | 4588 (5.1) |
| Rcryst‡/Rfree§ | 20.2/23.7 |
| Maximum-likelihood estimated coordinate error (Å) | 0.2 |
| R.m.s. deviations | |
| Bond lengths (Å) | 0.006 |
| Bond angles (°) | 1.12 |
| Ramachandran statistics (%) | |
| Favored | 88.1 |
| Allowed | 11.4 |
| Generously allowed | 0.5 |
| No. of protein atoms (including alternate conformations) | 6177 |
| No. of Zn atoms | 2 |
| No. of solvent atoms | 536 |
| Average B factors (Å2) | |
| Main chain | 19.9 |
| Side chain | 15.5 |
| Zn | 8.8 |
| Solvent | 19.1 |
R
merge = 
 .
.
R
cryst =  −
− 
 .
.
R free is calculated in same manner as R cryst except that it uses 5% of the reflection data omitted from refinement.
After additional rounds of refinement and model building, a final round of PHENIX refinement was carried out using anisotropic temperature factors for the A chain and solvent and isotropic temperature factors for the B chain and including individual coordinate refinement for the main-chain atoms of the B chain. The final model contained two HCA II chains consisting of amino acids 4–261 each, two Zn atoms and 536 water molecules. This model has an R cryst of 20.2% and an R free of 23.7% for all measured data at 1.4 Å resolution. A Ramachandran plot (PROCHECK; Laskowski et al., 1993 ▶) of the final model showed 88.1% of the amino acids in the most-favored region, 11.4% in the additionally allowed region and 0.5% in the generously allowed region. Complete refinement and model statistics are included in Table 1 ▶. The refined model of the structure in the doubled monoclinic cell could be used in preliminary refinements using data from two other crystals (data not shown): one at 1.9 Å resolution and the second being the partial 1.2 Å resolution data set (Duda et al., 2001 ▶).
3. Results and discussion
3.1. Unusually high R factors and pseudosymmetry
Normally, at a resolution of 1.4 Å and assuming accurate data measurement and completeness one would expect the R cryst value to approach 15% within ∼0–3%. Since the R cryst value of 20.2% for the doubled cell is higher than this range, the raw intensity data were examined. It was already known that the data contained weak data alternating with strong data (Fig. 1 ▶). The intensities were separated into h even and h odd and compared separately. The calculated R cryst values for the two halves of the data were 17.4 and 39.9%, respectively. The mean intensities of the h-even and h-odd data were 714 and 52.6, respectively, giving a I heven/I hodd ratio of 13.6. Furthermore, 6180 of the 6610 (93%) reflections with I < 0 were h-odd data.
When R values are calculated, the contribution of systematically weak data to the denominator causes an artificially high result. Furthermore, weak data are characterized by decreased signal to noise, resulting in less reliable diffraction measurements, which also contribute to high R values. Similar high R values in a crystal structure containing pseudo-symmetry have been addressed previously (Vajdos et al., 1997 ▶). An example of pseudo-translational symmetry combined with twinning has also been also reported (Brooks et al., 2008 ▶), although the high R values were not discussed. In the latter case, the authors discussed the possibility that a noncrystallographic symmetry operator coinciding with crystallographic symmetry in a higher space group may induce twinning in the lower symmetry space group. In the doubled HCA II monoclinic cell there is no possibility of merohedral twinning, nor are there diverging rows of diffraction spots in the raw data frames characteristic of epitaxial crystal twinning in monoclinic space groups.
3.2. Evolution of the molecular model during refinement
During refinement of the model, it became obvious that many residues in the B monomer had alternate positions. Originally, two locations were found for 35 amino acids all located near one edge of the central β-sheet: residues 55–69 and 162–181. Subsequently, a trial SHELXL (Sheldrick, 2008 ▶) refinement with anisotropic atomic displacement parameters (ADPs) revealed that an additional 75 amino acids may also have alternate positions. These were detected in the .lst diagnostic file, which provides two sets of coordinates for each atom judged to have possible alternate positions.
After extracting the two sets of Cα coordinates from the diagnostic file, they were combined with the alternate Cα coordinates for the 35 residues already refined separately. On displaying these together with the rest of the Cα coordinates in Coot it was clear that a rotational displacement may be involved, since all of the dual positions were located on one side of the molecule. Furthermore, the distance between pairs of atoms gradually decreased from the edge of the sheet towards the center of the molecule. At this point, the coordinates from the A monomer were superimposed using Coot on each of the two sets of alternate positions in order to generate a tentative model for each complete molecule. All main-chain atoms of the two alternate B monomers (B′ and B′′) were then refined as rigid bodies and the side-chain atoms were allowed to refine independently. It is thought that this model is most consistent with the diffraction data.
To examine the possibility that the rotational displacement of the B molecule arose from the imposed higher symmetry of the monoclinic space group, the structure was solved and refined in space group P1. The refined unit cell had parameters a = 42, b = 41.1, c = 73.6 Å, α = 90.0, β = 109.3, γ = 90.1°, with an R merge value on rescaling of 3.7%. Each chain was refined in PHENIX with restrained atomic positions, isotropic temperature factors and noncrystallographic restraints between the A and C chains (corresponding to the A chain in P21) and between the B and D chains. No attempt was made to model disorder in the B and D chains. As with R merge, the refined R cryst and R work also improved to 17.7% and 20.2%, respectively. If the true crystal symmetry was triclinic and the apparent rotational disorder in P21 was an artifact of imposing the 21 screw axis, then by calculating the 21 screw-related coordinates of the triclinic D chain onto the B chain should reveal the 2° rotation. This was not the case and therefore confirmed the space group as P21.
3.3. Rotational disorder in monomer B
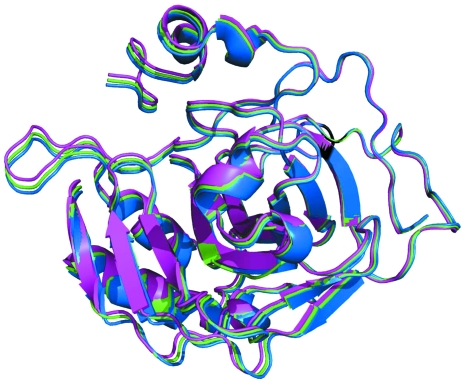
The final refined model contains alternate positions for all 257 amino acids of the B chain. In contrast to the multiple side-chain conformations seen in many other structures at this resolution, the final model is a result of a slight rotation of each of the alternate positions (B′ and B′′) from the position of the B chain if it were translated a/2 from the A chain. By calculating the distances between Cα atoms in the two alternate positions of the B chain, the minimum distances identify Asp110 and Ile33 as being close to the rotation axis. The maximum Cα—Cα distance of 1.7 Å is at Gly235, which is the most distant residue from the approximate rotation axis. Superposition of the B′′ chain onto the B′ chain in Coot results in an r.m.s. distance of 0.24 Å for 257 paired Cα positions and a 2.1° rotation. Although the deviations of each of the B-monomer positions from the translated A monomer are small (Fig. 3 ▶), these differences are the ultimate cause of the doubling of the monoclinic unit cell. Conversely, without the dual positions in the B monomer the noncrystallographic translation would become a true unit-cell translation in the smaller monoclinic unit cell.
Figure 3.
Superposition of the two alternate positions of the B chain (B′ and B′′; blue and magenta) onto the A chain translated by x′ = x + 1/2 (green). This figure was produced with PyMOL (DeLano, 2002 ▶).
In a recent report, Pletnev and coworkers (PDB code 3h1r; Pletnev et al., 2009 ▶) describe a 90° rotational order–disorder in the structure of a fluorescent protein in which the diffraction images included a subset of diffuse intensity peaks. In this instance pseudo-translational symmetry was not observed, but the diffraction data in the body-centered space group mimicked those belonging to a higher symmetry space group. In the present structure more modest rotational order–disorder is present along with translational symmetry, but the abnormal diffraction effects seen in 3h1r are not present.
3.4. Crystal-packing comparison: small to doubled monoclinic cell
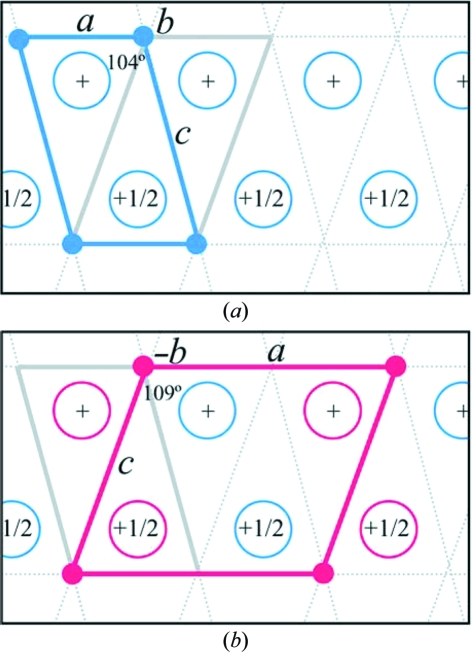
The indexing of crystal unit cells can be defined by many different vectors and different β angles (in the case of monoclinic cells), but the conventional choice of unit cell is defined by the three shortest non-coplanar edges. Two unit cells that define the smaller HCA II lattice are shown in Fig. 4 ▶(a) viewed down the unique b axis. Based on convention, the unit cell with β ≃ 104°, c ≃ 72 Å (shown in blue in Fig. 4 ▶ a) is therefore accepted over the alternate unit cell with β ≃ 109°, c ≃ 73 Å (gray in Fig. 4 ▶ a). Also according to convention, in the doubled monoclinic cell the longer of the a and c axes would normally be defined as c, but for a direct comparison with the smaller monoclinic cell a ≃ 84 Å has been used here (shown in red in Fig. 4 ▶ b). This also demonstrates why the doubled cell with β ≃ 104°, c ≃ 72 Å cannot be the true unit cell (gray in Fig. 4 ▶ b), as the relationship of the B chains (red open circles in Fig. 4 ▶ b) with respect to the A chains (blue open circles in Fig. 4 ▶ b) does not connect lattice points along c as it does in the smaller cell (shown in blue in Fig. 4 ▶ a). Consequently, the unit cell with β ≃ 109°, c ≃ 73 Å is the true (and selected) doubled monoclinic cell. It should be emphasized that ignoring the disorder in the B chains the overall packing of the molecules are identical in 2ili and 3ks1. The differences in β angle and c axis are merely a consequence of how the unit cells are defined as a result of the cell-edge doubling.
Figure 4.
Selected indexed unit cells. Simplified representation of packing diagrams for the (a) small and (b) doubled monoclinic cells. Open circles represent HCA II molecules. In (a) the blue cell outlined is the selected indexed small monoclinic cell (a ≃ 42, b ≃ 41, c ≃ 73 Å, β ≃ 104°) and contains one molecule (blue open circle) in the asymmetric unit. The gray cell outlined is an alternative but not selected small monoclinic cell (a ≃ 42, b ≃ 41, c ≃ 74 Å, β ≃ 109°) that was not selected in indexing as the c axis is larger. In (b) the red cell outlined is the selected indexed doubled monoclinic cell (a ≃ 84, b ≃ 41, c ≃ 74 Å, β ≃ 109°). This is the a-doubled cell of the not-selected small monoclinic cell shown in (a) and contains two molecules in the asymmetric unit. The blue open circles are the A-chain ordered molecules and the red open circles are the rotationally disordered B-chain (B′ and B′′) molecules. This figure was produced with PyMOL (DeLano, 2002 ▶).
4. Conclusions
One of the questions answered by this structure determination is the source of the doubling of the a axis. The apparent rotational disorder causes the B chain to differ from the A chain and is the source of the weak diffraction for the h-odd reflections interleaved with a more expected lattice similar to the well characterized small cell (Fig. 1 ▶). When compared with the Cα positions of the A chain which had been translated by ½ along the a direction, the two alternate positions of the B chain differ by r.m.s.d.s of 0.38 and 0.51 Å for the higher and lower occupancy positions, respectively (Fig. 3 ▶).
When viewed in Coot, the main chain of the translated A chain is located nearly midway between the two main-chain positions (B′ and B′′) of the B chain. From the X-ray structure reported here it is impossible to determine whether each B chain in the crystal has two alternate positions or whether some regions of the crystal have B chains in one position and some regions have B chains only in the alternate position. It is also possible that only a subset of the amino acids of the B chain have alternate positions; that is, the residues farthest from the proposed rotational disorder axis. However, this possibility is probably less likely since the active-site Zn atom and two of its histidine ligands were included in the list of possible alternate positions resulting from the SHELX anisotropic test refinement (see §3.2). It would be unlikely that two ligands of the active-site metal have two positions while the third does not.
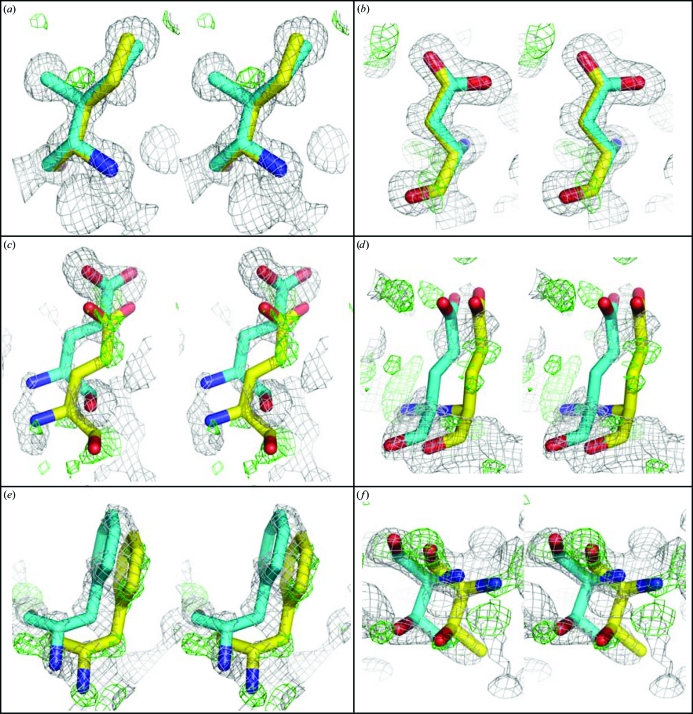
The model of the doubled a-axis HCA II presented here may be a simplified model of a much more extensive rotational disorder and merely describes two of the higher occupied versions of a continuum of states. In this study, the choice was made based upon unbiased difference density consistently translated from the refined model in a subset of the amino acids and was subsequently augmented by analysis of the anisotropic ADPs. That a model of only two alternate rotational states may not be sufficient is reinforced by the overall diffuse nature of the electron density for amino acids distant from the rotation disorder axis (Fig. 5 ▶).
Figure 5.
Stereoviews of monomer B: 2|F o| − |F c| electron density (gray) contoured at 1.3σ and |F o| – |F c| electron density (green) contoured at 2.5σ superimposed on residues (a) Ile33 and (b) Asp110 close to the rotation axis and (c) Glu234, (d) Glu236, (e) Phe176 and (f) Thr177 distant from the axis. Maps were phased using the coordinates of the A monomer and the higher occupied coordinates of B′ (cyan C atoms). The lower occupancy C atoms of B′′ are shown in yellow. Red, oxygen; blue, nitrogen. This figure was produced with PyMOL (DeLano, 2002 ▶).
Supplementary Material
PDB reference: human carbonic anhydrase II, 3ks1
Acknowledgments
We would like to thank the beamline staff at A1 of the Cornell High Energy Synchrotron Source for their assistance in data collection. We also thank Dr L. Govindasamy for insightful discussions. This work was funded by grants from the National Institutes of Health (GM25154 to RM), the MacCHESS grant (US NIH grant RR001646), DOE grant DE-FG02-97ER62443 and CHESS, which is supported by the US NSF and NIH–NIGMS through NSF grant DMR- 0225180.
References
- Adams, P. D., Grosse-Kunstleve, R. W., Hung, L.-W., Ioerger, T. R., McCoy, A. J., Moriarty, N. W., Read, R. J., Sacchettini, J. C., Sauter, N. K. & Terwilliger, T. C. (2002). Acta Cryst. D58, 1948–1954. [DOI] [PubMed]
- Berman, H. M., Westbrook, J., Feng, Z., Gilliland, G., Bhat, T. N., Weissig, H., Shindyalov, I. N. & Bourne, P. E. (2000). Nucleic Acids Res.28, 235–242. [DOI] [PMC free article] [PubMed]
- Brooks, C. L., Blackler, R. J., Gerstenbruch, S., Kosma, P., Müller-Loennies, S., Brade, H. & Evans, S. V. (2008). Acta Cryst. D64, 1250–1258. [DOI] [PubMed]
- Brünger, A. T., Adams, P. D., Clore, G. M., DeLano, W. L., Gros, P., Grosse-Kunstleve, R. W., Jiang, J.-S., Kuszewski, J., Nilges, M., Pannu, N. S., Read, R. J., Rice, L. M., Simonson, T. & Warren, G. L. (1998). Acta Cryst. D54, 905–921. [DOI] [PubMed]
- Collaborative Computational Project, Number 4 (1994). Acta Cryst. D50, 760–763.
- DeLano, W. L. (2002). The PyMOL Molecular Viewer. DeLano Scientific, Palo Alto, California, USA. http://www.pymol.org.
- Domsic, J. F., Avvaru, B. S., Kim, C. U., Gruner, S. M., Agbandje-McKenna, M., Silverman, D. N. & McKenna, R. (2008). J. Biol. Chem.283, 30766–30771. [DOI] [PMC free article] [PubMed]
- Duda, D. M., Tu, C., Silverman, D. N., Kalb, A. J., Agbandje-McKenna, M. & McKenna, R. (2001). Protein Pept. Lett.1, 63–67.
- Emsley, P. & Cowtan, K. (2004). Acta Cryst. D60, 2126–2132. [DOI] [PubMed]
- Engh, R. A. & Huber, R. (1991). Acta Cryst. A47, 392–400.
- Eriksson, A. E., Jones, T. A. & Liljas, A. (1988). Proteins, 4, 274–282. [DOI] [PubMed]
- Fisher, S. Z., Maupin, C. M., Budayova-Spano, M., Govindasamy, L., Tu, C., Agbandje-McKenna, M., Silverman, D. N., Voth, G. A. & McKenna, R. (2007). Biochemistry, 46, 2930–2937. [DOI] [PubMed]
- Forsman, C. A., Behravan, G., Osterman, A. & Jonsson, B. H. (1988). Acta Chem. Scand. B, 42, 314–318. [DOI] [PubMed]
- Furey, W. & Swaminathan, S. (1997). Methods Enzymol.277, 590–620. [DOI] [PubMed]
- Khalifah, R. G., Strader, D. J., Bryant, S. H. & Gibson, S. M. (1977). Biochemistry, 16, 2241–2247. [DOI] [PubMed]
- Laskowski, R. A., MacArthur, M. W., Moss, D. S. & Thornton, J. M. (1993). J. Appl. Cryst.26, 283–291.
- Otwinowski, Z. & Minor, W. (1997). Methods Enzymol.276, 307–326. [DOI] [PubMed]
- Pletnev, S., Morozova, K. S., Verkhusha, V. V. & Dauter, Z. (2009). Acta Cryst. D65, 906–912. [DOI] [PMC free article] [PubMed]
- Sheldrick, G. M. (2008). Acta Cryst. A64, 112–122. [DOI] [PubMed]
- Vajdos, F. F., Yoo, S., Houseweart, M., Sundquist, W. I. & Hill, C. (1997). Protein Sci.6, 2297–2307. [DOI] [PMC free article] [PubMed]
Associated Data
This section collects any data citations, data availability statements, or supplementary materials included in this article.
Supplementary Materials
PDB reference: human carbonic anhydrase II, 3ks1
PDB reference: human carbonic anhydrase II, 3ks1


