Abstract
Objective
To compare scoring methods for objective structured clinical examinations (OSCEs) using real-time observations via video monitors and observation of videotapes.
Methods
Second- (P2) and third-year (P3) doctor of pharmacy (PharmD) students completed 3-station OSCEs. Sixty encounters, 30 from each PharmD class, were selected at random, and scored by faculty investigators observing video monitors in real-time. One month later, the encounters were scored by investigators using videotapes.
Results
Intra-rater reliability between real-time and videotaped observation was excellent (ICC 3,1 of 0.951 for P2 students and 0.868 for P3 students). However, 13.3% of students' performance in both P2 and P3 cohorts changed in pass/fail determination from passing based on real-time observation to failing based on video observation, and 3.3% of students changed from failing real-time to passing on video.
Conclusions
Despite excellent overall reliability, important differences in OSCE pass/fail determinations were found between real-time and video observations. These observation methods for scoring OSCEs are not interchangeable.
Keywords: objective structured clinical examination (OSCE), reliability, assessment
INTRODUCTION
Well-constructed objective structured clinical examinations (OSCE) are a reliable and valid method of assessing health professional students' clinical and communication skills.1-3 OSCEs consist of a series of stations that prompt students to perform specified tasks within a defined amount of time. 1-3 Student performance is evaluated most often using a binary checklist and a global impression scale at the conclusion of each station by the standardized patient who participated in the encounter or a faculty member who observed the encounter.1-3 The accuracy of an assessment method is related, in part, to its reliability, an indicator of its consistency in producing the same or similar results when used in the same or similar circumstances.2-3
At our institution, prior to this study, the standardized patient completed the evaluation tools that determined whether a student passed or failed an OSCE station. However, taking into account higher-stakes OSCEs, we considered having pharmacy faculty members evaluate student performance instead. A potentially limiting factor when using faculty evaluators for an OSCE is the number of faculty members required during examination administration.1,3,4 To increase flexibility, overcome scheduling barriers, and reduce the number of faculty members who must be present during an OSCE, some schools and colleges have elected to have faculty members review and evaluate student performance at a later time, using a video recording of the encounter. Given the resources dedicated to the development and implementation of OSCEs, ensuring the reliability of the examination is important, regardless of when the assessment of student performance occurs.
To date, only 1 study examining the reliability of OSCEs has compared real-time and video recorded observations.5 Vivekananda-Schmidt and colleagues investigated inter-rater reliability between real-time and video-recorded OSCEs of 95 third-year medical students' shoulder and knee examinations using the intraclass correlation coefficient (ICC).5 Real-time OSCE encounters were scored by physicians training in rheumatology who were present in the room with the student and standardized patient during the encounter. Later, a consultant rheumatologist observed a video recording of the encounter and independently scored each student's performance. No specific training was provided for the examiners, although the real-time examiners had previous experience administering and scoring this type of OSCE. Good inter-rater reliability was observed between real-time and video-recorded assessments on a binary checklist for the shoulder examination (ICC2,1 = 0.55; 95% CI = 0.22 - 0.72) and the knee examination (ICC2,1 = 0.58; 95% CI = 0.34 - 0.75). However, poor inter-rater reliability was observed on the global impression scale for the shoulder examination (ICC2,1 = 0.36; 95% CI = -0.10 - 0.69) and knee examination (ICC2,1 = 0.32; 95% CI = -0.05 - 0.61). This study suggested that scoring OSCE stations using video recordings instead of real-time observations may not be equivalent. However, observed differences in reliability may have been attributable to the lack of rater training, differences in examiner expertise, differences in observations (direct observation vs. video monitor), or a combination of these factors.
To determine whether the time and method of observation (eg, real time or video-recorded) impacts the reliability of OSCE scores, evaluating intra-rater reliability, not inter-rater reliability, is important; but to our knowledge, no reliability studies have been published on this subject. The objective of this study was to estimate the intra-rater reliability of faculty evaluations of student OSCE performance in real-time and video-taped observations. Our hypothesis was that the 2 observation methods would be similar enough that faculty members could use either method interchangeably during an OSCE.
METHODS
During the 2007-2008 academic year, approximately 240 students enrolled in P2 and P3 of the PharmD program at the University of Maryland School of Pharmacy completed 3-station OSCEs as part of their coursework. Second-year students completed the OSCE as part of Patient-Centered Pharmacy Practice and Management II, a laboratory-based course in which students developed practice skills such as medication counseling and physical assessment. The third-year OSCE was conducted within Integrated Science and Therapeutics III/IV, a required general therapeutics course. Each OSCE was used to determine a percentage of each student's final grade. Points for each station were awarded in an all-or-none fashion, based on the pass/fail cut point determination for that station. In the second-year examination, each station counted 5% of the final grade, while in the third-year examination, each station counted 4% to 6% of the final grade. Examination stations were selected by individual course managers from a case blueprint designed to assess student achievement of the school's PharmD program terminal performance outcomes.
For this study, 1 station from each examination was chosen for inclusion. Both stations required students to collect medication histories and provide counseling to improve adherence. A subset of 30 station encounters, out of 120 total encounters from each examination, were viewed by 1 of 3 faculty investigators. This number was selected after consultation with an expert in educational psychometrics. The encounters chosen for inclusion were selected at random, based on the availability of the faculty investigators to be present at the time of the examination. Each individual faculty investigator rated a total of 20 encounters. Investigator A rated only second-year examination encounters, investigator B rated only third-year examination encounters, and investigator C rated 10 encounters from each examination, for a total of 60 unique observations.
OSCE station cases were written and validated by a team of faculty volunteers who received training in OSCE case writing. Cases were written by a group of 3 to 4 members, and then reviewed by a second group of 3 to 4 members for peer validation. Case writing and validation included development of an analytical checklist of technical items or tasks to be observed during the student's performance. Case standards for the analytical checklist were set by a larger group of volunteers (typically 8 to 12 participants) using the Angoff method.6 In addition to the analytical checklist, a standard global impression scale (available from the author upon request) was used to rate the student's performance at each station. Students passed a station if their performance met or exceeded the standard cut point set on both the analytical checklist and the “overall impression” component of the global impression scale. For the stations selected for this analysis, the passing score for the second-year examination was 8 out of 13 on the analytical checklist and 2 or higher on the overall impression rating. For the third-year examination station, the passing score was set at 6 out of 9 on the analytical checklist and 3 on the overall impression rating. Actual pass/fail determination for assigning the course grade was based on the standardized patient's evaluation of student performance, which was usual protocol. The faculty member's evaluation of student performance for determining reliability was included solely for this investigation.
Students completed the OSCE in a 10-room facility on campus. Each room was equipped with video recording capabilities, and all encounters were captured on videotape. The facility also contained a control room where “real-time” video feed from each room could be monitored remotely via television monitors and headsets.
One day prior to the examinations, the 3 faculty investigators met to review the analytical checklists and the global impression scale, discuss the wording of each instrument, and anticipate potential differences in interpretation that might lead to inconsistencies. Although intra-rater reliability was the primary focus of this study, the investigators wanted to maximize inter-rater reliability as much as possible.
On the day of the examination, faculty investigators observed their assigned encounters and rated student performance from real-time video and audio feed using television monitors and headsets located in a control room. The video feed of the encounter was simultaneously videotaped. Thus, the real-time observations were replicated for use during the video observations. Each investigator observed 10 consecutive student encounters over a 3½ hour OSCE session. Each investigator attended 2 sessions and completed 20 observations. Approximately 1 month later, each investigator watched the video recording of the assigned encounters and re-rated student performance. This timeframe for re-review was chosen after consulting with an expert in educational psychometrics. While the investigator may have recalled the student's previous performance, the evaluator was not permitted to review or refer to notes, the analytical checklist, or the global impression scale from the real-time observation. Investigators were, however, permitted to stop and rewind the video recording. The faculty evaluators were also permitted to determine their own schedules for reviewing the encounters. Thus, they may not have reviewed the same number of encounters without interruptions or breaks as they had during the real-time sessions. These alterations in behavior were allowed with the assumption that watching encounters on video enabled greater flexibility and such behavior would naturally occur. This study design was approved by the Institutional Review Board at the University of Maryland, Baltimore.
Descriptive statistics were used to determine the mean checklist scores for the real-time and video observations, the percentage of students who passed or failed each station based on the real-time and video observations, and the percentage of students who had a change in the pass/fail decision based on real-time and video observations. Differences between the mean checklist scores were analyzed using the Wilcoxon signed-rank test, and differences in pass/fail determinations were analyzed using chi square. The overall reliability of the analytical checklist score between real-time vs. video was determined using the intraclass correlation coefficient 3,1. An ICC value of less than 0.4 indicates poor agreement, between 0.4 and 0.8 indicates fair to good agreement, and greater than 0.8 indicates excellent agreement.7 Individual analytical checklist items were examined to determine percent agreement between the real-time and video observations. To determine educational significance of observed differences, a 1- point change in the analytical checklist score and a shift of 1 unit on the global impression scale was considered important because such small changes could result in different pass/fail decisions.
RESULTS
Real-time observations occurred May 9 through May 14, 2008, and repeat video observations occurred mid-June 2008. Nothing unusual happened during the examination or review timeframe that may have adversely impacted student performance or altered faculty evaluators' ratings of student performance.
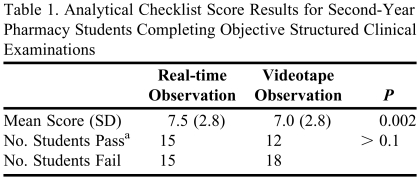
Analysis results of the P2 OSCE station analytical checklist are presented in Table 1. There was a high degree of agreement between the 2 observations, with an ICC(3,1) of 0.951. The analytical checklist was scored differently in 15 of the 30 encounters observed. Checklist scores differed by no more than 2 points in all cases. For those encounters in which the pass/fail determination was different, students were more likely to receive a failing score when the video observation was used. Specifically, 4 students who passed upon real-time observation failed on video observation (13.3% of cohort) while 1 student who failed upon real-time observation passed on video observation (3.3% of cohort). On the overall assessment rating of the global impression scale, differences in ratings were noted in 11 of 30 cases. However, none resulted in a different pass/fail determination.
Table 1.
Analytical Checklist Score Results for Second-Year Pharmacy Students Completing Objective Structured Clinical Examinations
a Passing score defined as ≥8 out of 13 on analytical checklist
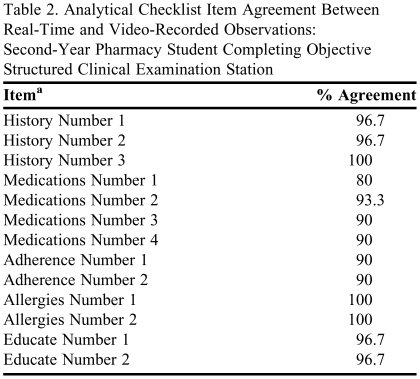
Agreement between real-time and video observations on individual analytical checklist items was ≥90% for all but 1 checklist item, which rated ability of the student to collect the names of all prescription, nonprescription, and herbal drug treatments (Table 2). However, in no case did a change in the rating of a single analytical checklist item change the pass/fail determination.
Table 2.
Analytical Checklist Item Agreement Between Real-Time and Video-Recorded Observations: Second-Year Pharmacy Student Completing Objective Structured Clinical Examination Station
a Items have been grouped and categorized to protect integrity of the analytical checklist
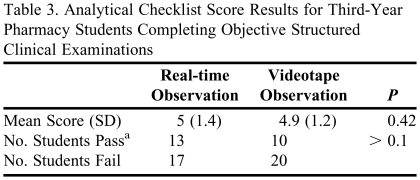
Analysis results of the P3 OSCE station analytical checklist are presented in Table 3, and findings are similar to the P2 OSCE station, with an ICC(3,1) of 0.868. Analytical checklist scores differed between real-time and video observations in 15 of the 30 encounters observed, and checklist scores differed by no more than 1 point in all cases. For those encounters in which a pass/fail determination was different, students were more likely to receive a failing score when the video observation was used. Specifically, 4 students who passed real-time failed on video (13.3% of cohort) while 1 student who failed real-time passed on video (3.3% of cohort). The score on the overall assessment rating of the global impression scale was different in 12 of 30 cases, resulting in a different pass/fail determination in 1 case. This student was judged to have a failing performance on the real-time observation and a passing performance on the videotaped observation.
Table 3.
Analytical Checklist Score Results for Third-Year Pharmacy Students Completing Objective Structured Clinical Examinations
a Passing score defined as ≥ 6 out of 9 on analytical checklist
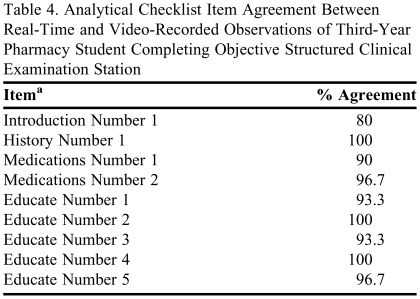
Percent agreement on individual checklist items was ≥90% for all but 1 checklist item (Table 4). This item rated the students' ability to justify their role as pharmacist to patient. Unlike the second-year station, this item played a role in changing pass/fail determinations in 3 out of 4 cases.
Table 4.
Analytical Checklist Item Agreement Between Real-Time and Video-Recorded Observations of Third-Year Pharmacy Student Completing Objective Structured Clinical Examination Station
a Items have been grouped and categorized to protect integrity of the analytical checklist
DISCUSSION
In this small study at one US pharmacy school, we found potentially important differences in pass/fail determinations between real-time and video OSCE observations despite excellent reliability, suggesting that the 2 methods are not similar enough to be interchangeable within a single examination. Because OSCE procedures generally require students to achieve a minimum score to pass an OSCE station, a change in the scoring of a single item or a shift of 1 unit on a Likert rating scale could alter pass/fail determinations. However, surprising in our study was the consistent finding that scores on videotaped observations tended to be lower, and thus more likely to be scored as a failing performance. This difference cannot be explained by differences in vantage point or visual or auditory information available to the evaluator. Real-time observations were performed using a video feed displayed on a monitor. Therefore, the real-time and video observations were exact replicas. Although recall bias from the first observation may be cited as a potential reason for the observed differences, we feel that the timeframe for re-review and the consistent finding that scores tended to be lower on re-review (not evenly distributed as one would expect, if recall bias led investigators to remember both positive and negative student performances) indicate that this type of bias is unlikely to have played a role in the study.
While this study cannot explain these findings, differences in observation procedures may explain why video observations resulted in lower scores. During real-time observation, examiners may have given credit for analytical checklist items when there was uncertainty. When using video recordings to assess OSCE performance, however, the examiner was able to pause and rewind portions of the encounter, enabling more careful scrutiny of the student's performance. Given that examiners were unable to re-check real-time observations, a greater degree of uncertainty might have resulted in higher overall analytical checklist scores. Another potential explanation for observed differences in pass/fail determinations was examiner fatigue. The examiner was able to take breaks and spread OSCE observations over a period of time when observing video performance, enabling the examiner to scrutinize student performances more closely. Although these 2 possible effects could be managed by instructing examiners using video to watch without interruption, and to prohibit pausing, rewinding, and re-watching, it is unknown whether such measures would alter the differences found in this study.
CONCLUSION
Real-time and video OSCE observations are not interchangeable when only a single observer is used to score performance. This study suggests that the same observation method and procedures be used within each OSCE station and that this is particularly critical if the examination is considered high-stakes.
REFERENCES
- 1.Rushforth HE. Objective structured clinical examination (OSCE): review of literature and implications for nursing education. Nurse Educ Today. 2007;27(5):481–490. doi: 10.1016/j.nedt.2006.08.009. [DOI] [PubMed] [Google Scholar]
- 2.Austin Z, O'Byrne C, Pugsley J, Munoz LQ. Development and validation process for an objective structured clinical examination (OSCE) for entry-to-practice certification in pharmacy: the Canadian experience. Am J Pharm Educ. 2003;67(3) Article 76. [Google Scholar]
- 3.Epstein RM. Assessment in medical education. NEJM. 2007;356(4):387–396. doi: 10.1056/NEJMra054784. [DOI] [PubMed] [Google Scholar]
- 4.Stowe CD, Gardner SF. Real-time standardized participant grading of an objective structured clinical examination. Am J Pharm Educ. 2005;69(3) Article 41. [Google Scholar]
- 5.Vivekananda-Schmidt P, Lewis M, Coady D, et al. Exploring the use of videotaped objective structured clinical examination in the assessment of joint examination skills of medical students. Arthritis Rheum. 2007;57(5):869–876. doi: 10.1002/art.22763. [DOI] [PubMed] [Google Scholar]
- 6.Downing SM, Haladyna TM. Handbook of Test Development. Mahwah, NJ: Lawrence Erlbaum Associates; 2006. pp. 239–240. [Google Scholar]
- 7.Fleiss JL. The Design and Analysis of Clinical Experiments. New York, NY: John Wiley & Sons; 1986. p. 7. [Google Scholar]


