Abstract
Early Growth Response-1 (Egr-1) is overexpressed in human prostate tumors and contributes to cancer progression. On the other hand, mutation of p53 is associated with advanced prostate cancer, as well as with metastasis and hormone independence.
This study shows that in prostate cell lines in culture, Egr-1 overexpression correlated with an alteration of p53 activity due to the expression of SV40-TAg or to a mutation in the TP53 gene. In cells containing altered p53 activity, Egr-1 expression was abolished upon pharmacological inhibition or RNAi silencing of p53. Although forced expression of wild-type p53 was not sufficient to trigger Egr-1 transcription, four different mutants of p53 were shown to induce Egr-1. Direct binding of p53 to the EGR1 promoter could not be detected. Instead, Egr-1 transcription was driven by the ERK1/2 pathway, since it was abrogated by specific inhibitors of MEK. Egr-1 increased the transcription of HB-EGF, amphiregulin and epiregulin, resulting in autocrine activation of the EGFR (epidermal growth factor receptor) and downstream MEK/ERK cascade. Thus, mutant p53 initiates a feedback loop that involves ERK1/2-mediated transactivation of Egr-1, which in turn increases the secretion of EGFR ligands and stimulates the EGFR signaling pathway. Finally, p53 may further regulate this feedback loop by altering the level of EGFR expression.
Keywords: p53, Egr-1, prostate cancer, EGF receptor, SV40 large T antigen
INTRODUCTION
Prostate cancer is the second leading cause of cancer-related mortality for men in the United States (Jemal et al., 2007). The disease progresses from begnin hyperplasia to aggressive hormone-independent cancer which is resistant to chemotherapy and radiation. The identification of key effectors of progression remains a crucial challenge.
Good evidence now supports the notion that Early Growth response-1 (Egr-1) promotes the progression of prostate cancer (reviewed in (Gitenay and Baron, 2009)). Egr-1 is an early response transcription factor induced by a wide range of growth factors and stress signals. The transcription of Egr-1 is increased mostly by the Mitogen Activated Protein-kinase (MAP-K) signaling pathway through phosphorylation and activation of transcription factors of the Elk-1 family by ERK1/2, p38MAP-K and/or JNK (reviewed in (Silverman and Collins, 1999; Thiel and Cibelli, 2002)). A seminal study from J. Milbrandt’s laboratory showed that breeding of Egr-1 knock-out mice with transgenic mouse models of prostate cancer delays tumor progression (Abdulkadir et al., 2001). In addition, Egr-1 silencing in prostate cancer cells decreases cell proliferation in vitro (Baron et al., 2003; Virolle et al., 2003), whereas injection of Egr-1 antisense delays tumor growth in TRAMP mice (Baron et al., 2003). The fact that Egr-1 interacts with the androgen receptor (AR) and regulates AR-mediated transcription suggests that Egr-1 may affect prostate cells differently than other cell types (Yang and Abdulkadir, 2003). Finally, Egr-1 is overexpressed in human prostate adenocarcinoma compared to normal tissues, and expression levels correlate with Gleason scores (Eid et al., 1998; Thigpen et al., 1996). The mechanism leading to Egr-1 overexpression, however, is unknown.
This study explores the molecular basis for Egr-1 overexpression in prostate cancer. We report that elevated Egr-1 expression correlated with high p53 expression and with an alteration of p53 activity in prostate cancer cells.
We uncover a molecular mechanism that involves the activation of MEK/ERK by mutant p53, leading to Egr-1 transcription. Egr-1 in turn establishes a positive feedback loop through constitutive activation of the EGFR/ERK signaling cascade, and increases the secretion of cytokines know to promote prostate cancer progression.
MATERIALS AND METHODS
Antibodies and reagents
Antibodies against Egr-1 (#4152 and #4153), p53 (#2524), phospho-ERK1/2 (#9106 and #9101), and phospho-AKT-Ser473 (#4051) were from Cell Signaling Technology (Danvers, MA). Antibodies to p53 (FL-393), EGFR (sc-03), p21 (sc-397) and ERK1/2 (sc-154), were purchased from Santa Cruz Biotechnology Inc. (Santa Cruz, CA). Antibodies to β-actin (AC-15) were from Sigma-Aldrich (St Louis, MO); neutralizing anti-EGFR antibodies (#05-101), antibodies to phospho-tyrosine (4G10) and ChIP-p53 antibody (#17-613) came from Millipore (Billerica, MA); ChIP-Pol-II and ChIP-IgG were from Sigma-Aldrich.
PD98059, PD168393, Nutlin-3 and Pifithrin-α were purchased from Calbiochem (San Diego, CA). Cell culture media were obtained from Invitrogen (Carlsbad, CA) whereas serum and other additives were from Mediatech (Herndon, VA).
Plasmids
pCMV-Egr-1 and pCMV were kindly provided by Dr. E. Adamson (UC Irvine, Irvine, CA). pCMV-Neo-Bam p53-wt (Addgene plasmid 16434); pCMV-Neo-Bam p53-V143A (Addgene plasmid 16435); pCMV-Neo-Bam p53-R175H (Addgene plasmid 16436); pCMV-Neo-Bam p53-R249S (Addgene plasmid 16438); pCMV-Neo-Bam p53-R273H (Addgene plasmid 16439) were originally described by Baker et al (Baker et al., 1990) and were obtained from Addgene (www.adgene.org).
Cell culture
PrEC prostate epithelial cells were purchased from Lonza (Basel, Switzerland) and were grown in Prostate Epithelial Basal Medium supplemented with growth factors provided as a bullet kit. WPMY-1, RPWE-1 and LNCaP cells were kindly provided by Dr. D. Tyson and Dr. D. Mercola (both at University of California, Irvine). 267B and 267B-KRas were from Dr. J. Rhim (Uniformed Services University of Health Sciences, Bethesda, MA). P69 and M12 were from Dr. E. Adamson. Other cell lines were purchased from ATCC (American Tissue Culture Collection).
WPMY-1 were grown in DMEM supplemented with 5% FBS, whereas RPWE-1 were grown in Keratinocyte Basal Medium-2 and a supplement kit (Lonza). 267B and 267B-KRas were grown in RPMI-1640 containing 5% FBS. 22Rv1 and LNCaP cells were grown in RPMI-1640 Medium containing 10% FBS and 4.5 g/l glucose. P69, M12, DU145 and PC-3 cells were grown in RPMI-1640, 10% FBS. All media contained 2mM L-glutamine, 100 U/ml penicillin, and 100 μg/ml streptomycin. Cells were maintained in a humidified incubator at 37°C and 5% CO2.
Transfection
Oligonucleotides
Egr-1 antisense oligonucleotides have been described previously (Baron et al., 2003). Cells were seeded at a density of 15 000 cells/cm2 the day before transfection. Briefly, 6 μl of Oligofectamine™ (Invitrogen) was mixed with 100 nM control oligonucleotide or Egr-1 antisense for a final volume of 2 ml (60 mm dish). Incubation was carried out overnight at 37°C. The transfection medium was removed and cells were maintained in growth medium until use.
The p53-specific ON-TARGET plus siRNA – SMART pool (Dharmacon, Fisher Scientific, USA) was used to silence p53 in DU145 cells. Transfection was performed using Dharmafect-3 following the vendor’s protocol.
DNA plasmids
Cells were seeded at a density of 30 000 cells/cm2 the day before transfection in order to achieve 80% confluence. Transfection was performed using Lipofectamine™ 2000 (Invitrogen) with a DNA to lipid ratio of 2 μg/6 μl, in a final volume of 2 ml (6-wells). After 5 hrs the medium was removed and cells were maintained in growth medium until use.
Western blot analysis of protein expression
Briefly, cells were lysed on ice in the presence of phosphatase and protease inhibitors. Lysates were clarified by centrifugation, protein concentration was determined using the BCA assay (Pierce, Rockford, IL), and lysates were resuspended in SDS-PAGE buffer. After electrophoresis, proteins were transferred to Immobilon-P® membranes (Millipore). Membranes were incubated with a blocking buffer for 30 min and the first antibody was incubated overnight at 4°C. Peroxidase-conjugated antibodies (Amersham Biosciences, Piscataway, NJ) were added for 45min at 22°C. Proteins were revealed using the Western blotting Luminol Reagent™ (Santa Cruz) followed by autoradiography. When appropriate, membranes were stripped using Restore™ Stripping Buffer (Pierce) for 15min at 22°C and reprobed with the indicated antibodies. In some experiments, densitometric analysis of the autoradiograms was carried out using a KODAK™ DC120 digital camera and the Kodak 1D image analysis software (Eastman Kodak company, Rochester, NY).
Immunoprecipitation of EGFR
Protein-G Sepharose Beads (GE Healthcare, UK) were washed twice with Tris-NaCl (50/150 mM, pH 7.5) containing 0.1% TritonX100 and phosphatase inhibitors. Antibodies to EGFR (6 μl) were added to the beads in a final volume of 200 μl for 45 min RT with gentle agitation. Cells were lysed as described in the previous section. Cleared cell lysates were incubated with the antibody-proteinG complex for 4 h at 4°C. Pellets were washed 3 times, resuspended in Laemmli buffer and analyzed by western-blot.
Quantitative RT-PCR (q-PCR)
Total RNA was extracted from cells using the RNeasy Mini Kit (Qiagen, Valencia, CA), checked for integrity by electrophoresis and quantified by spectrophotometry. 1 μg of RNA was used as a template for reverse-transcription using SAB RT-Kit (SABiosciences). The cDNA was applied to a PCR plate containing validated primers corresponding to our genes of interest (custom arrays, SABiosciences). After addition of the Master Mix, plates were run on ABI7900HT using standard parameters (with melting curves). Results were analyzed using the SDS 2.3 software. Three housekeeping genes were used as internal controls.
Semi-quantitative RT-PCR
For semi-quantitative PCR, 1 μg of RNA was used as a template for reverse-transcription with the Omniscript RT-kit (Qiagen). PCR was carried out with 50 ng of cDNA using the PCR Master Mix (Promega, Madison, WI). The sequence of the primers is given in supplemental figure S1. The PCR products were analyzed by electrophoresis in agarose gels containing ethidium bromide.
Chromatin immunoprecipitation assay (ChIP)
The CHP1 chromatin immunoprecipitation kit was used as recommended by the supplier (Sigma-Aldrich). DU145 cells were washed with PBS and treated with 1% formaldehyde for 10 min at 22°C. Fixation was quenched by addition of glycine 1.25M. Cells were washed, scraped off the plates, centrifuged and counted. Approximately 106 cells were used for each IP. Cells were solubilized in the nuclei preparation buffer, centrifuged 10 min at 500 rpm, and the shearing buffer was added. DNA was sheared by sonication (4 × 8 sec, with a 2 min rest on ice between each pulse) to obtain fragments in the 1000pb range, as assessed by agarose electrophoresis. The sheared DNA was added to the antibodies (1 μl of ChIP-p53, ChIP-Pol-II, or ChIP-IgG; 8 μl of Egr-1 antibody #4153). The incubation was performed overnight at 4°C. The complexes were washed and the DNA-protein cross-linking was reversed with the DNA release buffer containing Proteinase-K for 15 min at 65°C, followed by incubation in the Reversing Solution for 90 min at 65°C. The DNA was purified using a column system included with the kit. PCR amplification was performed using the HotStar-TaqPlus Master Mix (Qiagen) using specific primers for the promoter region of interest. Primer sequences are provided in Supplement Figure S2.
Protein arrays
Cells were plated at a controlled density and cultured in serum-free medium for 72 hrs. The conditioned medium was collected, frozen, and analyzed by multiplex protein array at various dilutions (SearchLight Custom Arrays Services, Thermo Fisher Scientific, Woburn, MA).
RESULTS
Altered p53 activity correlates with Egr-1 overexpression in prostate cancer cells
To understand the molecular mechanism leading to Egr-1 overexpression in prostate cancer, we compared the level of the protein in a series of prostate cell lines. The characteristics of each cell line are provided in Table 1. This analysis was carried out in untreated cells, which were plated at a controlled density the day before the experiment in order to minimize growth differences between cell lines.
Table 1.
Characteristics of the prostate cells used in this study. PrEC are primary prostate epithelial cells. 267B-KRas cells, derived from 267B, have been transformed by stable expression of K-Ras. M12 is a metastatic subclone of P69. LNCaP, 22Rv1, DU145 and PC3 cells were established from human tumors. SV40-T: SV40 Large T-antigen; hPV18: human papilloma virus 18.
| WPMY1 | PrEC | RPWE1 | 267B | 267B-KRAS | P69 | M12 | DU145 | PC3 | 22Rv1 | LNCaP | |
|---|---|---|---|---|---|---|---|---|---|---|---|
| Cell type | Stromal | Epithelial | Epithelial/adenocarcinoma | ||||||||
| transformed | No | No | No | No | YES/KRAS | No | Yes | Yes | Yes | Yes | Yes |
| immortalized | SV40-T | No | hPV18 | SV40-T | SV40-T | SV40-T | SV40-T | No | No | No | No |
| P53 function | altered | normal | lost | altered | altered | altered | altered | mutant | deleted | normal | normal |
| Ref | (Bello et al., 1997) | (Bello et al., 1997) | (Ramsamooj et al., 1997) | (Parda et al., 1993) | (Bae et al., 1994) | (Stone et al., 1978) | (Kaighn et al., 1979) | (Sramkoski et al., 1999) | (Horoszewicz et al., 1980) | ||
References:
Bae VL, Jackson-Cook CK, Brothman AR, Maygarden SJ, Ware JL (1994). Tumorigenicity of SV40 T antigen immortalized human prostate epithelial cells: association with decreased epidermal growth factor receptor (EGFR) expression. Int J Cancer 58: 721–9.
Bello D, Webber MM, Kleinman HK, Wartinger DD, Rhim JS (1997). Androgen responsive adult human prostatic epithelial cell lines immortalized by human papillomavirus 18. Carcinogenesis 18: 1215–23.
Horoszewicz JS, Leong SS, Chu TM, Wajsman ZL, Friedman M, Papsidero L et al (1980). The LNCaP cell line--a new model for studies on human prostatic carcinoma. Prog Clin Biol Res 37: 115–32.
Kaighn ME, Narayan KS, Ohnuki Y, Lechner JF, Jones LW (1979). Establishment and characterization of a human prostatic carcinoma cell line (PC-3). Invest Urol 17: 16–23.
Parda DS, Thraves PJ, Kuettel MR, Lee MS, Arnstein P, Kaighn ME et al (1993). Neoplastic transformation of a human prostate epithelial cell line by the v-Ki-ras oncogene. Prostate 23: 91–8.
Ramsamooj P, Kuettel M, Dritschilo A, Jung M (1997). p53-Independent tumorigenic progression of human prostate cells. Radiat Oncol Investig 5: 269–74.
Sramkoski RM, Pretlow TG, 2nd, Giaconia JM, Pretlow TP, Schwartz S, Sy MS et al (1999). A new human prostate carcinoma cell line, 22Rv1. In Vitro Cell Dev Biol Anim 35: 403–9.
Stone KR, Mickey DD, Wunderli H, Mickey GH, Paulson DF (1978). Isolation of a human prostate carcinoma cell line (DU 145). Int J Cancer 21: 274–81.
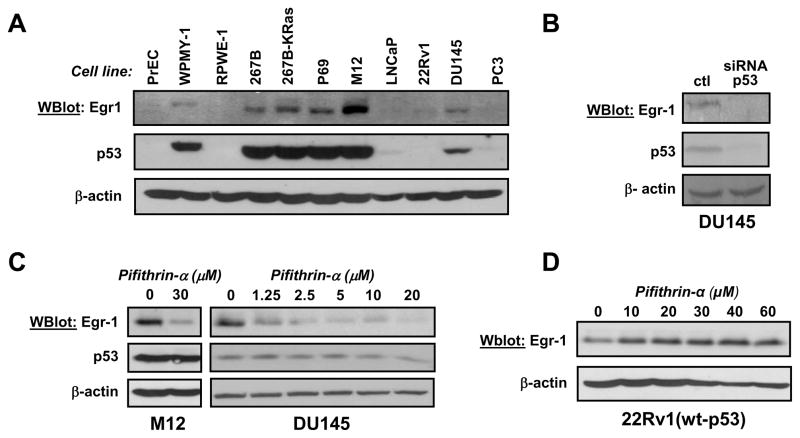
As shown in figure 1A, Egr-1 protein expression in prostate cells correlated with high levels of p53 (see also Supplement figure S3). Indeed, Egr-1 expression was barely detectable in the five cell lines containing wild-type p53 (wt-p53) or in PC3 cells that have a deletion in the TP53 gene. In contrast, five other cell lines that exhibited Egr-1 overexpression also contained high p53 owing to its interaction with SV40 large T-Antigen (SV40-TAg) used for immortalization. Egr-1 was overexpressed in DU145 cells, which are derived from a human tumor and display mutations in the TP53 gene that result in the stabilization of the protein (Isaacs et al., 1991).
Figure 1. Egr-1 expression in prostate cell lines.
(Panel A) Prostate cells were plated at a controlled density the day before lysis. Protein expression was analyzed by western blot using antibodies against Egr-1. Membranes were reprobed with antibodies against p53. (Panel B) DU145 cells were transfected with p53-siRNA (50 nM). A mock transfection was performed as control (ctl). Cells were lysed after 48 hrs and protein expression was analyzed by western blot.
(Panel C) M12 and DU145 cells were treated with Pifithrin-α for 16 hrs. After lysis, protein expression was analyzed by western blot. (Panel D) 22Rv1 cells were treated with increasing concentrations of Pifithrin-α for 16 hrs before lysis. Protein expression was analyzed by western blot. In all experiments, membranes were reprobed with antibodies against β-actin as a loading control.
To determine whether p53 causes Egr-1 overexpression in these cells, we used RNA interference or Pifithrin-α, an inhibitor of p53 transcriptional activity (Komarov et al., 1999). Silencing of p53 using a commercial siRNA-p53 (Dharmacon) decreased Egr-1 expression in DU145 cells, indicating that p53 indeed regulates Egr-1 expression (figure 1B).
In addition, Pifithrin-α suppressed Egr-1 in M12 and DU145 (figure 1C), both of which contain high levels of p53. Pifithrin-α also decreased the expression of Egr-1 mRNA (Supplement figure S4), indicating that it is the transcription of Egr-1 that is affected. In contrast, the inhibitor did not decrease Egr-1 expression in 22Rv1 cells that contain wt-p53 (figure 1D).
Interestingly, similar results were obtained using mouse fibroblasts (supplement figure S5). In late passage mouse embryo fibroblasts that contain a mutant p53, Egr-1 expression was inhibited by pifithrin-α, whereas it was not altered in NIH-3T3 (wt-p53). These results suggest that it is the altered p53 activity that drives Egr-1 transcription in cells containing a TP53 mutation or SV40-TAg. To test this hypothesis, we studied the effect of increasing wild-type p53 in 22Rv1 cells. These experiments used nutlin, an antagonist of Mdm2-p53 interaction that prevents the degradation of p53 (Vassilev et al., 2004).
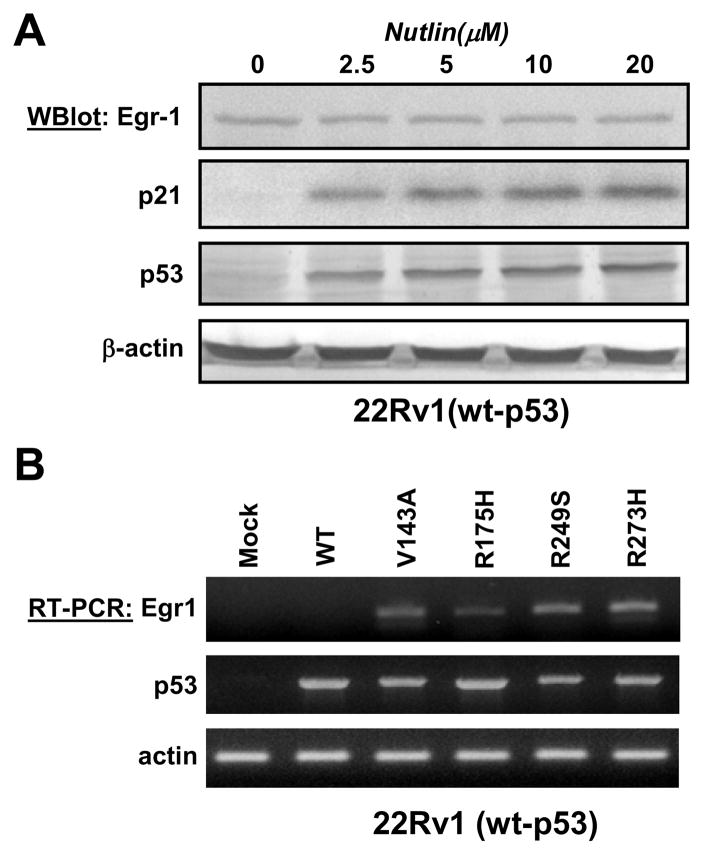
As shown in Figure 2A, nutlin increased the level of p53 in 22Rv1(wt-p53), but did not induce Egr-1 expression. A concomitant increase in the expression of p21CIP, a well known target of p53, serves as a positive control and indicates that even at low doses nutlin actually increased p53 activity. These results support the notion that increasing the activity of wt-p53 is not sufficient to promote the transcription of Egr-1.
Figure 2. Mutant p53 induces Egr-1 expression.
(Panel A) 22Rv1 cells were treated with the indicated concentrations of Nutlin for 15 hrs before lysis. Protein expression was analyzed by western blot. (Panel B) 22Rv1 cells were mock-transfected or transfected with wild-type p53 (wt) or the indicated mutants of p53. After 72 hours, total RNA was purified and semi-quantitative RT-PCR was performed as described in Methods.
In contrast, the transfection of four different mutants of p53 (V143S, R175H, R249S, R273H, described in (Baker et al., 1990)) increased Egr-1 expression in 22Rv1 cells, whereas transfection of wt-p53 did not.
It can be noted that p53-null PC3 cells were not used in these experiments. Indeed, we observed that PC3 are, in fact, quite “resistant” to Egr-1 induction (shown in supplement figures S6–S8), possibly because of a defect in the ERK1/2 pathway (figure S8). This may be due to the fact that these cells do not express PTEN (because of a genetic deletion) and have high constitutive PI3-kinase activity. Aberrant PI3-kinase activation has been shown to impair Egr-1 induction in fibroblasts through accelerated degradation of serum response factor (SRF) (Shin et al., 2006). It is therefore possible that the constitutive activation of PI3-kinase in PC3 cells prevents Egr-1 induction.
We conclude from figures 1 and 2 that Egr-1 overexpression in prostate cells is linked to an alteration of p53 activity due to genetic mutation or, in immortalized cells, to its interaction with viral protein SV40-TAg.
Egr-1 transcription is mediated by constitutively activated EGFR/ERK pathway
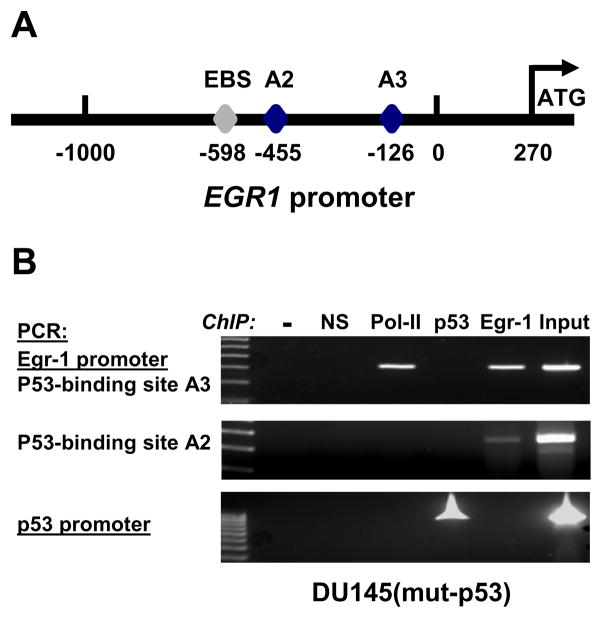
Chromatin immunoprecipitation (ChIP) was performed using a ChIP-validated p53 antibody to test a possible direct binding of p53 to the EGR1 promoter in DU145 cells. Two distinct regions of the EGR1 promoter were studied, both of which contain known functional p53 binding sites termed A2 and A3 (Yu et al., 2007), as illustrated on the diagram of the EGR1 promoter shown in figure 3A. As shown in figure 3B, no binding of p53 on the EGR1 promoter could be detected in DU145 cells. However, binding of p53 onto its own promoter was observed and serves as a positive control for p53 DNA binding activity. The regulation of its own transcription by p53 has been described previously (Deffie et al., 1993). Binding of Polymerase II was detected using primers surrounding the p53 binding site A3, which is close to the 5′-UTR. We interpret this observation as an indication that the gene is active and transcription is taking place, which is consistent with the notion that Egr-1 overexpression is due to steady transcription. Notably, the EGR1 promoter contains a well characterized Egr-1 binding site (EBS) at position -598 (Cao et al., 1993) and binding of Egr-1 on its own promoter was indeed observed (figure 3B). Of note, the Egr-1-bound DNA was amplified using both A2 and A3 primers, which are close enough to the EBS to be contained in our precipitated DNA fragments (1000 bp average size).
Figure 3. Mutant p53 does not bind to the EGR1 promoter in DU145.
(Panel A) Structure of the EGR1 promoter. The position of the Egr-1 binding site (EBS) in the EGR1 promoter in indicated at position -598. A2 and A3 are functional p53 binding sites (Yu et al., 2007). (Panel B) ChIP assay: DU145 cells were fixed with para-formaldehyde and ChIP was performed as described in Methods. Buffer only (−) and non-specific IgG (NS) were used as negative controls. Antibodies against Polymerase II, p53 and Egr-1 were used to capture the protein-DNA complexes. Genomic DNA was used as input. Two regions of the EGR1 promoter containing p53 binding sites, and one region of the TP53 promoter, were amplified by PCR and analyzed by electrophoresis on agarose gels.
Because binding of p53 to the EGR1 promoter could not be detected, the involvement of other signaling pathways was explored. DU145 cells exhibit constitutive activation of the EGFR (Connolly and Rose, 1991), which was confirmed by measuring the phosphorylation of EGFR in unstimulated cells. In these experiments, immunoprecipitation of the EGFR was followed by western-blot using anti-phosphotyrosine antibodies.
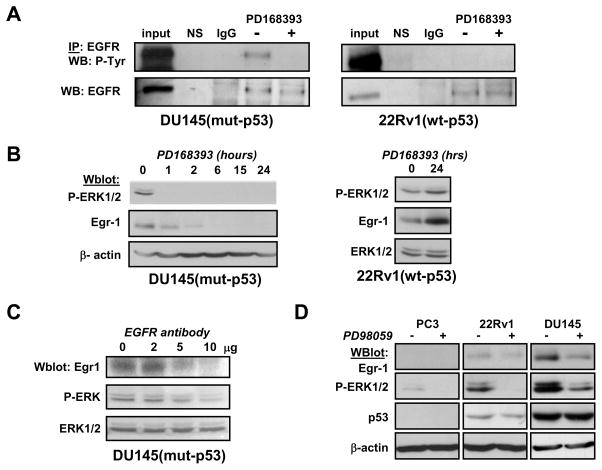
As shown in figure 4A, the EGFR was constitutively phosphorylated in DU145 but not in 22Rv1. A time-course of EGFR inhibitor PD168393 in DU145 rapidly reduced ERK1/2 phosphorylation and decreased Egr-1 expression, whereas it failed to do so in 22Rv1 (figure 4B).
Figure 4. Constitutive activation of EGFR and ERK1/2 regulates Egr-1 expression.
(Panel A) DU145 and 22Rv1 cells were treated with PD168393 (2 μM) for 2 hrs. Cells were lysed and subjected to immunoprecipitation using anti-EGFR antibodies. Buffer alone (NS) or non-specific immunoglobulins (IgG) were negative controls. Whole cell lysates were loaded for positive control (input). (Panel B) DU145 (left) were treated with EGFR inhibitor PD168393 at 2 μM for the indicated times. 22Rv1 (right) were treated with PD168393 at 2 μM for 24 hrs.
(Panel C) DU145 were incubated with increasing amounts of neutralizing anti-EGFR antibodies for 24 hours before lysis. (Panel D) Cells were treated with MEK inhibitor PD98059 for 2 hrs before lysis. All experiments were analyzed by western blot using the indicated antibodies. Actin or pan-ERK1 antibodies were used for loading controls. P-ERK: anti-phospho-ERK1/2; P-Tyr: anti-phospho-tyrosine.
Upon inhibition of MEK by PD98059, dephosphorylation of ERK by specific phosphatases occurs very rapidly (within minutes). In contrast, the decrease in the level of Egr-1 protein is caused by the concomitant inhibition of ERK-dependent transcription and the degradation of Egr-1. Since dephosphorylation happens much faster than protein degradation, the loss of phospho-ERK is seen much sooner than the loss of Egr-1.
Similar results were obtained when DU145 cells were incubated with neutralizing anti-EGFR antibodies (figure 4C).
Because EGFR stimulates the ERK1/2 pathway, one of the major regulators of Egr-1 expression, the involvement of ERK-1/2 was examined using MEK inhibitor PD98059.
Treatment of DU145 with PD98059 resulted in the inhibition of ERK-1/2 phosphorylation and of Egr-1 expression (figure 4D). Egr-1 protein level was not altered by PD98059 in 22Rv1, whereas Egr-1 was not detected in PC3. It can be noted that in PC3 cells, the phosphorylation of ERK1/2 is very weak whereas it was the highest in DU145.
We observed that Egr-1 half-life is about 30 min, as measured by incubation with the inhibitor of protein synthesis cyclohexamide (Supplement figure S9). Abrogation of Egr-1 expression upon treatment with PD98059 followed a similar time-course compared to cyclohexamide.
As a whole, these results strongly support the idea that although the turnover of Egr-1 is fast, steady transcription induced by the constitutive activation of the EGFR/ERK1/2 pathway maintains relatively high levels of protein expression.
Prostate cancer cells secrete EGFR ligands
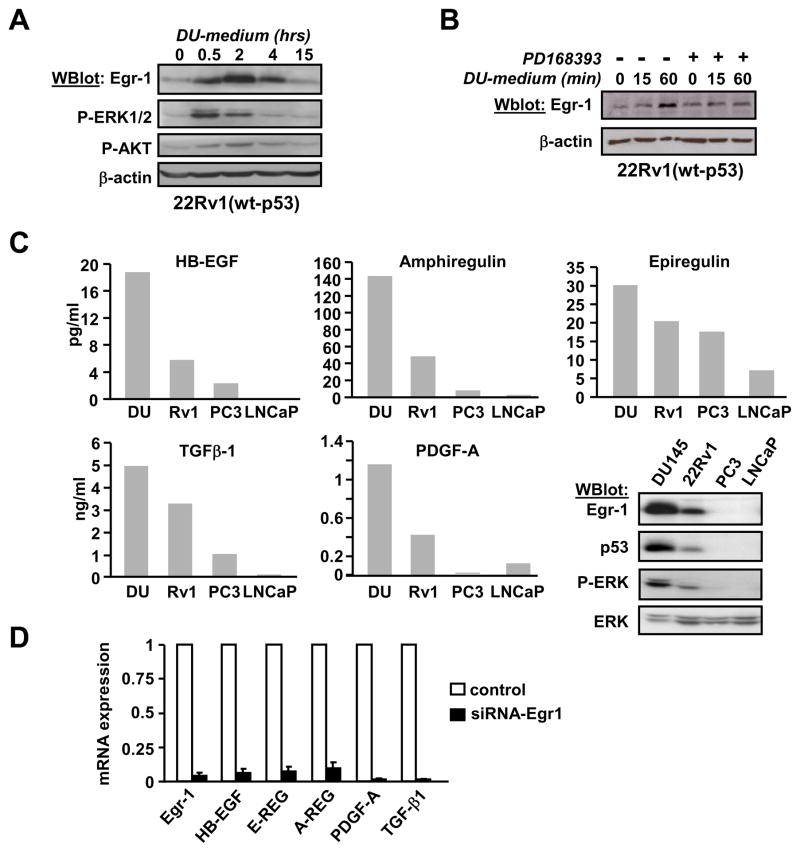
The presence of autocrine growth factors in the medium of DU145 was assessed by adding the conditioned medium from DU145 onto 22Rv1 cells. Figure 5A shows that DU145-conditioned medium stimulated the phosphorylation of ERK-1/2 and AKT in 22Rv1, and increased the expression of Egr-1. Egr-1 induction was inhibited by prior incubation of 22Rv1 with EGFR inhibitor PD168393 (figure 5B), indicating that growth factors secreted by DU145 stimulate the EGFR and most likely are EGFR ligands.
Figure 5. Secretion of cytokines in prostate cancer cells.
(Panel A) DU145 cells were maintained in serum-free medium for three days. The conditioned medium was collected and added to 22Rv1 cells that had been maintained in serum-free medium for 24 hrs. After the indicated times, 22Rv1 cells were lysed and protein expression and phosphorylation was analyzed by western blot. P-Akt: anti-phospho-Akt. (Panel B) The experiment was performed as in panel A except that EGFR inhibitor PD168393 (1μM) was added 2 hours prior to the conditioned medium. (Panel C) Cells were plated at a controlled density and cultured in serum-free medium for three days. The absolute quantity of various cytokines from the conditioned medium of each cell line was measured by multiplex protein array. The western blot shown as insert compares Egr-1, p53 and phospho-ERK1/2 levels in these four cells lines. (Panel D) Cells were treated with siRNA-Egr1 for 48 hrs before RNA purification. Levels of mRNA were measured by quantitative real-time RT-PCR.
Thus, the conditioned media from DU145, 22Rv1, PC3 and LNCaP were analyzed in a multiplex protein assay (SearchLight custom assays, Pierce). We looked at ligands of the EGFR and a few other cytokines, including TGF-β1 (transforming growth factor-β 1) a known target of Egr-1. Results are shown in Supplement Table T1 and in Figure 5C. EGF (Epidermal Growth Factor) was not detected in the conditioned medium from any of the cell lines. Three other EGFR ligands (Epiregulin, HB-EGF and Amphiregulin) seemed to correlate with Egr-1 expression, since they were the highest in DU145 and the lowest in PC3 and LNCaP (see the western blot analysis of Egr-1, p53 and phospho-ERK in these cell lines, figure 5C).
The secretion of PDGF-A (Platelet-Derived Growth Factor) and TGF-β1 correlated with Egr-1 expression as well. Since both are known targets of Egr-1, it is likely that their expression is because of the high Egr-1 activity in DU145 cells. Thus, we examined the effect of Egr-1 silencing on the mRNA expression of these cytokines. As shown in figure 5D, the siRNA-Egr-1 effectively blocked the expression of Egr-1. It also decreased the amount of mRNA corresponding to the three EGFR ligands Amphiregulin, Epiregulin and HB-EGF, as well as PDGF-A and TGF-β1, indicating that Egr-1 controls the transcription of these cytokines in DU145.
Overall, these results suggest that overexpression of Egr-1 results in an increased transcription and secretion of EGFR ligands, therefore initiating a positive feedback loop that leads to autocrine activation of the EGFR and MEK/ERK1/2.
Mutant p53 initiates Egr-1 increase through activation of MEK, but not of EGFR
The question that arises, therefore, is which step of the EGFR/ERK pathway is engaged by mutant p53 to control Egr-1 expression? In DU145 cells that contain mutant p53, the feedback loop is well established and makes it difficult to pinpoint the signaling step that is initially affected. Therefore, mutant p53 was transfected in 22Rv1 cells in the presence of various inhibitors of the EGFR/ERK pathway.
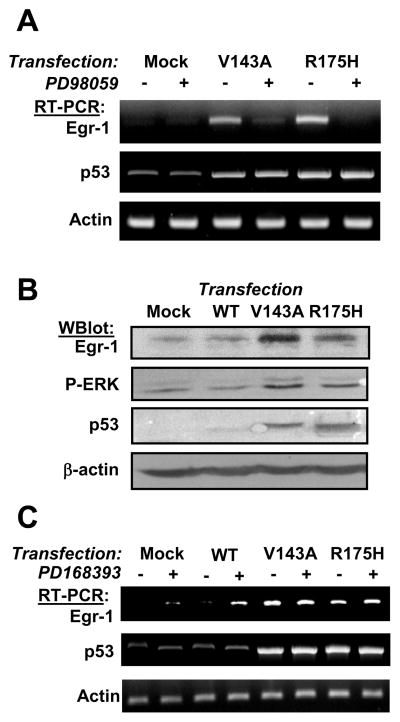
As shown in figure 6A, forced expression of mutant p53 in 22Rv1 increased the transcription of Egr-1, and this was blocked by MEK inhibitor PD98059. We also observed that mutant p53 increased the phosphorylation of ERK1/2 (figure 6B). Thus, the MEK/ERK1/2 cascade mediates the effect of p53 on Egr-1. On the other hand, EGFR inhibitor PD168393 had no effect on p53-induced Egr-1 (figure 6C). A similar lack of effect was noted following the treatment of p53-transfected cells with neutralizing anti-EGFR antibodies or with neutralizing anti-HB-EGF antibodies (data not shown). These results indicate that the direct effect of mutant p53 is at the level of MEK or immediately upstream, but not through EGFR.
Figure 6. Egr-1 transcription induced by mutant p53 is mediated by MEK/ERK signaling.
(panel A) 22Rv1cells were mock-transfected or transfected with p53-V143A or p53-R175H. 72 hours later, cells were incubated with PD98059 for 4 hours. Total RNA was purified and mRNA levels were analyzed by RT-PCR. (panel B) 22Rv1cells were mock-transfected or transfected with wt-p53, p53-V143A or p53-R175H. 72 hours later, cells were lysed and analyzed by western blot. (panel C) The experiment was performed as in panel A except that EGFR inhibitor was added for 24 hours before RNA purification.
Thus, the establishment of a positive feedback loop and the constitutive activation of EGFR (as observed in DU145) appears to be the long term result of Egr-1 transcription by mutant p53.
Regulation of EGFR expression
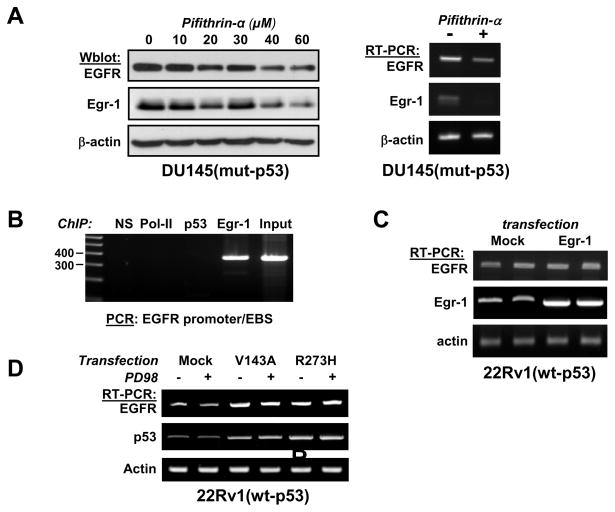
Both mutant-p53 and wt-p53 bind to the promoter of EGFR and directly regulate its transcription (Deb et al., 1994; Ludes-Meyers et al., 1996). Therefore, we looked at the effect of p53 inhibitor Pifithrin-α on EGFR expression. Pifithrin-α caused a decrease of both the protein and mRNA levels of EGFR in DU145, as shown in figure 7A. However, it has been shown previously that Egr-1 activates the transcription of EGFR in response to hypoxia in osteosarcoma cells (Nishi et al., 2002). Since inhibition of p53 also decreases Egr-1 expression, we tested the possibility that Egr-1 mediates the effect of p53 on the transcription of EGFR.
Figure 7. p53 regulates the expression of EGFR.
(Panel A, left) DU145 cells were treated with Pifithrin-α at the indicated concentrations for 16 hrs before cell lysis. Results were analyzed by western blot using the indicated antibodies. (Panel A, right) Cells were treated with pifithrin-α (50 μM) for 24 hours. RNA was purified and analyzed by RT-PCR followed by agarose gel electrophoresis. (Panel B) ChIP assay: DU145 were grown under normal conditions before being fixed with para-formaldehyde and submitted to ChIP. Non-specific IgG (NS) were used as a negative control. Antibodies against Polymerase II, p53 and Egr-1 were used to capture the protein-DNA complexes. Genomic DNA was used as input. The EGFR promoter was amplified by PCR and analyzed by agarose electrophoresis. (Panel C) Cells were transfected with expression plasmid pCMV-Egr1 or with the transfection reagent alone (Mock). RNA was purified 72 hrs later and analyzed by RT-PCR. Duplicates are shown. (Panel D) The experiment was performed as described in figure 6A. Controls showing p53 and actin mRNA are the same as in figure 6A.
Although we observed that Egr-1 directly binds to the promoter of EGFR in a ChIP assay (Figure 7B), we did not observe a consistent effect on EGFR mRNA level upon forced expression of Egr-1 (figure 7C) or upon silencing (data not shown), indicating that Egr-1 does not appreciably interfere with EGFR transcription in these cells. In addition, MEK inhibitor PD98059, which blocked Egr-1 induction by mutant p53, had no effect on EGFR mRNA level (Figure 7D), validating the conclusion that the effect of mutant p53 on EGFR transcription is not mediated by Egr-1.
The control of EGFR expression provides an additional mechanism for the regulation of the EGFR/Egr-1 feedback loop by mutant p53, which may act as a rheostat. Indeed, inhibition of p53, which decreases EGFR transcription, would be expected to attenuate the signaling loop. Conversely, increases in the mutant p53 protein would intensify this signaling loop and potentially accelerate cell growth.
DISCUSSION
The present study uncovers a new mechanism in which mutation of p53 promotes prostate cancer progression through upregulation of transcription factor Egr-1, leading to autocrine activation of the EGFR as well as increased secretion of cancer-promoting cytokines such as TGF-β and PDGF. Supporting a role for Egr-1 in prostate cancer is its higher expression in prostate adenocarcinoma compared to normal tissues (Eid et al., 1998; Thigpen et al., 1996). To understand the molecular mechanism leading to Egr-1 up-regulation in prostate cancer, we used a collection of transformed, immortalized or primary prostate cell lines. Results from figure 1A argue against a cancer-specific overexpression of Egr-1 in cultured cells. In fact, two of the four human tumor cell lines had very low levels of Egr-1 (namely PC-3 and LNCaP). However, an association between Egr-1 and p53 expression was observed since inhibition of p53 resulted in Egr-1 downregulation. No binding of p53 with the EGR1 promoter was detected in DU145, invalidating the hypothesis of a direct regulation of Egr-1 transcription by p53. DU145 cells contain p53 mutant (Isaacs et al., 1991), and our result is at odds with the previous finding that the gain-of-function mutant p53R175H binds to the EGR1 promoter (Weisz et al., 2004). Obviously, the difference between these results may stem from the nature of the p53 mutations. The mutant p53R175H is structurally defective, a protein in which the mutation induces a significant conformational change and displays gain-of-function activity. DU145 cells exhibit two mutations in the DNA binding domain of p53, one on each allele of TP53, leading to the co-expression of p53V274F and p53P223L (Isaacs et al., 1991). The cooperation between the co-expressed mutants leads to an altered p53 activity and a proliferative phenotype (Gurova et al., 2003). Thus, mut-p53 in DU145 cells may not bind to the same DNA elements as p53R175H.
Other cell lines in which Egr-1 was overexpressed exhibit high p53 protein expression owing to its stabilization by SV40-TAg used for immortalization. It is interesting to note, in this context, that Egr-1 overexpression was observed in CR2-TAg mice that also express SV40-TAg (Abdulkadir et al., 2001), suggesting that this mechanism bears in vivo significance.
SV40-TAg is thought to suppress the transcription factor activity of p53. The crystal structure of SV40-TAg in complex with the DNA-binding domain of wt-p53 indicates that SV40-TAg occupies a large portion of the DNA binding domain and most likely prevents the tetramerisation of p53 (Lilyestrom et al., 2006). On the other hand, although controversial, two works have shown that p53 complexed with SV40-TAg may still bind to DNA and regulate gene transcription (Bocchetta et al., 2008; Long et al., 1995).
The lack of evidence for a direct binding of p53 onto EGR1 promoter, together with the observation that Egr-1 expression could be completely abolished by inhibitors of the EGFR/ERK pathway argues in favor of an indirect regulation.
Overall our results indicate that the MEK/ERK pathway mediates the activation of Egr-1 transcription by mutant p53. Cross-talk signals between p53 and the ERK cascade have been documented and can involve various mechanisms (reviewed in (Wu, 2004)). Since stimulation of ERK1/2 is sufficient to increase Egr-1 transcription, it is reasonable to postulate that activation of this pathway by mutant p53 is the initiating event toward the establishment of the EGFR/Egr-1 feedback loop.
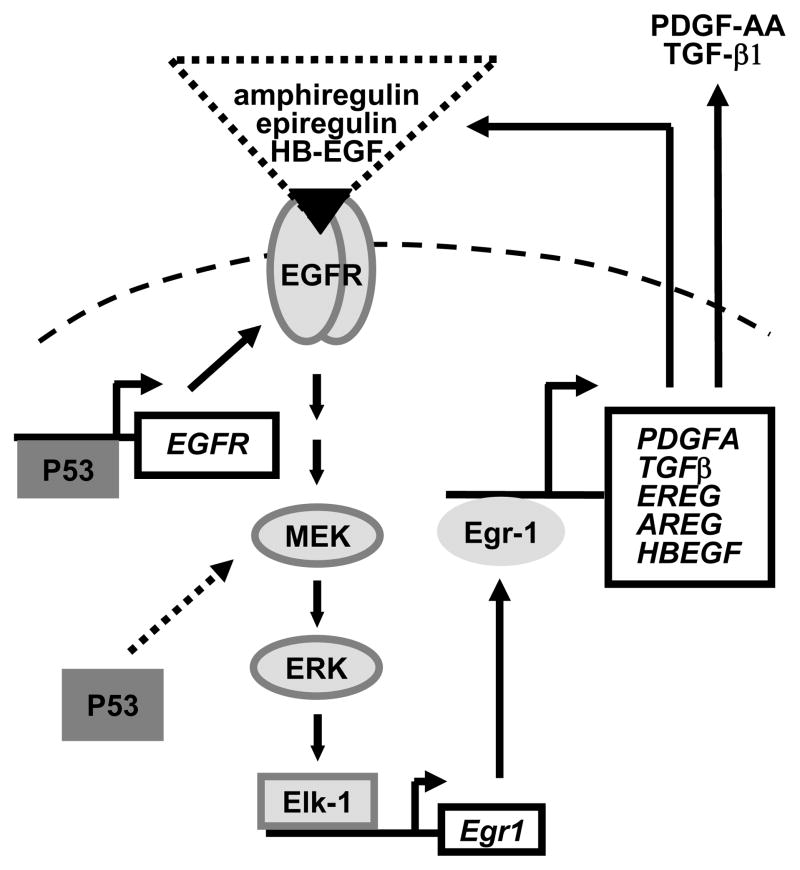
Egr-1, in turn, induces the transcription and increases the secretion of EGFR ligands, resulting in autocrine activation of the receptor. We propose a model, shown in Figure 8, which illustrates this positive feedback mechanism. Notably, this loop did not exist in cells containing wt-p53, which exhibited low levels of Egr-1.
Figure 8. Proposed model of a positive feedback loop regulated by p53.
The dashed arrow represents the apparent initiating event.
Protein p53 regulates this feedback loop at least in part through the control of EGFR transcription. Indeed, inhibition of p53 in DU145 resulted in decreased EGFR level, and it has been shown previously that both wt-p53 and mutant-p53 can bind to and regulate the transcription of the EGFR promoter (Deb et al., 1994; Ludes-Meyers et al., 1996).
A microarray study performed on LAPC4 cells in which Egr-1 was artificially overexpressed showed increased production of IGF-II (Insulin Like Growth Factor), PDGF-A and TGF-β1 (Svaren et al., 2000). High levels of Egr-1-dependent PDGF-A and TGF-β1 were also found in DU145 that naturally overexpress Egr-1. Although DU145 cells secreted large amounts of PDGF-A, this did not affect their growth. Indeed, an inhibitor of the PDGF-R had no effect on cell growth, and did not alter the phosphorylation of ERK or AKT (Supplement Figure S10). PGDF-A however promotes angiogenesis and alters the tumor environment. On the other hand, TGF-β1 is a well characterized target of Egr-1 and is regulated by Egr-1 in two other prostate cancer cells (Svaren et al., 2000; Virolle et al., 2003). The cytokine contributes to epithelial cancer progression by promoting immune suppression, angiogenesis, alteration of the micro-environment, and metastasis (Biswas et al., 2006; Teicher, 2007; Wrzesinski et al., 2007).
We conclude that overexpression of Egr-1 participates in prostate cancer progression through autocrine activation of the EGFR and through the transcription of cancer-promoting cytokines such as TGF-β1 and PGDF-A. Overexpression of Egr-1 is caused by mutation of p53 and appears to be initiated through activation of the MEK/ERK1/2 signaling cascade by mutant p53.
Supplementary Material
Acknowledgments
Many thanks to Dr. Ruth Gjerset (Torrey Pines Institute for Molecular Studies, San Diego, CA) for comments and critical reading of the manuscript. We are grateful to Dr. Eileen Adamson and Dr. Dan Mercola (University of California, Irvine) for their support and many suggestions. This work was supported by a grant from NIH/NCI-RO1 CA102688 (V. Baron).
Footnotes
The authors declare no conflict of interest.
Supplementary information is available at Oncogene’s website.
BIBLIOGRAPHY
- Abdulkadir SA, Qu Z, Garabedian E, Song SK, Peters TJ, Svaren J, et al. Impaired prostate tumorigenesis in Egr1-deficient mice. Nat Med. 2001;7:101–7. doi: 10.1038/83231. [DOI] [PubMed] [Google Scholar]
- Baker SJ, Markowitz S, Fearon ER, Willson JK, Vogelstein B. Suppression of human colorectal carcinoma cell growth by wild-type p53. Science. 1990;249:912–5. doi: 10.1126/science.2144057. [DOI] [PubMed] [Google Scholar]
- Baron V, De Gregorio G, Krones-Herzig A, Virolle T, Calogero A, Urcis R, et al. Inhibition of Egr-1 expression reverses transformation of prostate cancer cells in vitro and in vivo. Oncogene. 2003;22:4194–204. doi: 10.1038/sj.onc.1206560. [DOI] [PubMed] [Google Scholar]
- Biswas S, Criswell TL, Wang SE, Arteaga CL. Inhibition of transforming growth factor-beta signaling in human cancer: targeting a tumor suppressor network as a therapeutic strategy. Clin Cancer Res. 2006;12:4142–6. doi: 10.1158/1078-0432.CCR-06-0952. [DOI] [PubMed] [Google Scholar]
- Bocchetta M, Eliasz S, De Marco MA, Rudzinski J, Zhang L, Carbone M. The SV40 large T antigen-p53 complexes bind and activate the insulin-like growth factor-I promoter stimulating cell growth. Cancer Res. 2008;68:1022–9. doi: 10.1158/0008-5472.CAN-07-5203. [DOI] [PubMed] [Google Scholar]
- Cao X, Mahendran R, Guy GR, Tan YH. Detection and characterization of cellular EGR-1 binding to its recognition site. J Biol Chem. 1993;268:16949–57. [PubMed] [Google Scholar]
- Connolly JM, Rose DP. Autocrine regulation of DU145 human prostate cancer cell growth by epidermal growth factor-related polypeptides. Prostate. 1991;19:173–80. doi: 10.1002/pros.2990190210. [DOI] [PubMed] [Google Scholar]
- Deb SP, Munoz RM, Brown DR, Subler MA, Deb S. Wild-type human p53 activates the human epidermal growth factor receptor promoter. Oncogene. 1994;9:1341–9. [PubMed] [Google Scholar]
- Deffie A, Wu H, Reinke V, Lozano G. The tumor suppressor p53 regulates its own transcription. Mol Cell Biol. 1993;13:3415–23. doi: 10.1128/mcb.13.6.3415. [DOI] [PMC free article] [PubMed] [Google Scholar]
- Eid MA, Kumar MV, Iczkowski KA, Bostwick DG, Tindall DJ. Expression of early growth response genes in human prostate cancer. Cancer Res. 1998;58:2461–8. [PubMed] [Google Scholar]
- Gitenay D, Baron VT. Is EGR1 a potential target for prostate cancer therapy? Future Oncol. 2009;5:993–1003. doi: 10.2217/fon.09.67. [DOI] [PMC free article] [PubMed] [Google Scholar]
- Gurova KV, Rokhlin OW, Budanov AV, Burdelya LG, Chumakov PM, Cohen MB, et al. Cooperation of two mutant p53 alleles contributes to Fas resistance of prostate carcinoma cells. Cancer Res. 2003;63:2905–12. [PubMed] [Google Scholar]
- Isaacs WB, Carter BS, Ewing CM. Wild-type p53 suppresses growth of human prostate cancer cells containing mutant p53 alleles. Cancer Res. 1991;51:4716–20. [PubMed] [Google Scholar]
- Jemal A, Siegel R, Ward E, Murray T, Xu J, Thun MJ. Cancer statistics. CA Cancer J Clin. 2007;57:43–66. doi: 10.3322/canjclin.57.1.43. [DOI] [PubMed] [Google Scholar]
- Komarov PG, Komarova EA, Kondratov RV, Christov-Tselkov K, Coon JS, Chernov MV, et al. A chemical inhibitor of p53 that protects mice from the side effects of cancer therapy. Science. 1999;285:1733–7. doi: 10.1126/science.285.5434.1733. [DOI] [PubMed] [Google Scholar]
- Lilyestrom W, Klein MG, Zhang R, Joachimiak A, Chen XS. Crystal structure of SV40 large T-antigen bound to p53: interplay between a viral oncoprotein and a cellular tumor suppressor. Genes Dev. 2006;20:2373–82. doi: 10.1101/gad.1456306. [DOI] [PMC free article] [PubMed] [Google Scholar]
- Long SB, Ho HY, Chen CL, Lai MD. Complex of simian virus large T antigen and p53 can bind DNA specifically. Anticancer Res. 1995;15:1375–80. [PubMed] [Google Scholar]
- Ludes-Meyers JH, Subler MA, Shivakumar CV, Munoz RM, Jiang P, Bigger JE, et al. Transcriptional activation of the human epidermal growth factor receptor promoter by human p53. Mol Cell Biol. 1996;16:6009–19. doi: 10.1128/mcb.16.11.6009. [DOI] [PMC free article] [PubMed] [Google Scholar]
- Nishi H, Nishi KH, Johnson AC. Early Growth Response-1 gene mediates up-regulation of epidermal growth factor receptor expression during hypoxia. Cancer Res. 2002;62:827–34. [PubMed] [Google Scholar]
- Shin SY, Bahk YY, Ko J, Chung IY, Lee YS, Downward J, et al. Suppression of Egr-1 transcription through targeting of the serum response factor by oncogenic H-Ras. Embo J. 2006;25:1093–103. doi: 10.1038/sj.emboj.7600987. [DOI] [PMC free article] [PubMed] [Google Scholar]
- Silverman ES, Collins T. Pathways of Egr-1-mediated gene transcription in vascular biology. Am J Pathol. 1999;154:665–70. doi: 10.1016/S0002-9440(10)65312-6. [DOI] [PMC free article] [PubMed] [Google Scholar]
- Svaren J, Ehrig T, Abdulkadir SA, Ehrengruber MU, Watson MA, Milbrandt J. EGR1 target genes in prostate carcinoma cells identified by microarray analysis. J Biol Chem. 2000;275:38524–31. doi: 10.1074/jbc.M005220200. [DOI] [PubMed] [Google Scholar]
- Teicher BA. Transforming growth factor-beta and the immune response to malignant disease. Clin Cancer Res. 2007;13:6247–51. doi: 10.1158/1078-0432.CCR-07-1654. [DOI] [PubMed] [Google Scholar]
- Thiel G, Cibelli G. Regulation of life and death by the zinc finger transcription factor Egr-1. J Cell Physiol. 2002;193:287–92. doi: 10.1002/jcp.10178. [DOI] [PubMed] [Google Scholar]
- Thigpen AE, Cala KM, Guileyardo JM, Molberg KH, McConnell JD, Russell DW. Increased expression of early growth response-1 messenger ribonucleic acid in prostatic adenocarcinoma. J Urol. 1996;155:975–81. [PubMed] [Google Scholar]
- Vassilev LT, Vu BT, Graves B, Carvajal D, Podlaski F, Filipovic Z, et al. In vivo activation of the p53 pathway by small-molecule antagonists of MDM2. Science. 2004;303:844–8. doi: 10.1126/science.1092472. [DOI] [PubMed] [Google Scholar]
- Virolle T, Krones-Herzig A, Baron V, De Gregorio G, Adamson ED, Mercola D. Egr1 promotes growth and survival of prostate cancer cells. Identification of novel Egr1 target genes. J Biol Chem. 2003;278:11802–10. doi: 10.1074/jbc.M210279200. [DOI] [PubMed] [Google Scholar]
- Weisz L, Zalcenstein A, Stambolsky P, Cohen Y, Goldfinger N, Oren M, et al. Transactivation of the EGR1 gene contributes to mutant p53 gain of function. Cancer Res. 2004;64:8318–27. doi: 10.1158/0008-5472.CAN-04-1145. [DOI] [PubMed] [Google Scholar]
- Wrzesinski SH, Wan YY, Flavell RA. Transforming growth factor-beta and the immune response: implications for anticancer therapy. Clin Cancer Res. 2007;13:5262–70. doi: 10.1158/1078-0432.CCR-07-1157. [DOI] [PubMed] [Google Scholar]
- Wu GS. The functional interactions between the p53 and MAPK signaling pathways. Cancer Biol Ther. 2004;3:156–61. doi: 10.4161/cbt.3.2.614. [DOI] [PubMed] [Google Scholar]
- Yang SZ, Abdulkadir SA. Early growth response gene 1 modulates androgen receptor signaling in prostate carcinoma cells. J Biol Chem. 2003;278:39906–11. doi: 10.1074/jbc.M307250200. [DOI] [PubMed] [Google Scholar]
- Yu J, Baron V, Mercola D, Mustelin T, Adamson ED. A network of p73, p53 and Egr1 is required for efficient apoptosis in tumor cells. Cell Death Differ. 2007;14:436–46. doi: 10.1038/sj.cdd.4402029. [DOI] [PubMed] [Google Scholar]
Associated Data
This section collects any data citations, data availability statements, or supplementary materials included in this article.


