

Abstract
Chromophore Assisted Laser Inactivation (CALI) is a technique that uses irradiation of chromophores proximate to a target protein to inactivate function. Previously, EGFP mediated CALI has been used to inactivate EGFP-fusion proteins in a spatio-temporally defined manner within cells but the mechanism of inactivation is unknown 1, 2. To help elucidate the mechanism of protein inactivation mediated by fluorescent protein CALI ([FP]-CALI), the activities of purified Glutathione-S-transferase-FP (GST-EXFP) fusions were measured after laser irradiation in vitro. Singlet oxygen and free radical quenchers as well as the removal of oxygen inhibited CALI, indicating the involvement of a reactive oxygen species (ROS). At higher concentrations of protein, turbidity after CALI increased significantly indicating cross-linking of proximate fusion proteins suggesting that damage of residues on the surface the protein, distant from the active site, results in inactivation. Control experiments removed sample heating as a possible cause of these effects. Different FP mutants fused to GST vary in their CALI efficiency in the order EGFP>EYFP>ECFP, while a GST construct that binds FlAsH results in significantly higher CALI efficiency than any of the XFPs tested. It is likely that the hierarchy of XFP effectiveness reflects the balance between ROS that are trapped within the XFP structure and cause fluorophore and chromophore bleaching and those that escape to effect CALI of proximate proteins.
Introduction
CALI (Chromophore Assisted Laser Inactivation) is a technique that uses irradiation of chromophores proximate to a target molecule to inactivate functions of that molecule. Since the inactivating light can be limited to small regions within a single cell and the inactivation can be accomplished in less than 1 s, the technique offers an important spatially and temporally controlled loss-of-function tool in cell and developmental biology that complements genetic and other loss-of-function methods 3. CALI was introduced for cell biological purposes using the dye malachite green as a chromophore by Jay and co-workers 4-6. More recently, the technique has been extended to fluorophores including EGFP (enhanced green fluorescent protein) 1, FlAsH (Fluorescein-based Arsenical Hairpin binder)7, ReAsH (Resorufin-based Arsenical Hairpin binder)8, and SLF' (synthetic ligand for mutant FKBP12 that is conjugated to fluorescein)9, all of which produced successful loss of function of the labeled targets. Work employing EGFP as a CALI reagent was based on earlier work 10 which showed, in vitro, that GFP could be used as a CALI fluorophore. GFP is not nearly as effective as fluorescein or malachite green 10 in producing damaging radicals but, if the fluorescent fusion protein faithfully represents the native protein, then the localization of the CALI effect is ensured. The fact that interesting phenotypes have been obtained by CALI raises the issue of photochemical mechanism.
In this study, we investigated the mechanism of EGFP-CALI, how the proximity of the fluorophore to the target affected CALI, how different, commonly used XFPs compared in CALI efficiency, and how these XFPs compared in effectiveness to CALI employing FlAsH. Our studies were done in vitro using various GST-XFP fusion proteins.
Materials and Methods
Creation of GST-EXFP fusion proteins
The expression plasmids for the GST fusion proteins were derived from the parent vector pGEX4T3 (GE Healthcare). pGEX-4T3 and pEXFP vectors were digested with the restriction enzymes Xho I and Not I (New England Biolabs). The XmaI - Not I restriction fragment of pEXFP (Clontech) containing the fluorescent protein gene was ligated into into Xma I – Not I digested pGEX4T3 using T4 Ligase (Invitrogen). The resulting GST-EXFP fusion proteins contain the poly peptide linker LVPRGSPNSRVPVAT harboring a thrombin cleavage site. Single pass primer extension DNA sequencing was performed by ACGT inc. using the GEX 5′ and GEX 3′ sequencing primers.
Creation of GST – Tetracysteine fusion protein
Iproof High-Fidelity DNA polymerase (Biorad) was used for all PCR reactions. The GST-tetra cysteine fusion (GST-TC) was created through PCR amplification of the 3′ portion of the GST gene between the BstBI and NotI restriction sites in pGEX-4T3. The 3 ′ mutagenic primer replaced Aspartate 232 and Serine 233 with the tetra cysteine motif CysCysProGlyCysCys. The PCR product and the vector pGEX4T3 were sequentially digested with BstBI and Not I. The restriction digest products were purified by agarose gel electrophoresis, ligated, and transformed into E.coli XL 10 (Stratagene). Subsequent clones were screened by the absence of an XhoI restriction site that is removed upon mutagenesis. Clones without an Xho I restriction sites were sequenced (ACGT inc).
Expression of GST-Fusion Proteins
Tryptone and yeast extract were purchased from Fisher Scientific. Plasmids harboring the GST fusion proteins were transformed into E. coli BL21 (Stratagene). Starter cultures of 50 ml LB media (10 g Tryptone, 5 g Yeast Extract and 10 g NaCl / l) containing 100 mg/l ampicillin were inoculated from single bacterial colony and incubated at 37 C and shaking at 250 RPM until the optical density at 600 nm reached 0.4 to 0.6. 10 ml of the starter culture was used to inoculate 2.8 l Fernbach flasks containing 500 ml 2xYT media (16 g tryptone, 10 g yeast extract, and 5 g NaCl / l) and 100 mg/ml ampicillin. Cells were grown at 37 C, 250 RPM to an O.D. of 0.8 to 1.0 and then induced by adding IPTG at a final concentration of 1 mM. The temperature was lowered to 30 C and the cells were grown an additional 12 – 14 hours shaking at 250 RPM. Cells were collected by centrifugation and stored at − 80 C until use.
Purification and Characterization of GST fusion proteins
Frozen bacterial cells were resuspended in 4 volumes (4 ml / gram wet cell paste) 50 mM Tris-HCl pH 7.4 300 mM NaCl containing 4 mg / ml lysozyme, 0.05 mg/ml DNase,0.05 mg/ml RNase (Sigma Aldrich) and COMplete EDTA free protease inhibitor cocktail (Roche) (1 tablet / 25 ml). Cells were stirred on ice 30 min followed by sonication for 30 seconds at 50 % duty cycle and 60% power (Branson Model 450 sonifier). Cells were then stirred an additional 30 min. Cell debris was removed by centrifugation at 10000 RPM for 30 min in a Beckman J2-21 centrifuge equipped with a JA-20 rotor. The supernatant was loaded onto a 3 ml GSTrap affinity column (GE Healthcare) equilibrated in 50 mM Tris HCl pH 7.4 300 mM NaCl and then washed with 9 ml of equilibration buffer. The pure GST fusion protein was eluted with buffer containing 10 mM reduced glutathione (GSH). Fractions containing an XFP (or GST activity in the case of GST-TC) were pooled and concentrated using an Amicon Ultra centrifugal concentrators with a 10000 MW cutoff. Excess GSH was removed from the samples by passing over a G25 column equilibrated in 0.1 M KPi pH 7.4. Protein samples were either used immediately or frozen in liquid nitrogen after the addition of glycerol at a final concentration of 20%. Frozen stocks were stored at − 80 C until use.
Enzyme activity was measured using a well characterized GST catalyzed reaction of GSH and 1-chloro-2,4-dinitrobenzene (CDNB) whose product has an increased absorbance at 340 nm 11. A stock solution of CDNB was prepared in absolute ethanol at a final concentration of 40 mM and a 0.1 M GSH stock solution was prepared in 0.1 M KPi pH 6.5. Reactions were carried out in 0.1 M potassium phosphate buffer, pH 6.5, 1 mM CDNB, 5 mM GSH. Kinetic traces were obtained by monitoring the absorbance increase at 340 nm. A background rate of reaction was recorded for 1 min prior to the addition of GST fusion protein. Reactions were initiated by the addition of an appropriate amount of the GST fusion protein and the pseudo first order rate was determined from the initial slope of the kinetic traces. The extent of fluorescent protein chromophore maturation was estimated by measuring protein concentration using the BCA protein assay (Pierce) and comparing these values to the values obtained from the published chromophore extinction coefficients (Clonetech).
Chromophore Assisted Laser Inactivation
An unfocused continuous wave argon-ion laser (Stabilite 2017, Spectra-Physics, Mountain View, CA) was used to irradiate FP-GST at the following wavelengths: 488nm for EGFP and FlaSH, 514nm for EYFP, and 457.9 for ECFP. Laser power output was verified using a power meter (Coherent FieldMate with PM3Q head, Santa Clara, CA). The laser light was directed onto a chamber consisting of a Teflon plate into which a hole 10 mm deep and 5 mm in diameter had been milled (Figure S-1). This plate was placed on an x-y translation stage and the chamber was centered under the beam. In separate experiments, the temperature increase in the chamber during illumination was monitored at regular time intervals (1min) using a thermistor TA-29 (Warner Instruments, Hamden CT) connected to temperature controller TC-344B (Warner Instruments, Hamden CT).
Prior to irradiation, the GST activity of the sample was assayed as a baseline for CALI efficiency measurements. The UV-Vis absorbance spectrum, and the fluorescence intensity at the emission maximum of the FP GST enzyme activity were measured. After illumination for a determined amount of time, the GST activity, absorbance and fluorescence were again measured as described above to determine the amount of CALI as well as the extent of chromophore and fluorophore bleaching. Typical UV-vis absorbance spectra before and after CALI are shown in (Figure 1B insets). The amount of CALI as a percentage is defined as:
Figure 1. The CALI effect and fluorophore and chromophore photobleaching depend on the illumination dose.
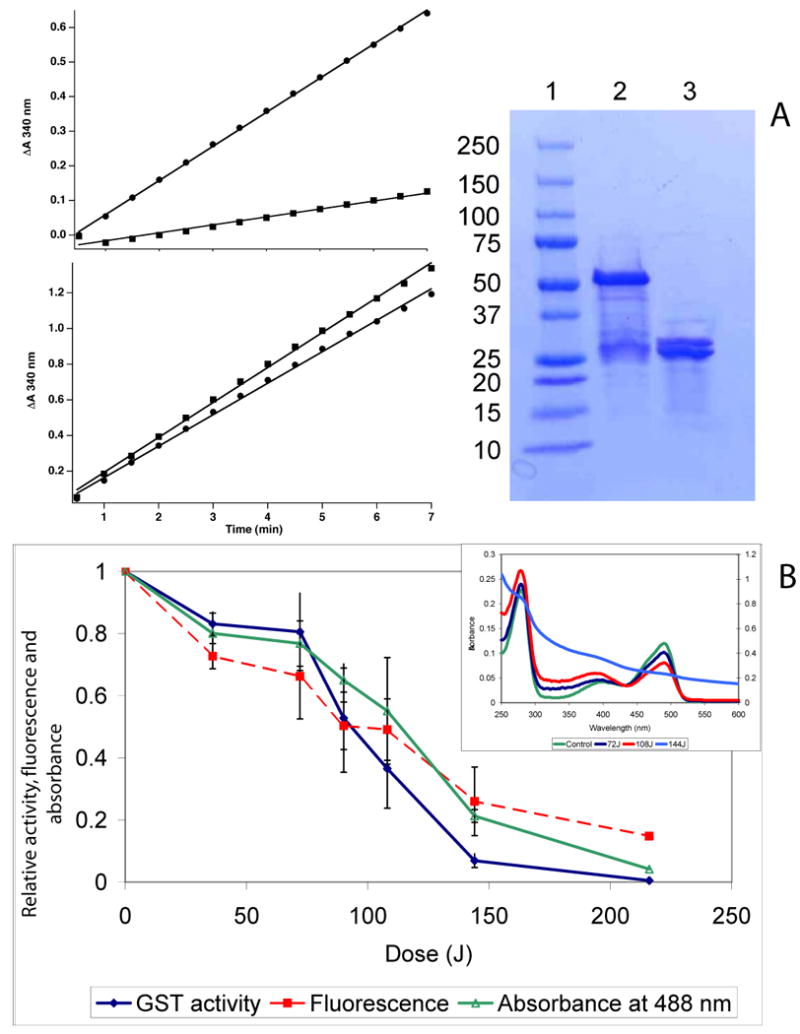

(A) Kinetic traces of CDNB turnover. Top Left: GST-EGFP Before irradiation (circles) and after irradiation (squares). Bottom Left: GST-EGFP + 0.1U thrombin, before irradiation (circles) after irradiation (squares). Right SDS PAGE: Lane 1. Standards 2: GST-EGFP 3: GST:EGFP + 0.1 U Thrombin. (B, C &D) Relative activity (diamonds), fluorescence (rectangles) and peak absorbance (open triangles) remaining after irradiation decrease with increasing irradiation dose (obtained by increasing time at constant laser power) for purified XFP-GST. (B) ∼ 25μM concentrations of EGFP-GST illuminated with 1200 mW at 488 nm. (C) a 27.5 μM concentration of EYFP-GST illuminated with 1200 mW at 514 nm. (D) a 29.1 μM concentration of ECFP-GST illuminated with 400 mW at 457.9 nm. Data points were collected in two (ECFP and EYFP) or three (EGFP) separate experiments and every point is the result of triplicate determinations. Error bars are standard deviations of such measurements. (In the case of EYFP and ECFP, determinations on the same day yielded error bars within the dimension of points on the graph.) All measurements (activity, blue; fluorescence, red and absorbance, green) were normalized to the initial values of non-illuminated sample to give relative values on the ordinate.
| Eqn. 1 |
where Aillumin denotes enzymatic activity of the illuminated sample and Acontrol is the enzymatic activity before illumination. To determine the possible temperature effect on the activity of GST-EGFP, a 100 μL sample of EGFP-GST was incubated for 5 minutes at temperatures ranging from 37 to 55 C and then assayed for GST activity and chromophore integrity.
Oxygen Depletion and Singlet Oxygen Quenchers
Oxygen was reduced in the GST samples by incubating with 2mM Na2S2O4 (Kodak, Cat. 1066513) solution in KPi buffer pH 7.4 for 10 minutes prior to irradiation. Oxygen was also reduced in the GST-FP samples by incubating with OxyFluor (Oxyrase, Inc, Mansfield, Ohio) and 10mM lactic acid in KPi (pH 7.4) for 30 minutes. A drop of mineral oil (∼ 50 μl) was layered on top of the sample chamber to prevent oxygen exchange with the environment before and during irradiation. The chamber was then flushed with Argon and sealed with a coverslip. The oxygen level in the buffer was measured using a calibrated Clark-type O2 mini-electrode 12. The sample was carefully removed to avoid the top layer of oil. The singlet oxygen quencher sodium azide (10mM, and 100 mM; Sigma), and GSH (10mM, 40mM, Fisher) were incubated with samples containing GST-XFP for 15 minutes prior to illumination.
Results
Spatial selectivity of FP CALI
To assess the importance of the proximity of the fluorophore to the target protein, experiments were conducted in the presence and absence of thrombin which will specifically cleave the fusion in the linker region between GST and EGFP. Fig 1 A (left panel) shows pre and post irradiation kinetic traces for GST-EGFP (top) and a thrombin cleaved GST ::: EGFP (bottom). The CALI effect is evident only when the fusion protein remains intact thereby maintaining the EGFP and GST in close proximity. When the fusion protein is cleaved, EGFP is bleached but no inactivation occurs.
CALI dose-response characteristics for XFP-GST
Figure 1 B,C, and D show that bleaching and inactivation depends on the illumination dose (intensity [irradiance] X time) for GST-EXFP fusions. The insets show representative absorption spectra at various exciting light doses and show that only the chromophore bleaches leaving UV absorption of the fusion protein intact. Comparison of the results for GST-EGFP, GST- EYFP and GST-ECFP are instructive and yields some unexpected observations. The dependence on light dose for fluorophore and chromophore bleaching is different for each XFP. For EGFP and EYFP fusions, the fluorophore and chromophore bleaching exhibit similar dependencies on dose suggesting they are closely related processes. For EYFP-GST, the dependence on dose is almost exactly similar for fluorophore and chromophore bleaching and both bleaching processes show perfect reciprocity between excitation flux and time of excitation (Figure S-2). However, the ECFP chromophore is considerably more resistant to bleaching while the bleaching of the fluorescence occurs at lower illumination doses (compare Figure 1D to 1B and 1C).
The relationship between bleaching and CALI also depends on the XFP employed. First, when the chromophore is bleached, CALI is no longer effective as expected. In the case of EGFP-GST CALI, chromophore and fluorophore bleaching are parallel processes (Figure 1B), all tending towards completion, suggesting a common intermediate, most likely singlet oxygen (see below). By contrast, CALI of ECFP-GST and EYFP-GST is not complete and plateaus to non-zero values of inhibition as a function of dose (Figure 1C,D). The magnitude of this effect depends on the laser power employed. When similar doses of illumination to EGFP-GST are delivered with 600 mW of power but for longer durations, CALI is similarly not complete; compare Figure S-3A (the same as Figure 1B for convenience) and S-3B. One possibility for apparent protection of the enzyme at high light doses is that in the case of EYFP and ECFP, the chromophore is much more sensitive to the ROS produced during irradiation; thus, bleaching occurs before a significant amount of ROS can escape the β-barrel, thereby lowering the efficiency of inactivation. Another possibility is that a fraction of these fusions is protected from CALI, presumably by structural factors inherent in the fusion protein.
For EXFP fusions to be effective CALI reagents the inactivation needs to be specific and act on the target of interest in the presence of other cellular proteins. In Figure S-4, we show that similar characteristics for CALI are obtained when EGFP-GST is irradiated in bacterial cell lysates. This is important because such lysates will be a more realistic approximation to CALI in the protein rich cytosol of cells.
It was initially surprising that the CALI effect exhibited a strong dependence on the concentration of the XFP-GST tested. This dependence is shown for EGFP-GST, EYFP-GST and for ECFP-GST in Figure 2. This suggests that protein concentration dependent factors such as light-induced oligomerization or micro-aggregation play an important role in the mechanism of inactivation. This can be clearly seen in the absorption spectra of EGFP-GST in Figure 1B. At high dose, the spectra is typical of that dominated by light scattering and the samples become visibly turbid. To compare the relative CALI efficiencies of the XFPs and FlAsH, we employed concentrations in which aggregation was limited. These results are summarized in Table I and are normalized to the number of photons absorbed. The study shows that the order of CALI effectiveness per absorbed photon is FlAsH>EGFP>EYFP>ECFP.
Figure 2. CALI effect of FP-GST depends on the concentration of illuminated sample.

EGFP-GST (rectangles, 90J dose) and YFP-GST (open triangles, 144J dose) show similar dependency of CALI effect on illuminated sample concentration while CFP-GST (diamonds, 216J dose), require much higher concentrations of the sample to show similar CALI effect. Inactivation is defined in Equation 1. Error bars are standard deviations of triplicate determinations at each concentration.
Table I. Relative CALI efficiencies of purified FP-GST variants and FlAsH-labeled GST.
| Probe | λexc (nm) | Dose (Joules) | CALI inactivation (%) | Relative CALI efficiency | Relative CALI efficiency per absorbed |
|---|---|---|---|---|---|
| EGFP | 488 | 144 | 94 | 1 | 1 |
| ECFP | 457.9 | 144 | 9 | 0.1 | 0.27 |
| EYFP | 514 | 144 | 51 | 0.5 | 0.34 |
| FlAsH | 488 | 36 | 80 | 6.6 | 2.43 |
Data in column 4 are averaged experimental values as defined by Eqn 1. Values in column 5 were obtained by defining EGFP % CALI as 1 and correcting for dose. Final numbers in column 6 were obtained by correcting the values in column 5 by a factor that reflects the product of the difference in the number of photons for an excitation dose at a given wavelength (e.g. there are more photons in a 144J dose at 488 nm than at 457.9 nm by a factor of 1.07) and the difference in the extinction coefficient for each CALI reagent at the excitation wavelength.
Mechanism of EGFP-CALI
CALI depends on oxygen and ROS
The FP-CALI and FlaSH-CALI process depends on both light and oxygen. Figure 3A shows a summary of the effects of adding ROS scavengers. We employed the oxygen scavenger, Na2S2O4, to demonstrate that oxygen is required for the CALI process; we also removed oxygen using Oxy-Flour with similar effect. It is likely that the predominant ROS is singlet oxygen as shown by the efficient quenching of CALI by NaN3, which increases going from 10 mM to 100 mM NaN3. In addition the general ROS trap, glutathione which is also present in the cytoplasm abrogates the CALI process. Interestingly, NaN3 had little effect on absorbance (Figure 3B) and fluorescence photobleaching of EGFP (data not shown). However, it is clear that CALI of EGFP-GST was inhibited because the light scattering signature is lost from the spectrum in the presence of NaN3. (The absorbance increase in the spectral region below 280 nm is due to specific absorption of NaN3 and not a light scattering effect as determined by absorbance measurements of pure NaN3 in solution (data not shown)). This effect may be explained by the accessibility of the chromophore to the inhibitor. Upon irradiation and interaction with molecular oxygen, the chromophore is exposed to a locally high concentration of ROS; unless the inhibitor can diffuse freely through the structure of the protein, inhibition of bleaching is apparently less efficient. This also strongly suggests that it is the ROS that escape the β-barrel structure that cause the CALI effect and it is these species that can be quenched by azide. Similar, though not identical, inhibition effects are seen for EYFP- and ECFP-GST CALI experiments (Figure S-5).
FIGURE 3. Effect of inhibitors on the CALI effect and chromophore bleaching.
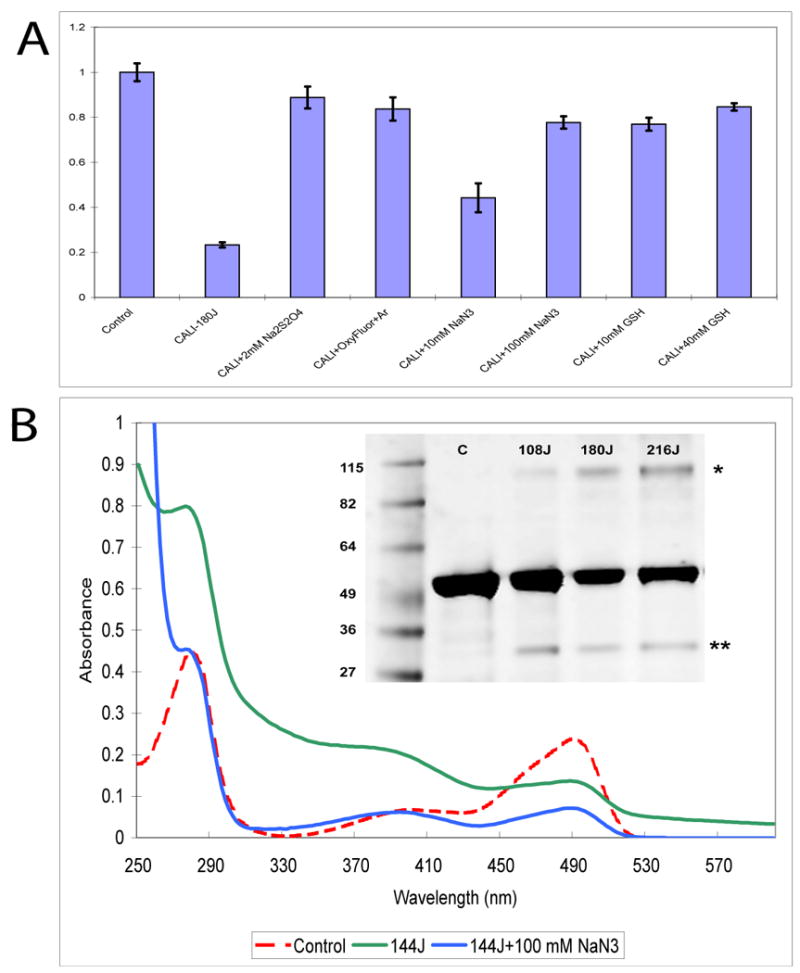
(A) EGFP-GST CALI effect depends on the presence of oxygen. GST activity diminishes after illumination with 180J dose (middle bar) but removal of oxygen from solution by addition of 2.5 mM of sodium dithionate (Na2SO4) or OxyFluor prevents inactivation of GST by light. Addition of 10 mM and 100 mM of sodium azide (NaN3) partially decreases the inactivation of EGFP-GST after illumination with 180 J dose of light and its effect increases with the concentration implicating singlet oxygen in CALI inactivation of EGFP-GST. When introduced into solution at 10 mM and 40 mM (not shown) concentrations, GSH—a general ROS inhibitor, commonly present in cells, almost fully protects the enzymatic activity of EGFP-GST against CALI. (B) Absorbance spectra of EGFP-GST show formation of crosslinked photoproducts after illumination with 144J dose of light (green line, compare to control, red line). Addition of 100mM NaN3 prevents the formation of such aggregates but it does not prevents the chromophore photobleaching. This indicates that ROS are responsible for formation of crosslinked aggregates. Inset: SDS PAGE analysis of EGFP-GST after illumination with different doses of light. Main band, centered around 53 kD, represents EGFP-GST construct. High molecular weight (>100 kD) bands with increased amount of protein show after illumination of the sample with increasing doses of laser light. These bands are probably crosslinked photoproduct. Minor amounts of degradation (presumably, photocleavage) indicated by lower molecular weight bands (∼ 30 kD).
CALI is accompanied by cross-linking and breakdown
SDS PAGE was employed at the end of the experiment to assess the integrity of the EGFP-GST as shown in Figure 3B (inset) after maximum dose. The gel reveals evidence of small amounts of both higher and lower MW components. The former suggests ROS induced cross-linking 13 while the latter band at ∼ 25KDa reveals a photoinduced cleavage, possibly between EGFP and GST.
CALI is not due to thermal effects
The temperature increase at the end of a given irradiation was monitored and a substantial temperature increase (to∼ 45 C) occurred due to the absorption of XFP but no appreciable increase was recorded in buffer alone. This is shown in Figure S-6A. However, the GST part of the fusion protein remains enzymatically active when incubated at temperatures up to 50 C for 5 min (Figure S-6B), which is similar to the heating observed during irradiation. During this same incubation, the fluorophore and chromophore were similarly stable (Figure S-6B). Above 50 C, enzyme activity dropped rapidly presumably due the thermal denaturation of the GST but molecular integrity of the fusion was retained as shown by SDS-PAGE analysis (Figure S-6C) as would be expected. GST-ECFP and GST-EYP were also tested and remained stable at temperatures <50 C (data not shown). Therefore, we conclude that the inhibition of CALI activity is due to light-mediated damage and is not due to thermal effects.
Discussion
Overall, we have shown that the XFP-CALI effect involves light and oxygen. Bleaching and CALI follow parallel courses for GST-EGFP but not in the case of GST-ECFP or GST-EYFP where some of the fusion protein is effectively protected against CALI at higher irradiation doses (Figure 1). Post CALI SDS gels followed show that EGFP-GST remains largely intact after irradiation (Figure 3B, inset), although a small amount of aggregation and cleavage occurs. At higher concentrations of protein, crosslinking and aggregation, as evidenced by the spectra in Figure 3B as well as the dependence of inactivation on protein concentration, presumably play a role in the mechanism of inactivation. Indeed, our results conform to general patterns of singlet oxygen damage inflicted on proteins: breakage of the protein backbone is relatively unlikely but aggregation via singlet oxygen mediated cross-linking is a common damage mode 13-15.
The effectiveness of an XFP as a CALI reagent appears to involve a complex interplay of various factors as depicted in Figure 4. First, there are factors intrinsic to the XFP itself including the type of chromophore, its maturation and its stability. Next, one needs to consider the particular fusion, the inactivating light dose and the presence of molecular oxygen. Finally, mechanistic factors will be important: the spatial disposition of the chromophore and the target protein (some orientations may not favor inactivation mediated by ROS), the relative amounts of ROS released from the XFP vs. ROS trapped inside the XFP which will cause bleaching, and, the propensity for intramolecular as contrasted to cross-linking damage inflicted on the target protein. In general, the mechanism of fluorescent protein CALI will be multifactorial so that, at this juncture, case by case empirical studies will be required before rational design principles can be developed.
FIGURE 4. Factors influencing the effectiveness of XFP-CALI.

It is likely that both the photobleaching and the CALI effect proceed from the triplet state obtained via intersystem crossing after excitation (see, for example, 3). However the quantum yields for photobleaching and CALI are much smaller than that for emission. Thus when a pulse of light is absorbed by the chromophore, a large burst of emitted photons accompanies the absorption as well as a much smaller burst of ROS, albeit with time delays. It is likely that the major ROS produced by light interaction with EGFP, at least, will be singlet oxygen 3, 16, 17. If the photoproducts escape the XFP, they will form a cloud whose dimension is defined by the excitation intensity, the mobility of the ROS and the density of reactive sites proximate to the ROS generator. We suppose that the effectiveness of CALI will depend on the ratio of escaped ROS to those trapped in the barrel where they can bleach the fluorophore and chromophore; bleaching the chromophore will effectively terminate CALI. Xanthene-based dyes would be expected to be more effective CALI reagents since they have a higher intrinsic quantum yield for the production of ROS and the ROS produced have little structural impediment to reaching reactive amino acid residues. Thus, the increased effectiveness of FlAsH as compared to the XFPs (Table I) could be expected. Indeed, the first studies done on the effectiveness of GFP for CALI in vitro were done by Surrey et al. 10 who showed that the irradiation dose for a given inactivation of β-galactosidase was roughly 6000X and 70X higher than that required for fluorescein and malachite green tagged antibodies, respectively. Rajfur et al performed the first EGFP-CALI studies in cells 1 and showed that when EGFP-alpha-actinin was locally inactivated, detachment of the actin filaments linked to integrins through alpha-actinin occurred. The local irradiation dose was estimated to be approximately 200X that used for ReAsH studies (105 kJ/cm2)8.
The order of CALI effectiveness is FlAsH>EGFP>EYFP>ECFP normalized to equal number of photons absorbed, with FlAsH being considerably more effective. Being a good sensitizer is a double-edged sword, however, because it generally means that the probes are quite bleachable. This hampers localization by fluorescence imaging and means that CALI is being effected while the target protein is being localized in the image. In this respect, some XFPs, such as EGFP, will have an advantage in that the CALI regime is separated from the imaging regime in terms of the irradiation dose required for each operation.
We have discussed desirable characteristics for a CALI chromophore elsewhere 3 and several improvements could be anticipated. First, for the XFPs, high throughput screens 18 can be designed to screen many FP mutants for an optimal compromise between CALI and facile imaging. Second small, highly specific, dyes may be designed to bear both a CALI chromophore and a spectrally distinct fluorophore for imaging the location of the target protein without excessive bleaching. Recently, an optimization of CALI chromophores was accomplished based on the Halo reagent 19.
Supplementary Material
Acknowledgments
The authors acknowledge the helpful discussions with members of the Image & Photomanipulation Facility of the Cell Migration Consortium and the support of the Consortium [NIH GM 64346]. The suggestions of Cai Huang were invaluable in the conduct of these experiments.
References
- 1.Rajfur Z, Roy P, Otey C, Romer L, Jacobson K. Nat Cell Biol. 2002;4:286–293. doi: 10.1038/ncb772. [DOI] [PubMed] [Google Scholar]
- 2.Vitriol EA, Uetrecht AC, Shen F, Jacobson K, Bear JE. Proc Natl Acad Sci U S A. 2007;104:6702–6707. doi: 10.1073/pnas.0701801104. [DOI] [PMC free article] [PubMed] [Google Scholar]
- 3.Jacobson K, Rajfur Z, Vitriol EA, Hahn K. Trends Cell Biol. 2008 doi: 10.1016/j.tcb.2008.07.001. in press. [DOI] [PMC free article] [PubMed] [Google Scholar]
- 4.Jay DG. Proc Natl Acad Sci U S A. 1988;85:5454–5458. doi: 10.1073/pnas.85.15.5454. [DOI] [PMC free article] [PubMed] [Google Scholar]
- 5.Linden KG, Liao JC, Jay DG. Biophys J. 1992;61:956–962. doi: 10.1016/S0006-3495(92)81902-1. [DOI] [PMC free article] [PubMed] [Google Scholar]
- 6.Liao JC, Roider J, Jay DG. Proc Natl Acad Sci U S A. 1994;91:2659–2663. doi: 10.1073/pnas.91.7.2659. [DOI] [PMC free article] [PubMed] [Google Scholar]
- 7.Marek KW, Davis GW. Neuron. 2002;36:805–813. doi: 10.1016/s0896-6273(02)01068-1. [DOI] [PubMed] [Google Scholar]
- 8.Tour O, Meijer RM, Zacharias DA, Adams SR, Tsien RY. Nat Biotechnol. 2003;21:1505–1508. doi: 10.1038/nbt914. [DOI] [PubMed] [Google Scholar]
- 9.Marks KM, Braun PD, Nolan GP. Proc Natl Acad Sci U S A. 2004;101:9982–9987. doi: 10.1073/pnas.0401609101. [DOI] [PMC free article] [PubMed] [Google Scholar]
- 10.Surrey T, Elowitz MB, Wolf PE, Yang F, Nedelec F, Shokat K, Leibler S. Proc Natl Acad Sci U S A. 1998;95:4293–4298. doi: 10.1073/pnas.95.8.4293. [DOI] [PMC free article] [PubMed] [Google Scholar]
- 11.Mannervik B, Danielson UH. CRC Crit Rev Biochem. 1988;23:283–337. doi: 10.3109/10409238809088226. [DOI] [PubMed] [Google Scholar]
- 12.Holmuhamedov EL, Jovanovic S, Dzeja PP, Jovanovic A, Terzic A. Am J Physiol. 1998;275:H1567–1576. doi: 10.1152/ajpheart.1998.275.5.H1567. [DOI] [PubMed] [Google Scholar]
- 13.Davies MJ. Biochem Biophys Res Commun. 2003;305:761–770. doi: 10.1016/s0006-291x(03)00817-9. [DOI] [PubMed] [Google Scholar]
- 14.Lepock JR, Thompson JE, Kruuv J. Biochem Biophys Res Commun. 1978;85:344–350. doi: 10.1016/s0006-291x(78)80048-5. [DOI] [PubMed] [Google Scholar]
- 15.Yan P, Xiong Y, Chen B, Negash S, Squier TC, Mayer MU. Biochemistry. 2006;45:4736–4748. doi: 10.1021/bi052395a. [DOI] [PubMed] [Google Scholar]
- 16.Greenbaum L, Rothmann C, Lavie R, Malik Z. Biol Chem. 2000;381:1251–1258. doi: 10.1515/BC.2000.153. [DOI] [PubMed] [Google Scholar]
- 17.Jimenez-Banzo A, Nonell S, Hofkens J, Flors C. Biophys J. 2008;94:168–172. doi: 10.1529/biophysj.107.107128. [DOI] [PMC free article] [PubMed] [Google Scholar]
- 18.Shaner NC, Campbell RE, Steinbach PA, Giepmans BN, Palmer AE, Tsien RY. Nat Biotechnol. 2004;22:1567–1572. doi: 10.1038/nbt1037. [DOI] [PubMed] [Google Scholar]
- 19.Lee J, Yu P, Xiao X, Kodadek T. Mol Biosyst. 2008;4:59–65. doi: 10.1039/b712307h. [DOI] [PubMed] [Google Scholar]
Associated Data
This section collects any data citations, data availability statements, or supplementary materials included in this article.