Abstract
Previous studies show that phonation onset occurs as two eigenmodes of the vocal folds are synchronized by the interaction between the vocal folds and the glottal flow. This study examines the influence of the geometrical and biomechanical properties of the vocal folds on this eigenmode-synchronization process, with a focus on phonation threshold pressure and frequency. The analysis showed that phonation threshold pressure was determined by the frequency spacing and coupling strength between the two natural modes that were synchronized by the fluid-structure interaction. The phonation frequency at onset was the root mean square value of the two natural frequencies plus a correction due to the added stiffness of the glottal flow. When higher-order modes of the vocal fold structure were included, more than one group of eigenmodes was synchronized as the system moved toward phonation onset. Changes in vocal fold biomechanics may change the relative dominance between different groups and cause phonation onset to occur at a different eigenmode, which was often accompanied by an abrupt change in onset frequency. Due to the synchronization of multiple pairs of eigenmodes and the mode-switching possibility, a complete and accurate description of vocal fold biomechanical properties is needed to determine the final synchronization pattern and obtain a reliable calculation of the dependence of phonation threshold pressure and frequency on vocal fold geometry and other biomechanical properties.
INTRODUCTION
Phonation threshold pressure is defined as the minimum lung pressure that initiates self-sustained vibration of the vocal fold (Titze, 1988, 1992). Due to its theoretical and potentially practical importance (Titze et al., 1995), phonation threshold pressure and its dependence on vocal fold properties have been investigated in many previous studies (Ishizaka, 1981, 1988; Titze, 1988, 1992; Titze et al., 1995; Chan et al., 1997; Lucero and Koenig, 2005, 2007). Using a linear stability analysis, Ishizaka (1981, 1988) derived conditions of phonation onset in the two-mass model. By numerically solving for the eigenmodes of the coupled airflow-vocal fold system, he showed that two natural modes of the vocal folds degenerated into a single mode as a consequence of aerodynamic coupling at a threshold flow rate, beyond which oscillation can be self-sustained. This eigenmode synchronization led to a phase difference in the motion of the upper and lower masses. Recognizing the importance of this phase difference in sustaining vocal fold vibration, Titze (1988) proposed a mucosal wave model, in which he related the phonation threshold pressure to the so-called mucosal wave velocity:
| (1) |
where kt is a transglottal pressure coefficient, B is the mean damping coefficient, c is the mucosal wave velocity, ξ01 and ξ02 are the prephonatory glottal half-widths at the upper and low margins of the medial surface, and T is the medial surface thickness. Equation 1 reveals the relation between the presence of the mucosal wave (or phase difference, as represented by the mucosal wave velocity c) and the energy transfer between the vocal folds and glottal flow (as represented by the phonation threshold pressure). As the mucosal wave can be directly observed in humans, this equation lays a theoretical foundation for many diagnostic measures of voice based on quantifying the mucosal wave motion using either stroboscopic or high-speed recordings of human vocal fold vibration. However, like the phonation threshold pressure, the mucosal wave velocity itself is a dynamic variable of the coupled airflow-vocal fold system and cannot be determined a priori. Therefore, a direct link between vocal fold biomechanics and phonation threshold pressure is still missing. Clinically, such a link would allow us to better predict the consequence of surgical manipulation of the vocal folds properties (e.g., geometry and stiffness of the multilayers of the vocal folds) and therefore help surgeons to better plan and evaluate possible treatment options.
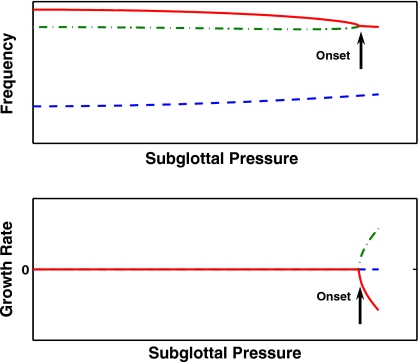
Recently, Zhang et al. (2007) extended the linear stability analysis to a continuum model of the vocal folds, and the same eigenmode-synchronization phenomenon as in Ishizaka, 1981 was observed (Fig. 1). Further studies using the same model (Zhang, 2008, 2009) showed that details of the eigenmode-synchronization process determined the characteristics of phonation onset (threshold pressure, frequency, and vocal fold vibration pattern). A slight change in the eigenmode-synchronization pattern, as induced by changes in properties of the vocal system, may lead to qualitatively different vocal fold vibration and abrupt changes in phonation onset frequency. Therefore, it seems that a better insight into the physics of phonation onset can be obtained by examining how vocal fold biomechanics affect the eigenmode-synchronization process, from which the influence of vocal fold biomechanics on phonation onset characteristics can be identified.
Figure 1.
A typical eigenmode-synchronization pattern. Phonation onset occurs as two modes of the vocal folds are synchronized by the glottal flow. The figure shows the frequency (top) and growth rate (bottom) of the first three eigenmodes of the vocal folds as a function of the subglottal pressure. As the subglottal pressure increases, the frequencies of the second and third modes gradually approach each other and, at a threshold subglottal pressure, synchronize to the same frequency. At the same time, the growth rate of the second mode becomes positive, indicating the coupled airflow-vocal fold system becomes linearly unstable and phonation onset.
This study aims to identify the geometrical and biomechanical factors that affect phonation threshold pressure and frequency. This is achieved by first studying phonation threshold pressure and frequency in an idealized case of zero damping (both structural and flow-induced) and assuming a two-mode representation of the vocal fold motion (Sec. 2). Such simplifications allow the phonation threshold pressure and frequency to be analytically investigated, in which way the factors underlying the eigenmode-synchronization process can be revealed. In the second part of the paper (Sec. 3), numerical simulations were used to further illustrate the physical concept developed in Sec. 2 (Sec. 3A). The simplifications made in Sec. 2 were then relaxed and influence of higher-order modes (Sec. 3B), glottal opening (Sec. 3C), and damping (Sec. 3D) was examined. In contrast to the lumped-mass model used in Ishizaka, 1988, a continuum model of the vocal folds (Zhang et al., 2007; Zhang, 2009) was used in this study so that the phonation threshold pressure and frequency were related to directly measurable parameters of the vocal system, such as vocal fold geometry and stiffness.
THEORY
Continuum vocal fold model
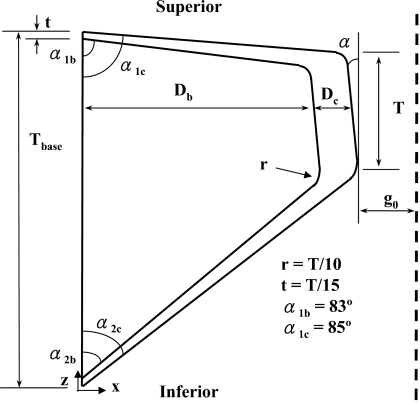
Figure 2 shows the continuum vocal fold model used in this study. A body-cover idealization as suggested by Hirano (1974) was used. The geometric control parameters of the model include the vocal fold thickness at the lateral base Tbase, the medial surface thickness T, the depths of the body and cover layers Db and Dc, respectively, the divergence angle of the medial surface from the glottal centerline α, the angles of the glottal exit of the body and cover layers, and the minimum glottal half-width at rest g0. Left-right symmetry in system dynamics about the glottal centerline was assumed so that only half of the system was considered in this study. The vocal folds were modeled as a two-dimensional, plane-strain elastic body. Each layer has distinct density and Young’s modulus. No vocal tract was included in this study. A constant flow rate Q was imposed at the glottal entrance. A potential-flow description was used for the glottal flow up to the point of flow separation, beyond which the pressure was set to the atmospheric pressure. The flow was assumed to separate from the glottal wall at a point downstream of the minimum glottal constriction whose width was 1.2 times the minimum glottal width.
Figure 2.
The two-dimensional vocal fold model and the glottal channel. The coupled airflow-vocal fold system was assumed to be symmetric about the glottal channel centerline, and only the left half of the system was considered in this study. T and Tbase are the thicknesses of the vocal fold in the flow direction at the medial surface and the lateral base, respectively; Db and Dc are the depths of the vocal fold body and cover layers at the center of the medial surface, respectively; g0 is the minimum glottal half-width of the glottal channel at rest. The divergence angle α is the angle formed by the medial surface of the vocal fold with the z-axis. Other control parameters include the thickness of the cover layer at the base of the vocal fold, t, the rounding fillet (for smoothing of the otherwise sharp corners) radius, r, and the glottal exit angles of the body and cover layers. The dash line indicates the glottal channel centerline.
Linear stability analysis
Phonation onset can be studied by examining how the eigenmodes and eigenvalues of the coupled airflow-vocal fold system vary as the glottal flow rate Q is increased from zero. Phonation onset occurs when the growth rate (real part of the eigenvalue) of one of the eigenvalues first becomes positive, indicating that the coupled system becomes linearly unstable. A brief description of the analysis procedure is given below. For details of the derivation of the system equations and the procedure of the linear stability analysis, readers are referred to the original papers of Zhang et al. (2007) and Zhang (2009). The analysis consists of two steps. In the first step, a steady-state problem was solved for the static deformation of the vocal fold structure for a given glottal flow rate Q (Zhang, 2009). In the second step, a linear stability analysis (Zhang et al., 2007) was performed on the deformed state of the airflow-vocal fold system. The governing equations of the eigenvalue problem were derived from Lagrange’s equations as
| (2) |
where q is the generalized coordinate vector, M, C, K are the mass, damping, and stiffness matrices of the vocal fold structure, and the three matrices Q0, Q1, Q2 are the flow-induced stiffness (proportional to vocal fold displacement), flow-induced damping (proportional to vocal fold velocity), and flow-induced mass (proportional to vocal fold acceleration) matrices, respectively. All three matrices (Q0,Q1,Q2) are functions of the jet velocity Uj, which was calculated in the steady-state problem using the imposed subglottal flow rate and the resting vocal fold geometry. Equation 2 was solved as an eigenvalue problem by assuming a solution form of q=q0est, where s is the eigenvalue and q0 is the corresponding eigenmode. The two-step procedure was repeated until the flow rate was increased to a point that phonation onset was detected. The phonation threshold pressure would then be the subglottal pressure at onset, and the phonation onset frequency would then be given by the imaginary part of the corresponding eigenvalue.
Zhang et al. (2007) showed that the flow-induced stiffness term Q0 played a dominant role in the eigenmode-synchronization process. When the other two flow-induced terms (Q1 and Q2) and structural damping are excluded, Eq. 2 becomes
| (3) |
The flow-induced stiffness matrix Q0 is (Zhang et al., 2007)
| (4) |
where [φi,x,φi,z] is the ith normal mode of the vocal fold structure, ρf is the density of air, Uj is the mean jet velocity at the point of flow separation, H0 is the glottal channel width as a function of the coordinate z, which is along the flow direction, Hs is the glottal channel width at the point of flow separation (Hs≈2×g0×1.2 in this study), and lfsi denotes the portion of the vocal fold surface from the glottal inlet to the point of flow separation. The asterisk denotes that the function is evaluated at the point of flow separation.
Two-mode approximation
Equation 3 was further simplified by assuming a two-mode approximation of the vocal fold motion, i.e., the vocal fold displacement [ξ,η] (displacement in the medial-lateral and inferior-superior directions, respectively) was approximated as the linear combination of the first two normal modes of the vocal fold structure:
| (5) |
Substitution of Eqs. 5 into Eq. 3 yields
| (6) |
where ω0,i is the natural frequency of the ith natural mode of the vocal fold structure, and
| (7) |
Note that γ is related to the subglottal pressure by a geometric factor:
| (8) |
where Hinlet is the glottal width at the glottal inlet. For convenience, the variable γ and the subglottal pressure Ps are used interchangeably in the rest of this paper. Assuming q=q0est, Eq. 6 was solved as an eigenvalue problem for the eigenvalue s and the eigenmodes q0. The characteristic equation of the eigenvalue problem is
| (9) |
The solution to Eq. 9 is
| (10) |
Equation 10 shows that the effect of the flow-induced stiffness Q0 is twofold. The diagonal terms (a11 and a22) introduce additional stiffness to each corresponding eigenmode. [This can be seen by setting the off-diagonal terms (a12 and a21) to zero, in which case the two solutions become ω0,12+γa11 and ω0,22+γa22.] The off-diagonal terms couple the two relevant modes and therefore allow the frequencies of the two modes to either approach (for negative value of a12a21) or diverge (for positive value of a12a21) from each other (see further discussion below). For positive values of a12a21, Eq. 10 shows that the eigenvalue s is either purely imaginary or real, indicating the system is either neutrally stable or becomes linearly unstable at a zero frequency (or static divergence, in which the amplitude of the disturbance would grow monotonically with time, in contrast to an oscillatory increase in flutter instability). As we were concerned with nonzero-frequency instability, a negative value of a12a21 was assumed in the following derivation.
At onset, the real part of the eigenvalue s becomes zero so that the eigenvalue is purely imaginary, which occurs at the following condition:
| (11) |
Solving Eq. 11 yields the value of γ at onset (by requiring γ to be positive and, if both two solutions were positive, choosing the smaller of the two solutions):
| (12) |
where β is defined as the coupling strength between the two modes due to aerodynamic coupling. Note that a similar expression was also derived by Auregan and Depollier (1995) in a linear stability analysis of the soft palate under the influence of inspiratory flow. Substituting Eq. 12 into Eq. 10, the frequency at onset is
| (13) |
or the phonation threshold pressure can be written as a function of phonation onset frequency:
| (14) |
Equation 12 shows that the phonation threshold pressure depends on two factors: the frequency spacing and the coupling strength between the two natural modes that are being synchronized. Refer to Fig. 1, small frequency spacing indicates a small frequency difference that the two modes have to overcome to merge with each other and therefore a lower threshold pressure; and for the same frequency spacing, a strong coupling indicates that less airflow is required to synchronize the two modes.
The coupling strength, β, as defined in Eq. 12, again depends on two effects: the first is the relative frequency change due to the diagonal terms of the Q0 matrix (a11−a12) and the second is the relative frequency change due to the coupling effect of the off-diagonal terms. When the two off-diagonal terms are large and of opposite sign (positive coupling strength), the coupling effect would dominate and the two modes would be synchronized to a same frequency. When the off-diagonal terms are of the same sign (coupling strength is complex) or when they are of opposite sign but their product much smaller than the difference of the second and first diagonal terms (negative coupling strength), the frequencies of the two modes would diverge from each other and mode synchronization is then not possible. Note that, for a given glottal half-width and a known flow separation point, the coupling strength, β, depends solely on the properties of the vocal fold structure, and therefore can be readily calculated for any given geometry and material properties of the vocal folds.
When synchronization occurs, the frequency at onset is the root mean square of the two natural frequencies with a correction due to the diagonal terms of the flow-induced stiffness matrix, as shown in Eq. 13. When the correction term is small, the phonation frequency at onset would then be a value in between the natural frequencies of the two modes being synchronized.
Flutter versus static divergence
As briefly mentioned before, two types of instabilities can occur in Eq. 6: one occurs at a zero frequency (static divergence) and the other at a nonzero frequency (flutter). For positive values of a12a21 or negative coupling strengths, static divergence is the only possible instability. For negative values of a12a21 and positive coupling strengths, which instability occurs first depends on properties of the given system. Refer to Eq. 13, a zero threshold frequency ωth is only possible when the sum (a11+a22) is negative, in which case the diagonal terms of the flow-induced stiffness Q0 lower the frequency of the corresponding eigenmode. By requiring the onset frequency [Eq. 13] to be greater than zero, we have, after substitution of Eq. 12,
| (15) |
Equation 15 is the condition the system has to satisfy to have a nonzero-frequency instability (or flutter). The physical meaning of Eq. 15 is clear: the frequencies of the two modes have to be brought together by the off-diagonal terms before they reach zero by the stiffness-lowering effect of the diagonal terms (see, e.g., Figs. 2a, 2c in Zhang, 2008). In other words, the threshold pressure for the system to reach flutter onset has to be lower than the threshold associated with static divergence.
SIMULATIONS
In this section, the influence of varying medial surface thickness T was investigated as an example to further illustrate the concept of coupling strength, frequency spacing, and eigenmode synchronization. The variation in the medial surface thickness was achieved by adjusting the entrance angles of the vocal folds accordingly, while keeping other control parameters (the vocal fold thickness at the lateral base, the depths of the body and cover layers, the exit angles of the vocal folds, and the divergence angle) constant. The phonation threshold pressure and frequency were numerically calculated following the procedure described in Sec. 2B and in previous studies (Zhang et al., 2007; Zhang, 2009). Section 3A focuses on the idealized case as discussed in Sec. 2C. The effects of higher-order modes, glottal opening, and damping are then discussed in Sec. 3B, Sec. 3C, and Sec. 3D, respectively.
For the simulations below, a nondimensional formulation of system equations was used as in previous studies (Zhang, 2009). The vocal fold thickness at the lateral base , the cover layer density , and the wave velocity of the vocal fold cover layer were used as the reference scales of length, density, and velocity, respectively. For the results presented below, unless otherwise stated, the following values of the model parameters were used:
| (16) |
For a vocal fold thickness of 9 mm at the lateral base, Eq. 16 gives a vocal fold body depth of 6 mm, a cover depth of 1.5 mm, and a 0.18 mm minimum glottal half-width at rest. For a cover stiffness of 5 kPa and a cover density of 1030 kg∕m3, Eq. 16 gives a body stiffness of 50 kPa, and a reference frequency scale of 244 Hz.
Note that in this study the reference length scale was the vocal fold thickness at the lateral base, rather than the medial surface thickness as in previous studies (Zhang et al., 2007; Zhang, 2008, 2009). Due to this different choice of reference length scale, for the same frequency variables, the values in this study were generally larger than in previous studies.
Two-mode approximation and no damping
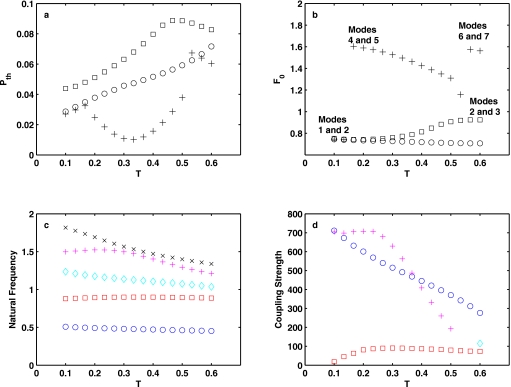
Figures 3a, 3b (circle symbols) show the phonation threshold pressure and frequency as a function of the medial surface thickness T. In this case, Eq. 6 was solved numerically for a convergent glottis with a divergence angle of −5°. Also shown in the figure are the natural frequencies [Fig. 3c] and the coupling strength β [Fig. 3d, circle symbols] as a function of the medial surface thickness T. Figure 3 shows that, in this case, the variation in the medial surface thickness had little effect on the natural frequencies of the first two modes. Consequently, the resulting phonation onset frequency stayed nearly constant with increasing T. However, the increase in the medial surface thickness did significantly lower the coupling strength, leading to an increase in phonation threshold pressure.
Figure 3.
(a) Phonation threshold pressure Pth and (b) phonation onset frequency F0 as a function of the medial surface thickness T. In (a) and (b), the symbol ○ denotes results obtained when Eq. 6 was solved with two modes only and no damping; + denotes results obtained when Eq. 3 was solved with the first ten modes included and no damping; ◻ denotes results obtained when Eq. 2 was solved with the first ten modes included and with a structural loss factor σ=0.4. (c) Natural frequencies of the first five modes (in ascending order) of the vocal fold structure as a function of the medial surface thickness T. (d) Coupling strength between the first and second modes (○), second and third modes (◻), third and fourth modes (◇), and fourth and fifth modes (+) as a function of the medial surface thickness T. A convergent geometry was used with α=−5° and g0=0.02. Coupling strengths for other pairs of modes were either negative or complex and are not shown.
Effects of higher-order modes
The continuum vocal folds have an infinite number of modes. Like the first two modes, other modes may also be synchronized by the glottal flow. Therefore, when higher-order modes are included, there is more than one pair of modes being synchronized. Phonation onset may occur at higher-order modes if the synchronization of the higher-order modes leads to a lower threshold pressure. Similarly, changes in the model parameters may change the relative dominance between different pairs of modes, causing phonation onset to occur at a different mode. Such switching between modes is often accompanied by a sudden change in phonation onset frequency.
Figures 3a, 3b (symbols +) show the phonation threshold pressure and frequency when the first ten modes were included, other conditions remaining the same (i.e., zero damping). As the medial surface thickness increased, a switch in phonation onset between modes occurred from synchronization between the first and second modes to that between the fourth and fifth modes. This mode switching occurred because, for the fourth and fifth modes, the frequency spacing decreased significantly as T increased, while the coupling strength stayed higher than that between the first and second modes. Note that, in this case after the switching, the phonation threshold pressure did not vary monotonically with the onset frequency, due to the opposite trends of the frequency spacing and the coupling strength with increasing medial surface thickness T.
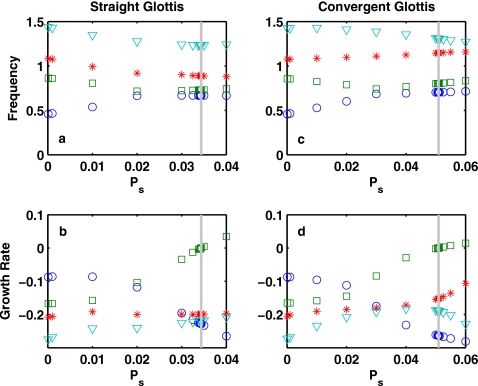
A less obvious effect of inclusion of higher-order modes is demonstrated in Fig. 4. Figure 4 shows that mode synchronization is affected by the presence of other modes. To illustrate this effect, a structural damping of σ=0.4 was used, and Eq. 2 was solved with the first ten modes included. The two cases in Fig. 4 had the same model parameter values except the divergence angle was different: one was 0° (straight glottis) and the other −5° (convergent glottis). For the straight-glottis case, due to the influence of the third eigenmode, the phonation threshold pressure was much lower than that in the convergent-glottis case, even though phonation onset in both cases occurred due to the synchronization between the first and second eigenmodes. Note that the frequencies of the first and second eigenmodes approached each other but did not merge. This was caused by the introduction of structural damping which prevents the exact merging of the two eigenmodes (Kuznetsov, 2004). However, the underlying mechanism still remained to be the coupled-mode flutter between the two modes (Zhang et al., 2007).
Figure 4.
Frequency (top) and growth rate (bottom) of the first four modes of the coupled system as a function of the subglottal pressure, for vocal folds with a straight glottis (left column) and a convergent glottis (right column). The vertical line indicates the point of onset. T=0.3, g0=0.01, σ=0.4, and other parameters are given by Eq. 16. Equation 2 was solved with the first ten modes included. Interaction between the first three modes helped to lower the phonation threshold pressure in the straight-glottis case.
Effects of glottal opening
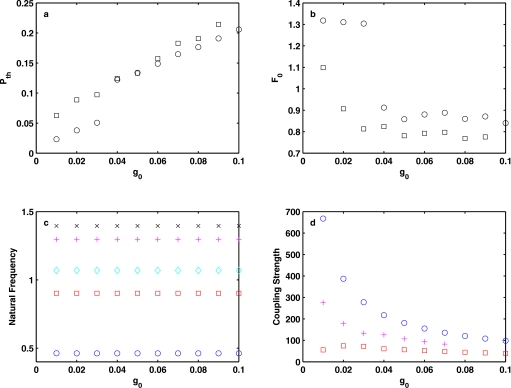
Equations 12, 7 show that increasing glottal opening reduces coupling strength, which generally raises phonation threshold pressure. Figure 5 shows the phonation threshold pressure and frequency as a function of the resting glottal half-width for a convergent glottal geometry (α=−5°, T=0.5). The glottal half-width was varied from 0.01 to 0.1, which corresponds to a range between 0.2 and 2 mm glottal openings for a 10 mm vocal fold thickness at the lateral base. The results (circle symbols) were obtained by solving Eq. 3 with the first ten modes included. Figure 5a shows that phonation threshold pressure increased with increasing glottal half-width, due to the reduced coupling strength. However, Fig. 5d shows that the degree of this reduction effect was eigenmode dependent: it was the largest for the coupling strength between the first and second eigenmodes, and much smaller for the coupling strength between the second and third eigenmodes. This is because that the glottal half-width g0 (through the variable Hs) also appears in the numerator of Eq. 7 as a weighting coefficient inside the integral. Due to this differential reduction effect on coupling strength, a mode switching was observed as the glottal opening was increased. For small glottal half-widths (g0<0.04), phonation onset still occurred as the fourth and fifth eigenmodes were synchronized, consistent with the results in Sec. 3B. For larger values of the glottal half-width, phonation onset occurred due to the synchronization of the second and third eigenmodes as the coupling strength between the fourth and fifth eigenmodes was reduced at a much faster rate than that between the second and third eigenmodes.
Figure 5.
(a) Phonation threshold pressure Pth and (b) phonation onset frequency F0 as a function of the resting glottal half-width g0. In (a) and (b), the symbol ○ denotes results obtained when Eq. 6 was solved with two modes only and no damping; ◻ denotes results obtained when Eq. 2 was solved with the first ten modes included and with a structural loss factor σ=0.4. (c) Natural frequencies of the first five modes (in ascending order) of the vocal fold structure as a function of the resting glottal half-width g0. (d) Coupling strength between the first and second modes (○), second and third modes (◻), and fourth and fifth modes (+) as a function of the glottal half-width g0. A convergent geometry was used with α=−5° and T=0.5. Coupling strengths for other pairs of modes were either negative or complex and are not shown.
When damping was included (square symbols in Figs. 5a, 5b), phonation onset occurred at the second and third eigenmodes even for the range of small glottal half-widths for which phonation occurred at the fourth and fifth eigenmodes when no damping was included, due to a penalizing effect of the specific structural damping model used in this study (see further discussion in Sec. 3D).
Effects of damping
In the simulations presented below, a proportional structural damping was assumed for the vocal fold material so that the structural damping and mass matrices were related by
| (17) |
where σ is the constant structural loss factor and ω is the angular frequency.
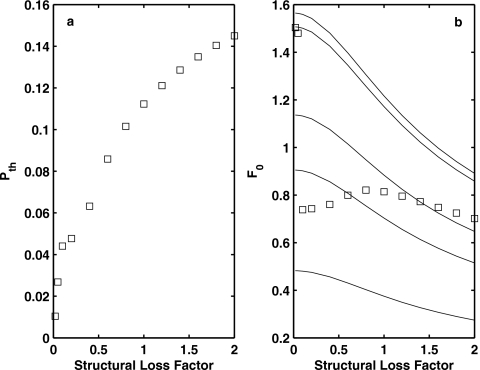
When structural damping is included, phonation onset is generally delayed to a higher threshold pressure, as more energy is needed to overcome the extra structural dissipation. Figure 6 shows the phonation threshold pressure and frequency as a function of the structural loss factor for a convergent glottis (α=−5°, T=0.3). Equation 2 was solved with the first ten modes included. The value of the loss factor was varied from 0 to 2.0, which roughly covers the physiological range as measured by Chan and Rodriguez (2008) and Chan and Titze (1999). Due to increasing dissipation, phonation threshold pressure increased with increasing structural loss factor [Fig. 6a].
Figure 6.
Phonation threshold pressure (left) and onset frequency (right) as a function of the structural loss factor σ, for a convergent vocal fold geometry (α=−5°). T=0.3, and other parameters are given by Eq. 16. Equation 2 was solved with the first ten modes included. The solid lines in Fig. 6b denote the first five eigenfrequencies (in ascending order) of the damped vocal fold structure.
Figure 6 also shows that, for small values (σ=0.1–0.3) of the structural loss factor, phonation onset occurred due to the synchronization between the first and second eigenmodes, instead of between the fourth and fifth as discussed above in Sec. 3B and Fig. 3. This is because that, for the type of damping used in this study [a constant loss factor as in Eq. 17], dissipation increases linearly with frequency so that higher-order modes need to overcome more dissipation to reach onset. In other words, the structural damping tends to delay the onset of higher-order modes more than lower-order modes. As a result, the synchronization between the first and second eigenmodes was able to reach onset at a lower subglottal pressure than that between the fourth and fifth modes, causing a sudden decrease in phonation onset frequency with increasing structural loss factor [Fig. 6b].
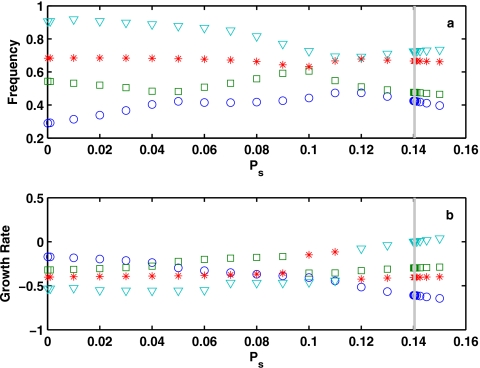
However, the inclusion of structural damping does not completely rule out the possibility of phonation onset at higher-order modes. Figure 6 shows that, as structural damping increased, phonation onset gradually changed to involve the third and even the fourth eigenmodes for a loss factor as large as 2.0. Indeed, for large values of structural loss factor, phonation onset often involved the interaction between more than two eigenmodes, as shown in Fig. 7 for a condition of T=0.3 and σ=1.8. Note that, as different modes were involved in phonation onset, vocal fold vibration patterns were quite different between the case of σ=2.0 and the case of σ=0.1, although the phonation onset frequency was similar for these two cases.
Figure 7.
Frequency (top) and growth rate (bottom) of the first four modes of the coupled system as a function of the subglottal pressure, for vocal folds with a convergent glottis. α=−5°, T=0.3, σ=1.8, and other parameters are given by Eq. 16. Equation 2 was solved with the first ten modes included. The vertical line indicates the point of onset. Phonation onset at large values of the structural loss factor often involves the interaction between more than two modes.
To compare with the prediction from the two idealized cases discussed in Secs. 3A, 3B, Figs. 3a, 3b (square symbols) also show the phonation threshold pressure and frequency obtained for a loss factor σ=0.4. Compared to the two idealized cases, phonation threshold pressure in this case was consistently higher, due to the inclusion of structural damping. In the lower end of the range of medial surface thickness, phonation onset occurred as the first and second modes were synchronized. This is similar to the case when only two modes and no damping were considered, but for a much larger range of T. For large values of T, phonation onset occurred as the second and third modes were synchronized. This is different from either one of the two idealized cases, demonstrating the effects of both higher-order modes (Sec. 3B, more than one pair of modes being synchronized) and damping (Sec. 3D).
DISCUSSION AND CONCLUSIONS
In Zhang et al. (2007), a scaling relation between the phonation threshold pressure and the in vacuo eigenfrequencies of the vocal fold structure was proposed by requiring a balance or matching between the structural stiffness and the flow-induced stiffness. In this study, Eq. 12 further clarifies that it is the frequency spacing rather than the absolute eigenfrequencies or stiffness of the vocal fold (although the frequency spacing does generally increase with increasing stiffness) that determines phonation onset. Indeed, as shown in Sec. 2D, a complete matching between the vocal fold stiffness and the flow-induced stiffness would lead to static divergence, rather than flutter instability of the coupled airflow-vocal fold system. Clinically, this suggests that one of the goals of phonosurgery would be to reduce the frequency spacing and enhance coupling between the first few eigenmodes of the vocal fold structure, by either changing the stiffness differential between different layers of the vocal folds, modifying the vocal fold geometry, or a combination of both. Although the final synchronization pattern and phonation threshold depend on other biomechanical properties, calculation of the frequency spacing and coupling strength does provide a quick and direct evaluation of how such changes in vocal fold biomechanics would affect mode synchronization. Both the frequency spacing and the coupling strength depend mainly on the natural modes of the vocal fold structure, which can be easily calculated for given vocal fold geometry and stiffness. Such calculations may be able to provide a first-order evaluation of the possible treatment options in phonosurgery, when detailed information of the vocal fold biomechanical properties is not available.
This study also shows that, as more than one pair of modes is synchronized by the glottal flow, changes in vocal fold biomechanical properties may change the relative dominance between different pairs of modes and cause phonation onset to occur at a different mode (Sec. 3B, 3C; also see Zhang, 2008, 2009). Similar concept of mode-switching has been used by Tokuda et al. (2007) to explain the abrupt chest-falsetto register transitions in excised larynx experiments. Due to the coupled-mode-flutter nature of phonation onset, the presence of structural damping and large glottal opening delays but does not seem to completely rule out the possibility of phonation onset at higher-order modes and therefore mode switching as observed in this study. Experiments are currently under way to verify these predictions. On the other hand, the excitation of higher-order modes and the mode-switching possibility suggest that a complete and accurate description of vocal fold biomechanical properties is needed to determine the final synchronization pattern and obtain an accurate prediction of phonation threshold pressure and frequency. For phonation modeling, this also suggests that higher-order modes need to be included, in particular, for small glottal openings and large structural dampings for which phonation onset often involves interaction among more than two modes, as shown in Fig. 7.
Although this study considered geometric changes in the vocal folds, changes in synchronization pattern can be equally induced by stiffness changes (Zhang, 2009), or a combination of both, all of which affect the frequency spacing and coupling strength, and therefore phonation threshold. This multivariable dependence of phonation threshold implies that it may be unrealistic to expect a simple relationship between phonation threshold pressure and onset frequency in experiments in which biomechanics of the vocal folds and their variations are either not controlled or unknown. This includes, for example, measurement of phonation threshold pressure and frequency in human subjects, in which it is impossible to control or monitor “the subtle vocal fold posturing or other performance variables in participating humans” (Solomon et al., 2007). This is particularly the case when mode switching as shown in this study is involved. Indeed, in our simulations, phonation threshold pressure was observed to be able to increase, decrease, or stay approximately constant with increasing phonation onset frequency, depending on which biomechanical property was varied in the simulations.
On the other hand, this multivariable dependence also suggests that experimental results should be interpreted with caution. For example, this study shows that an increase in medial surface thickness T led to an increase in phonation threshold pressure. Preliminary experiments in our laboratory using a rubber physical model (Zhang et al., 2006) and implementing the exactly same geometric changes confirmed this prediction. This seems to contradict with the prediction of Eq. 1 and experimental observation by Chan et al. (1997). This discrepancy is likely due to the multivariable dependence of phonation threshold: phonation threshold pressure may vary differently with the medial surface thickness T if changes in T were achieved in different ways (e.g., using different geometric control parameters or different body-cover layer configurations). In this study, variation in the medial surface thickness T was achieved by varying the glottal entrance angles of the body and cover layers, while keeping other control parameters constant. The physical model used in Chan et al. (1997) is quite different from the geometries used in this study. Such differences in models used may at least partially contribute to the discrepancy here. Further experiments are needed to clarify this discrepancy.
The simulations of this study were obtained with some assumptions made to simplify the underlying physics (Zhang et al., 2007). These include neglecting viscous loss in the airflow model, which is expected to play an important role for small glottal openings. For normal phonation, the larynx is often postured so that the two vocal folds are at least partially in contact. Future work will include modeling these effects and experimental validation of the results of this study.
ACKNOWLEDGMENTS
This study was supported by research Grant Nos. R01 DC009229 and R01 DC003072 from the National Institute on Deafness and Other Communication Disorders, the National Institutes of Health, and a UCLA Faculty Research Grant.
References
- Auregan, Y., and Depollier, C. (1995). “Snoring: Linear stability analysis and in-vitro experiments,” J. Sound Vib. 188, 39–53. 10.1006/jsvi.1995.0577 [DOI] [Google Scholar]
- Chan, R., Titze, I. R., and Titze, M. (1997). “Further studies of phonation threshold pressure in a physical model of the vocal fold mucosa,” J. Acoust. Soc. Am. 101, 3722–3727. 10.1121/1.418331 [DOI] [PubMed] [Google Scholar]
- Chan, R. W., and Rodriguez, M. L. (2008). “A simple-shear rheometer for linear viscoelastic characterization of vocal fold tissues at phonatory frequencies,” J. Acoust. Soc. Am. 124, 1207–1219. 10.1121/1.2946715 [DOI] [PMC free article] [PubMed] [Google Scholar]
- Chan, R. W., and Titze, I. R. (1999). “Viscoelastic shear properties of human vocal fold mucosa: Measurement methodology and empirical results,” J. Acoust. Soc. Am. 106, 2008–2021. 10.1121/1.427947 [DOI] [PubMed] [Google Scholar]
- Hirano, M. (1974). “Morphological structure of the vocal cord as a vibrator and its variations,” Folia Phoniatr (Basel) 26, 89–94. 10.1159/000263771 [DOI] [PubMed] [Google Scholar]
- Ishizaka, K., “Equivalent lumped-mass models of vocal fold vibration,” in Vocal Fold Physiology, edited by Stevens K. N. and Hirano M., (University of Tokyo, Tokyo, 1981), pp. 231–244. [Google Scholar]
- Ishizaka, K., “Significance of Kaneko’s measurement of natural frequencies of the vocal folds,” in Vocal Physiology: Voice Production, Mechanisms and Functions, edited by Fujimara O., (Raven, New York, 1988), pp. 181–190. [Google Scholar]
- Kuznetsov, Y. A., Elements of Applied Bifurcation Theory (Springer-Verlag, New York, 2004). [Google Scholar]
- Lucero, J. C., and Koenig, L. L. (2005). “Phonation thresholds as a function of laryngeal size in a two-mass model of the vocal folds,” J. Acoust. Soc. Am. 118, 2798–2801. 10.1121/1.2074987 [DOI] [PubMed] [Google Scholar]
- Lucero, J. C., and Koenig, L. L. (2007). “On the relation between the phonation threshold lung pressure and the oscillation frequency of the vocal folds,” J. Acoust. Soc. Am. 121, 3280–3283. 10.1121/1.2722210 [DOI] [PubMed] [Google Scholar]
- Solomon, N. P., Ramanathan, P., and Makashay, M. J. (2007). “Phonation threshold pressure across the pitch range: preliminary test of a model,” J. Voice 21, 541–550. 10.1016/j.jvoice.2006.04.002 [DOI] [PubMed] [Google Scholar]
- Titze, I. R. (1988). “The physics of small-amplitude oscillation of the vocal folds,” J. Acoust. Soc. Am. 83, 1536–1552. 10.1121/1.395910 [DOI] [PubMed] [Google Scholar]
- Titze, I. R. (1992). “Phonation threshold pressure: A missing link in glottal aerodynamics,” J. Acoust. Soc. Am. 91, 2926–2935. 10.1121/1.402928 [DOI] [PubMed] [Google Scholar]
- Titze, I. R., Schmidt, S., and Titze, M. (1995). “Phonation threshold pressure in a physical model of the vocal fold mucosa,” J. Acoust. Soc. Am. 97, 3080–3084. 10.1121/1.411870 [DOI] [PubMed] [Google Scholar]
- Tokuda, I. T., Horacek, J., Svec, J. G., and Herzel, H. (2007). “Comparison of biomechanical modeling of register transitions and voice instabilities with excised larynx experiments,” J. Acoust. Soc. Am. 122, 519–531. 10.1121/1.2741210 [DOI] [PubMed] [Google Scholar]
- Zhang, Z. (2008). “Influence of flow separation location on phonation onset,” J. Acoust. Soc. Am. 124, 1689–1694. 10.1121/1.2957938 [DOI] [PMC free article] [PubMed] [Google Scholar]
- Zhang, Z. (2009). “Characteristics of phonation onset in a two-layer vocal fold model,” J. Acoust. Soc. Am. 125, 1091–1102. 10.1121/1.3050285 [DOI] [PMC free article] [PubMed] [Google Scholar]
- Zhang, Z., Neubauer, J., and Berry, D. A. (2006). “The influence of subglottal acoustics on laboratory models of phonation,” J. Acoust. Soc. Am. 120, 1558–1569. 10.1121/1.2225682 [DOI] [PubMed] [Google Scholar]
- Zhang, Z., Neubauer, J., and Berry, D. A. (2007). “Physical mechanisms of phonation onset: A linear stability analysis of an aeroelastic continuum model of phonation,” J. Acoust. Soc. Am. 122, 2279–2295. 10.1121/1.2773949 [DOI] [PubMed] [Google Scholar]


