

Abstract
Numerous short peptides have been shown to form β-sheet amyloid aggregates in vitro. Proteins that contain such sequences are likely to be problematic for a cell, due to their potential to aggregate into toxic structures. We investigated the structures of 30 proteins containing 45 sequences known to form amyloid, to see how the proteins cope with the presence of these potentially toxic sequences, studying secondary structure, hydrogen-bonding, solvent accessible surface area and hydrophobicity. We identified two mechanisms by which proteins avoid aggregation: Firstly, amyloidogenic sequences are often found within helices, despite their inherent preference to form β structure. Helices may offer a selective advantage, since in order to form amyloid the sequence will presumably have to first unfold and then refold into a β structure. Secondly, amyloidogenic sequences that are found in β structure are usually buried within the protein. Surface exposed amyloidogenic sequences are not tolerated in strands, presumably because they lead to protein aggregation via assembly of the amyloidogenic regions. The use of α-helices, where amyloidogenic sequences are forced into helix, despite their intrinsic preference for β structure, is thus a widespread mechanism to avoid protein aggregation.
Keywords: amyloid, secondary structure, aggregation, hydrogen-bond, solvent accessibility
Introduction
The formation of fibrillar aggregates, amyloid fibrils or inclusion bodies of amyloid fibrillar material, appears to be a generic property of polypeptide chains. It is believed that many, if not all proteins, can be converted in vitro into amyloid fibrils, given the appropriate conditions.1-5 Regardless of the size, sequence or structure of the amyloid precursor protein, mature fibrils all appear to share a similar highly organised multimolecular morphology.6
More than 40 pathological conditions in humans have so far been attributed to amyloid deposition, amongst which are Alzheimer's, Huntingdon's, and Parkinson's diseases, as well as the transmissible spongiform encephalopathies. In these disease conditions, a specific peptide or protein, which is normally soluble, forms fibril-like aggregates, which eventually become deposited as insoluble fibrils and larger plaques or inclusion bodies.7 Specific mutations have been shown to be the cause for the production of amyloidogenic protein in several disease conditions, but (more) often the protein has the wild-type sequence.
Several proteins unassociated with disease conditions can be induced to form fibrils in vitro.1,2,8-10 In some cases, the aggregates formed from these nondisease-associated proteins have been shown to have cytotoxic properties similar to those of pathological aggregates.11 A diverse group of proteins has been observed to form amyloid-like fibrils having specific physiological functions in nonpathological conditions in a wide range of organisms, such as proteins of the eggshell chorion in the silk moth, spidroin in the spider, Pmel17, which plays a central role melanin-a polmerisation in humans and many more.12-17 Amyloid fibres are found in bacteria, fungi, and insects, exploiting their unique mechanical and biological properties.17 This nonpathological amyloid has been dubbed functional amyloid to distinguish it from the amyloid associated with disease conditions, but from a structural point of view both types of amyloid are the same.16,17
The definitive characteristic of amyloid fibrils formed in all the aforementioned cases is the so-called “cross-β” structure as revealed by X-ray diffraction, in which the polypeptide chain is organised into β-sheets arranged parallel to the longitudinal fibril axis, with constituent β-strands perpendicular to the fibril axis.6,18 Amyloid is also characterised by a high affinity for certain chemical stains such as Congo red and thioflavin (ThT). These staining properties, together with the fibril appearance and characteristic cross-β diffraction pattern are the accepted diagnostic prerequisites for amyloid.18 Solid-state NMR experiments have greatly advanced our knowledge of the structure and stability of amyloid fibrils.19-21
The molecular architecture of fibrils formed by different proteins differs with respect to amount of cross-β structure, strand orientation and disposition of the core amyloid structure within the protein.22 Despite their similar nature, a distinction should be made between amyloid fibril formation and protein aggregation. At high protein concentration under physiological conditions, misfolded protein molecules can form amorphous aggregates. The driving force behind formation of such aggregates, which are often enriched in cross-β structure, is a combination of hydrophobicity, secondary structure propensity and charge.23 β aggregation and amyloidosis often occur together in pathological conditions, leading to the idea that β aggregation is an intermediate step on the pathway to formation of mature amyloid fibrils.23 Furthermore it has been shown amyloid aggregates are polymorphic and that a single polypeptide can fold into multiple amyloid conformations.24 It is now accepted that pre-fibrillar aggregates, rather than mature amyloid plaques, are the cytotoxic elements in protein deposition diseases.25,26
Experiments using very short peptides and larger proteins have attempted to elucidate features of the primary sequence and specific residues, which are responsible for and can be used to predict aggregation and amyloid formation.27-42 Hydrophobicity is an important determinant of the aggregation propensity of a polypeptide chain.32 Examination of sequences in disease-related, amyloidogenic proteins has revealed a higher than expected occurrence of aromatic groups, consistent with the important role of Phe residue side chains in pi-pi stacking in the steric-zipper model of amyloid fibrils.6,43 Statistical studies of natural protein sequences have revealed that groups of three or more hydrophobic residues occur less frequently than would be expected assuming neutral selection, providing evidence that clusters of hydrophobic residues have been selected against during protein evolution.44
The net charge on the protein molecule is an important factor influencing aggregation with a high net charge impeding aggregation.45 Investigations into the effect of mutations altering the charge state of a protein without altering its hydrophobicity or secondary structural propensity showed that aggregation was favoured by those mutations which brought about a reduction in the net charge.11,46,47 Similarly, in vivo experiments have shown that mutations decreasing the positive charge on a molecule increase the aggregation propensity and mutations increasing the net charge result in decreased aggregation.48
Amyloidogenic proteins which are predominantly α-helical, must undergo an α-helix to β-sheet conversion during the formation of amyloid fibrils.27 The tendency to form α helical secondary structure thus mitigates against the tendency to form β-sheet and hence amyloid fibrils.27,49 Conversely, the propensity to form β-sheet secondary structure enhances the chances of amyloid formation.28 In this regard, it is interesting to note that patterns of alternating hydrophobic and hydrophilic residues, which favour formation of β-sheet secondary structure, occur less frequently in natural proteins than would be expected by chance.50 A comparison of the 3D structural models in the Protein Data Bank with secondary structures predicted for the same proteins by various algorithms has shown that about 3% of known protein structures contain an α-helix of seven residues or more for which the prediction algorithm suggests a β-strand.27 While such regions may be due to errors in secondary structure prediction algorithms, such discordant α-helices have been verified experimentally in some cases. They are seen to occur in the prion protein (positions 179–191), the β-amyloid peptide (positions 16–23) and the lung surfactant protein (positions 12–27), as well as several proteins which although not known to be amyloidogenic in vivo, have been found to produce fibrils in vitro.27 There thus seems to be a correlation between α-helix/β-strand discordant stretches and amyloid fibril formation. Discordant helices may be starting points for α-helix to β-sheet conversion; their modulation so as to tip the balance toward α-helix propensity and away from β-strand propensity, reduces the likelihood of fibril formation.27,49
Amyloidogenic sequences tend to lack Pro and Gly, presumably as they are destabilizing in β structure.51 Conservation of glycine and proline residues at structurally strategic positions in β-sandwich proteins appears to serve the purpose of aggregation prevention. Experiments with de novo peptides and proteins as well as with mutated forms of naturally occurring proteins, have elucidated features of polypeptide sequence which inhibit aggregation and fibril formation—so-called “negative design” features.52–54 The term “structural gatekeeper” was coined by Otzen et al55 to describe charged side chains that prevent aggregation by interrupting contiguous stretches of hydrophobic residues in the primary sequence. A systematic survey of edge strands in a large sample of all-β proteins revealed several features which would prevent further β-sheet interactions via main chain hydrogen-bonding, such as β-bulges, proline residues, very short edge strands, tertiary contacts with loop regions and charged residues occurring in positions unfavourable for further strand interaction.53 Edge-to-edge aggregation in naturally occurring β-sandwich proteins is also prevented by placing an “inwardly-pointing” charged residue on the hydrophobic side of a β-strand; just one residue in the edge strand is sufficient to block aggregation. In β-barrel proteins, unsatisfied hydrogen bonds are minimised: there are no edge strands. Unsatisfied hydrogen bonds render β strands susceptible to aggregation.
Structural studies as well as in vitro studies with proteolytic fragments of amyloidogenic proteins and synthetic peptides, have established that the tendency for a protein to form amyloid is often limited to a short sequence of the full protein, known as a “self-recognition element” (SRE). SREs constitute the core peptide of amyloid fibrils in steric-zipper structures.56,57 Such amyloidogenic sequences constitute “hot spots” for aggregation of the native protein into amyloid fibrils.37 In the case of paired helical filament (PHF) tau, which accumulates in the neurofibrillary tangles characteristic of AD and other neurodegenerative diseases, it has been shown that only three residues, VYK, are sufficient for fibril formation.58 Similarly, short sequences forming the core domain of various amyloid fibrils have been identified, amongst which are KLVFFAE for β-amyloid,59 NFGSVQ for medin,60 DFNKF for calcitonin,61,62 FGAIL and NFGAIL for islet amyloid polypeptide,63 VEALYL and LYQLEN for insulin57 and VAQKTV for α-synuclein.64 It may be possible to delete residues freely on either side of an SRE while retaining the ability for form amyloid.
The object of this study is to structurally investigate the ways in which native proteins containing “dangerous” amyloidogenic stretches have evolved to avoid aggregation and amyloid formation. Amyloidogenic stretches can potentially be identified in several ways, such as regions associated with mutations leading to amyloid formation and the results of programs designed to predict amyloidogenic sequences. The amyloidogenic stretches that we study are those of peptides that have been shown to form amyloid in isolation. This data set is more reliably known to form amyloid than one derived from prediction programs that will inevitably lack some accuracy, or one using regions where amyloid formation may result from reasons not directly evident in a protein structure, such as perturbing protein trafficking. These sequences have an intrinsic preference to form amyloid. If they are present in a native protein, it will have had to evolve structural features to prevent the amyloidogenic sequence forming an SRE and causing protein aggregation. Discovering how protein structures deal with such “toxic sequences” is the goal of this work.
Amyloid has a common structure composed of extended β-sheets with hydrogen-bonding parallel to the fibril axis. Amyloidogenic peptides therefore must have an intrinsic tendency to adopt β structure. One might thus expect that amyloidogenic peptides will usually be found in β-sheets within proteins. Remarkably, we found that this was not the case.
Results
Data set
Amyloidogenic proteins were found by surveying the literature and review articles.10,14,56 For proteins to be classified as amyloidogenic, they must have been found in amyloid deposits in vivo or have been shown to form amyloid fibrils experimentally in vitro, either in their entirety or as fragments. Amyloidogenic proteins included in this study were those for which the presence of discrete sequences capable of amyloid fibril formation had been confirmed by transmission EM in combination with Congo red staining, ThT fluorescence or a cross-β X-ray diffraction pattern. In the case of transthyretin, amyloid fibril formation of the sequence (105)YTIAALLSPYS(115) had been shown by magic angle spinning NMR (Jaroniec et al, 2004). In addition to evidence of fibril formation, the existence of an accurate 3D model of the native protein deposited in the PDB was essential. Structural models for proteins were initially found by a combination of text searches of the PDB and PDBsum databases as well as by using the “Search by sequence” tool of the PDBsum database65,66 entering as query sequence amyloidogenic fragments gathered from the primary survey. Subsequently, Perl programs were applied to carry out sequence identity searches of all sequence files representing the PDB database, (downloaded from the PISCES website: http://dunbrack.fccc.edu/PISCES.php67) with each of the amyloidogenic fragments gathered from the primary survey, resulting in the detection of 10 more proteins for inclusion in the study. These are the Bacillus subtilis “YjcG” protein (LYQLEN), the Methanococcus jannaschii tRNA endonuclease (LVEALYL), DNA polymerase III subunit alpha, from Escherichia coli (GGVVIA), chains N and 2 of the 20S proteasome from Bos taurus (GGVVIA), enterotoxin k from Staphylococcus aureus (DFNKF), the Na+/Ca2+-exchange protein 1 from Canis familiaris (NFLVH), chains A and D of cytochrome b from Rhodobacter sphaeroides (FGAIL), human cystolic thymidine kinase (FGAIL), glycyl-tRNA synthetase from Thermus thermophilus (IKVAV) and the leucine-binding protein from E.coli (IKVAV). These proteins, although not previously reported as fibril-forming, face an identical problem in dealing with their amyloidogenic peptides, and it is therefore appropriate to include them in our analysis. The amyloidogenic fragment IKVAV was also found in chain H of the 60S ribosome from Saccharomyces cerervisiae, but this protein was not included in the study owing to its large size: a 30-mer of molecular mass 1513 kDa. Thirty native proteins were identified for analysis using the search methods described (Table I).
Table I.
Proteins of Which Peptide Fragments have been Shown to Form Amyloid Fibrils In Vitro and for Which a 3D Structural Model Is Available
| Protein | UniProt ID | PDB ID of 3D structural model for proteina | Amyloidogenic sequence(s)/peptide(s) | Location in native mature protein sequence | References |
|---|---|---|---|---|---|
| α-Synuclein | P37840 | 1XQ8a | (68)GAVVTGVTAVA(78) | 68–78 | 68 |
| (51)GVATVA(56) | 51–56 | 57 | |||
| (66)VGGAVVTGV(74) | 66–74 | ||||
| (86)GSIAAAT(92) | 86–92 | ||||
| (71)VTGVTAVAQKTV(82) | 71–82 | 69,70 | |||
| (77)VAQKTV(82) | |||||
| NAC peptide: α-syn(61–95) | 61–95 | 71 | |||
| β-Lactoglobulin | P02754 | 1BEB | (11)DIQKVAGTWY(20) | 11–20 | 72 |
| (101)KYLLFCMENS(110) | 101–110 | ||||
| (116)SLVCQCLVRTP(126) | 116–126 | ||||
| (146)HIRLSFN(152) | 146–152 | ||||
| β2-Microglobulin | P61769 | 1B0G | (20)SNFLNCYVSGFHPSDIEVDLLK(41) | 20–41 | 73 |
| (58)KDWSFY(63) | 58–71 | 74,75,57 | |||
| (59)DWSFYLLYYTEFT(71) | |||||
| (62)FYLLYY(67) | |||||
| (64)LLYYTE(69) | |||||
| (83)NHVTLS(88) | 83–89 | ||||
| (83)NHVTLSQ(89) | |||||
| (91)KIVKWD(96) | 91–96 | ||||
| Acylphosphatase, human muscle | P14621 | 1APSa,b | (16)RVQGVCFRMYTEDEAR(31)b | 16–31 | 28,46,76 |
| (87)SKLEYSNFSIRY(98)b | 87–98 | ||||
| Amphoterin, rat | P63159 | 1CKT | (12)MSSYAFFVQTCREEHK(27) | 12–27 | 77 |
| Apolipoprotein C-II | P02655 | 1SOH | (60)MSTYTGIFTDQ(70) | 60–70 | 22 |
| Cold shock protein, cspB, Bacillus subtilis | P32081 | 2ES2 | (1)MLEGKVKWFNSEKGFGFIEVEG(22) | 1–22 | 78,79 |
| (1)MLEGKVKWFNSEKGFGFIEVEGQDDVFVHFSAIQG(35) | 1–35 | ||||
| (36)EGFKTLEEGQAVSFEIVEGNRGPQAANVTKEA(67) | 36–67 | ||||
| Gelsolin | P06396 | 1KCQ | (182)SFNNGDCFILD(192)c | 182–192 | 80,81 |
| Human complement receptor type 1 | P17927 | 1GKG | (1038)STNRENFHYGSVVTYRS(1054)d | 1038–1054 | 82 |
| Insulin | P01308 | 1XDA | A chain: (13)LYQLEN(18)e | A:13–18 | 75,57 |
| B chain: (11)LVEALY(16)e | B:11–17 | ||||
| B chain: (12)VEALYL(17)e | |||||
| Kerato-epithelin | Q15582 | 1X3Ba | (515)FSMLVAAIQSA(525)f | 515–532f | 83 |
| (515)FSMLVAAIQSAGLTETLN(532)f | |||||
| Lactoferrin | P02788 | 1LFH | (538)NAGDVAFV(545) | 538–545 | 84 |
| Laminin alpha-1 chain, G-like domain, mouse | P19137 | 2JD4 | (2919)SAKVDAIGLEIV(2930) | 2919–2930 | 85 |
| Lysozyme, human | P61626 | 1REX | (56)IFQINS(61) | 56–61 | 86,57 |
| 26–123 | |||||
| 32–108 | |||||
| Medin (a proteolytic fragment of human lactadherin)g | Q08431 | 3BN6g | (299)VTGIITQGAR(308)g | 299–308g | 87 |
| (309)NFGSVQ(314)g | 309–316g | 60,88 | |||
| (309)NFGSVQFV(316)g | |||||
| Myoglobin, horse heart | P68082 | 1WLA | (1)GLSDGEWQQVLNVWGKVEADIAGHGQEVL(29) | 1–29 | 89 |
| (101)IKYLEFISDAIIHVLHSK(118) | 101–118 | 3 | |||
| Prion protein, human, hPrP | P04156 | 1QLX | (113)AGAAAAGAVVGGLGG(127)h,i | 113–127h,i | 90 |
| (132)SAMSRPIIHFGSDYEDRYYRENMHRYPNQ(160)i | 132–160i | 91 | |||
| (138)IIHFGSD(144)i | 138–144i | 57,92 | |||
| (170)SNQNNF(175)i | 170–175i | 57 | |||
| (178)DCVNITIKQHTVTTTT(193)i | 178–193i | 93 | |||
| Prolactin | P01236 | 1RW5 | (7)GAARCQVTLRDLFDR(21) | 7–21 | 94 |
| (20)DRAVVLSHYIHNLSS(34) | 20–34 | ||||
| (43)RYTHGRGFITKAINS(57) | 43–57 | ||||
| RepA of Pseudomonas pPS10 plasmid | Q52546 | 1HKQ | (26)LVLCAASLI(34)j | 26–34 | 95 |
| Transthyretin | P02766 | 1TTA | (105)YTIAALLSPYS(115) | 105–115 | 96,97 |
| The following proteins were found to contain fibril-forming peptides present in previously-characterised amyloidogenic proteinsk: | |||||
| “YjcG” protein, B. subtilis | O31629 | 2D4G | (151)LYQLEN(156) | 151–156 | 57,75 |
| tRNA splicing endonuclease, Methanococcus jannaschii | Q58819 | 1A79 | (47)LVEALYL(53) | 47–53 | |
| DNA polymerase III subunit alpha, Escherichia coli | P10443 | 2HNH | (513)GGVVIA(518) | 513–518 | 57 |
| 20S proteasome Bos taurus (Chains N and 2) | P33672 | 1IRU | (18)GGVVIA(23) | 18–23 | |
| Enterotoxin, Staphylococcus aureus | Q5HHK0 | 2NTT | (50)DFNKF(54) | 50–54 | 61,62 |
| Na+/Ca2+-exchange protein 1, Canis familiaris | P23685 | 2DPK | (455)NFLVH(459) | 455–459 | 98 |
| Cytochrome b Rhodobacter sphaeroides | Q02761 | 2QJP | (337)FGAIL(341) | 337–341 | 63,99 |
| Thymidine kinase, cystolic, human | P04183 | 1W4R | (133)FGAIL(137) | 133–137 | |
| Glycyl-tRNA synthetase, Thermus thermophilus | P56206 | 1ATI | (399)IKVAV(403) | 399–403 | 100,101 |
| Leucine-binding protein, E. coli | P04816 | 1USG | (3)IKVAV(7) | 3–7 | |
Indicates that this is the only suitable model available for the amyloidogenic protein.
1APS is a structural model for equine muscle acylphosphatase, which shares 94% sequence identity with human muscle acylphosphatase. The human sequence, (16)RVQGVCFRMYTEDEAR(31), is (16)RVQGVCFRMYAEDEAR(31) in 1APS; the human sequence (87)SKLEYSNFSIRY(98) is (87)SKLEYSNFSVRY(98) in 1APS.
The 11-peptide containing the mutation D187N has a greatly increased tendency to form amyloid fibrils compared to the peptide with the wild-type sequence with Asp187.80
The native sequence in 1GKG has Cys1054; Ser1054 is reported for the synthetic, fibril-forming peptide.82
The amyloidogenic sequence LVEALYL also occurs the tRNA splicing endonuclease from Methanococcus jannaschii (47)LVEALYL(53), structural model PDB ID:1A79; the amyloidogenic sequence LYQLEN also occurs in the B. subtilis ‘yjcG’ protein (151)LYQLEN(156), structural model PDB ID:2D4G.
Numbering includes 23-residue signal sequence. Amyloidogenic sequence spans Phe21-Asn38 in 1x3B.
The model 3BN6 is bovine lactadherin C2 domain, which shares 70% SID with human lactadherin of which residues 268–317 are medin. Residues Val70-Val87 in 3BN6 are equivalent to the amyloidogenic sequence in human medin between residues 299–316. The human sequence (299)VTGIITQGAR(308) is identical in 3BN6; the human sequence, (309)NFGSVQFV(316), is (80)DFGHIQYV(87) in 3BN6.
Only (125)LGG(127) of this amyloidogenic peptide are represented in structural model 1QLX, the first residue of which is Leu125.
Numbering includes 22-residue signal sequence.
The peptide containing the mutated residue, Val31 is highly amyloidogenic, the wild-type sequence containing Ala31 is amyloidogenic but to a lesser degree.95
Structural models were found by using a Perl program to search the Protein Data Bank for sequences identical to known amyloidogenic peptides (Methods).
In the case of acylphosphatase (AcP) and medin, amyloidogenicity was originally reported for the human proteins in each case.28,46,60,88,76 Since no structural model was available for the human proteins, but there were structural models available for the homologous proteins equine muscle AcP: PDB ID 1APS and bovine medin: PDB ID 3BN6, the latter were taken for analysis. Measurements of relative accessible surface area, secondary structure and hydrogen-bond density were carried out on these structures, whose sequences differ slightly from the original amyloidogenic proteins. Equine muscle AcP shares 94% sequence identity with human muscle AcP. The human AcP amyloidogenic sequence, (16)RVQGVCFRMYTEDEAR(31), is (16)RVQGVCFRMYAEDEAR(31) in 1APS; the human AcP amyloidogenic sequence (87)SKLEYSNFSIRY(98) is (87)SKLEYSNFSVRY(98) in 1APS. Human medin is a proteolytic fragment of human lactadherin, which shares 70% sequence identity with bovine lactadherin. 3BN6 is a structural model of the C2 domain of bovine lactadherin with residues V70-V87 matching the amyloidogenic sequence V299-V316 in human medin. The human amyloidogenic sequence (299)VTGIITQGAR(308) is identical in 3BN6; the human amyloidogenic sequence, (309)NFGSVQFV(316), is (80)DFGHIQYV(87) in 3BN6.
Nonoverlapping amyloidogenic fragments greater than 20 amino acid residues in length were excluded from the amyloidogenic category, in order to reduce the probability of including non-amyloidogenic residues. Thus, the 20–41 peptide of β2-microglobulin, the 36–67 peptide of B. subtilis cspB, and the 1–29 amyloidogenic fragment of myoglobin, were considered non-amyloidogenic in the calculations. For pairs of overlapping fibril-forming peptides longer than 20 amino acid residues, the shorter was taken, hence the 1–22 peptide of B. subtilis cspB was considered representative. For any group of overlapping fibril-forming fragments less than 20 amino acids in length, one composite sequence including all amino acid residues observed in individual amyloidogenic sequences was taken as representative of the group. Where a sequence contained a shorter amyloidogenic peptide, the latter was taken as representative. Thus, the 106–147102 and the 132–16091 peptides of the human prion protein (hPrP) are represented by the shorter 138–144 peptide reported in Sawaya et al (2007).57 For kerato-epithelin, the shorter 515–525 peptide was taken as representative.83 Similarly, the composite 66–92 amyloidogenic sequence for α-synuclein which forms part of the α-synuclein 61–95 NAC peptide71 is represented by the three shorter 66–74, 77–82, and 86–92 peptides57,71,70 (Table I).
Secondary structure
Table II shows the secondary structure of each protein under consideration, subdivided into the amyloidogenic and non-amyloidogenic parts of each structure. Percentages of residues that are helix, strand, or coil are given for each region. The mean values given in Table II are of 30 values, one per protein, for secondary structure in non-amyloidogenic sequences, and of 45 values, for secondary structure in each of 45 discrete amyloidogenic sequences. We find that 35% of residues in amyloidogenic regions are helical compared to only 28% in non-amyloidogenic regions. This preference is at the expense of coil, rather than strand, as 34% of residues in amyloidogenic regions are in strand compared to 28% in non-amyloidogenic regions, while 31% of amyloidogenic regions are coil, compared to 44% of non-amyloidogenic regions. Mann-Whitney tests show that while these differences in helix and strand frequencies are not significant, the difference in coil preferences is (P = 0.0008). These results for proteins and amyloidogenic sequences considered individually are consolidated by calculations for pooled residues (577 amyloidogenic, 15,659 non-amyloidogenic) from all 30 proteins, which show that 35% of amyloidogenic residues are helical compared to 31% in non-amyloidogenic regions, 36% of amyloidogenic residues are strand compared to 29% in non-amyloidogenic regions, and 30% of amyloidogenic residues are coil compared to 40% in non-amyloidogenic regions (Table III). There is therefore a clear trend for amyloidogenic sequences to be helical or strand structure, rather than coil. This is perhaps surprising, since in isolation the amyloidogenic sequences are all prone to form aggregated β-sheets. This result tallies with that of Linding et al.103 who found that regions predicted to be prone to β aggregation are more common in globular proteins, with high secondary structure content, than in intrinsically disordered proteins. Examples of amyloidogenic sequences in proteins are shown in Figure 1 and Supplementary Information Figure 1.
Table II.
Secondary Structure Distribution in Amyloidogenic and Non-amyloidogenic Sequences
| Number of residues |
Secondary structure distributiona % |
|||||||||
|---|---|---|---|---|---|---|---|---|---|---|
| Protein | PDB ID of protein model | Amyloidogenic sequence(s) | Amyloidogenic | Non-amyloidogenic | Helix (amy) | Helix (nonamy) | Strand (amy) | Strand (nonamy) | Coil (amy) | Coil (nonamy) |
| α-Synuclein | 1XQ8 | 51–56 | 6 | 112 | 100 | 47.3 | 0 | 0 | 0 | 52.7 |
| 66–74 | 9 | 100 | 0 | 0 | ||||||
| 77–82 | 6 | 100 | 0 | 0 | ||||||
| 86–92 | 7 | 100 | 0 | 0 | ||||||
| β-Lactoglobulin | 1BEB | A:11–20 | 10 | 236 | 20 | 11.9 | 40 | 41.5 | 40 | 46.6 |
| A:101–110 | 10 | 0 | 80 | 20 | ||||||
| A:116–126 | 11 | 0 | 72.7 | 27.3 | ||||||
| A:146–152 | 7 | 0 | 85.7 | 14.3 | ||||||
| B:11–20 | 10 | 20 | 40 | 40 | ||||||
| B:101–110 | 10 | 0 | 80 | 20 | ||||||
| B:116–126 | 11 | 0 | 72.7 | 27.3 | ||||||
| B:146–152 | 7 | 0 | 85.7 | 14.3 | ||||||
| β2-Microglobulin | 1B0G | 58–71 | 14 | 72 | 0 | 0 | 71.4 | 52.8 | 28.6 | 47.2 |
| 83–89 | 7 | 0 | 14.3 | 85.7 | ||||||
| 91–96 | 6 | 0 | 83.3 | 16.7 | ||||||
| AcP | 1APS | 16–31 | 16 | 70 | 43.8 | 14.3 | 0 | 48.6 | 56.2 | 37.1 |
| 87–98 | 12 | 0 | 0 | 100 | ||||||
| Amphoterin | 1CKT | 12–27 | 16 | 55 | 87.5 | 61.8 | 0 | 0 | 12.5 | 38.2 |
| ApoC-II | 1SOH | 60–70 | 11 | 56 | 54.5 | 41.1 | 0 | 0 | 45.5 | 58.9 |
| B. subtilis cspB | 2ES2 | 1–22 | 22 | 45 | 0 | 0 | 68.2 | 51.1 | 31.8 | 48.9 |
| Gelsolin | 1KCQ | 182–192 | 11 | 92b | 0 | 25.0 | 72.7 | 29.3 | 27.3 | 45.7 |
| Human complement receptor 1, SRC3 | 1GKG | 1038–1054 | 17 | 119 | 0 | 0 | 29.4 | 34.5 | 70.6 | 65.5 |
| Insulin | 1XDAc | A: 13–18 | 6 | 37 | 100 | 37.8 | 0 | 16.2 | 0 | 46.0 |
| B: 11–17 | 7 | 100 | 0 | 0 | ||||||
| Kerato-epithelin | 1X3B | 515–525 | 11 | 135 | 72.7 | 24.4 | 0 | 16.3 | 27.3 | 59.3 |
| Lactoferrin | 1LFH | 538–545 | 8 | 683 | 0 | 28.7 | 50.0 | 20.2 | 50.0 | 51.1 |
| Laminin | 2JD4c | 2919–2930 | 12 | 363d | 0 | 0.6 | 75.0 | 51.5 | 25.0 | 47.9 |
| Lysozyme | 1REX | 56–61 | 6 | 124 | 16.7 | 33.9 | 0 | 12.9 | 83.3 | 53.2 |
| Medin | 3BN6e | 299–308 | 10 | 140f | 0 | 0 | 90.0 | 49.0 | 10.0 | 51.0 |
| 309–316 | 8 | 0 | 75.0 | 25.0 | ||||||
| Myoglobin | 1WLA | 101–118 | 18 | 135 | 94.4 | 69.6 | 0 | 0 | 5.6 | 30.4 |
| Prolactin | 1RW5 | 7–34 | 28 | 156 | 71.4 | 62.2 | 0 | 0 | 28.6 | 37.8 |
| 43–57 | 15 | 6.7 | 0 | 93.3 | ||||||
| hPrP | 1QLX | 113–127f | 3 | 72 | 0 | 52.8 | 0 | 8.3 | 100 | 38.9 |
| 138–144 | 7 | 14.3 | 0 | 85.7 | ||||||
| 170–175 | 6 | 33.3 | 0 | 66.7 | ||||||
| 178–193 | 16 | 81.2 | 0 | 18.8 | ||||||
| repA, pPS10 Pseudomonas | 1HKQ | 26–34 (dimer) | 9 (×2) | 232 | 77.8 | 34.5 | 0 | 30.6 | 22.2 | 34.9 |
| 33.3 | 0 | 66.7 | ||||||||
| Transthyretin | 1TTA | 105–115 (tetramer) | 11 (×4) | 464 | 0 | 6.0 | 90.9 | 50.0 | 9.1 | 44.0 |
| 0 | 90.9 | 9.1 | ||||||||
| 0 | 90.9 | 9.1 | ||||||||
| 0 | 90.9 | 9.1 | ||||||||
| B. subtilis ‘YjcG’ protein | 2D4G | 151–156 (dimer) | 6 (×2) | 324 | 0 | 27.5 | 67.0 | 35.2 | 33.0 | 37.3 |
| 0 | 67.0 | 33.0 | ||||||||
| M. jannaschii tRNA endonuclease | 1A79 | 47–53 (tetramer) | 7 (×4) | 656 | 100 | 29.0 | 0 | 33.2 | 0 | 37.8 |
| 100 | 0 | 0 | ||||||||
| 100 | 0 | 0 | ||||||||
| 100 | 0 | 0 | ||||||||
| DNA polymerase III subunit alpha, E. coli | 2HNH | 513–518 | 6 | 904 | 0 | 46.2 | 100 | 9.0 | 0 | 44.8 |
| 20S proteasome Bos taurus | 1IRU | 18–23 (Chains N&2) | 6 (×2) | 6273 | 0 | 30.9 | 83.0 | 33.5 | 17.0 | 35.6 |
| 0 | 83.0 | 17.0 | ||||||||
| Enterotoxin, S. aureus | 2NTT | 50–54 (dimer) | 5 (×2) | 424 | 80.0 | 13.7 | 0 | 44.8 | 20.0 | 41.5 |
| 80.0 | 0 | 20.0 | ||||||||
| Na+/Ca2+-exchange protein 1, C. familiaris | 2DPK | 455–459 | 5 | 119 | 0 | 0 | 100 | 61.3 | 0 | 38.7 |
| Cytochrome b, R. sphaeroides | 2QJPc | 337–341 (Chains A&D) | 5 (×2) | 1716 | 100 | 44.6 | 0 | 11.1 | 0 | 44.3 |
| 100 | 0 | 0 | ||||||||
| Thymidine kinase, cystolic, human | 1W4Rc | 133–137 (Chains A,B,C&D) | 5 (×4) | 641 | 40.0 | 26.1 | 20.0 | 36.2 | 40.0 | 37.7 |
| 40.0 | 20.0 | 40.0 | ||||||||
| 40.0 | 20.0 | 40.0 | ||||||||
| 40.0 | 20.0 | 40.0 | ||||||||
| Glycyl-tRNA synthetase, Thermus thermophilus | 1ATI | 399–403 (dimer) | 5 (×2) | 863 | 0 | 27.5 | 60.0 | 33.6 | 40.0 | 38.9 |
| 0 | 60.0 | 40.0 | ||||||||
| Leucine-binding protein, E. coli | 1USG | 3–7 | 5 | 340 | 0 | 43.5 | 100 | 21.8 | 0 | 34.7 |
| Total no. of residues | 16235 | 577 | 15658 | |||||||
| Mean (±SD) | 35 (±42) | 28 (±20) | 34 (±39) | 28 (±19) | 31 (±30) | 44 (±8) | ||||
| P-value (Mann-Whitney test) | 0.60 | 0.76 | 0.0008 | |||||||
Secondary structure distribution according to DeepView: Swiss-PdbViewer.102
There are 104 residues in 1KCQ of which 93 are non-amyloidogenic, but atomic coordinate information is lacking for Val158 and so secondary structure cannot be assigned.
Biological molecule 1 used for analysis.
There are 376 residues in 2JD4 of which 364 are non-amyloidogenic, but atomic coordinate information is lacking for Pro3060 and so secondary structure cannot be assigned to this residue.
The model 3BN6 is bovine lactadherin C2 domain, which shares 70% SID with human lactadherin of which residues 268–317 are medin. Residues Val70–Val87 in 3BN6 are equivalent to the amyloidogenic sequence in human medin between residues 299–316.
Residues 125–127 only are represented in 1QLX.
Table III.
Summary of Secondary Structure and Solvent Accessibilitiesa
| Amyloidogenic sequences | Non-amyloidogenic sequences | ||
|---|---|---|---|
| Hydrogen-bonds per residueb | 1.12 | 1.03 | |
| Accessible surface area per residue (relative) %c | 25.6 | 26.5 | |
| Secondary structure distributiond % | Helix | 34.5 | 30.7 |
| Strand | 36.0 | 29.4 | |
| Coil | 29.5 | 39.9 | |
Values for each characteristic in individual proteins were summed and expressed as an average of the total of 577 amyloidogenic residues and 15,659 non-amyloidogenic residues (16,236 amino acid residues in toto).
Number of hydrogen-bonds per residue estimated by VADAR.83 In the case of the 20S proteasome, only chains N and 2 containing the amyloidogenic sequence and chains interacting through hydrogen-bonds with these were included in the analysis.
Accessible surface area, average relative surface area per residue (%) computed by the NACCESS program.91
Secondary structure distribution (%) according to DeepView: Swiss-PdbViewer.102
Figure 1.
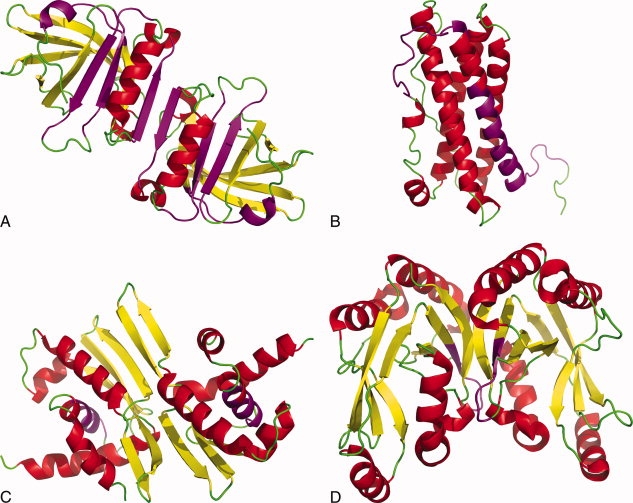
Selection of amyloidogenic proteins in native conformation with amyloidogenic sequences highlighted (amyloidogenic residue numbers in parentheses for given protein model refer to residues considered amyloidogenic for calculations in present study). Biological molecules are illustrated unless otherwise indicated. a) β-lactoglobulin, PDB ID 1BEB (Asp11-Tyr20, Lys101-Ser110, Ser116-Pro126, His146-Asn152), b) prolactin, PDB ID 1RW5 (Gly7-Ser34, Arg43-Ser57), c) repA pPS10 Pseudomonas, PDB ID 1HKQ (Leu26-Ile34), d) B. subtilis ‘YjcG’ protein, PDB ID 2D4G (Leu151-Asn156). Images were created using PyMol (www.pymol.org).
Surface accessibility
Relative solvent accessibilities show the fraction of a residue's surface that is buried compared to the unfolded state. These data were determined for amyloidogenic and non-amyloidogenic sequences. Three different methods were applied in these calculations. Calculations using all residues from all proteins pooled into one dataset for amyloidogenic (577 residues) and one for non-amyloidogenic (15,659 residues) showed a very small difference in relative accessible surface area (RASA) between amyloidogenic (25.6% RASA) and non-amyloidogenic (26.5% RASA) (Table III). Considered on a per protein basis, amyloidogenic residues showed a significantly lower relative accessible surface area (24% RASA) compared to non-amyloidogenic residues (35% RASA), with a P-value of 0.0003. However, when amyloidogenic residues were treated as a set of 45 discrete amyloidogenic sequences, there was no significant difference between amyloidogenic (30% RASA) and non-amyloidogenic (35% RASA) residues in terms of surface accessibility (Table IV). The results thus indicate that when considered as part of their native protein, amyloidogenic sequences have an average surface accessibility, which is lower than non-amyloidogenic sequences. Amyloidogenic regions are thus more likely to be buried in a protein interior.
Table IV.
Hydrogen-Bond Frequency and Accessible Surface Area in Amyloidogenic and Non-amyloidogenic Residues
| Amyloidogenic |
Non-amyloidogenic |
|||||||
|---|---|---|---|---|---|---|---|---|
| Hydrogen-bonds/residuea |
Relative ASA/residueb % |
|||||||
| Protein | PDB ID of protein model | Amyloidogenic sequence(s) | Average for sequence | Average for protein | Average for sequence | Average for protein | Hydrogen-bonds/ residuea | Relative ASA/residueb % |
| α-Synuclein | 1XQ8 | 51–56 | 1.17 | 1.07 | 53.7 | 62.5 | 0.78 | 71.4 |
| 66–74 | 1.33 | 58.5 | ||||||
| 77–82 | 1.00 | 70.6 | ||||||
| 86–92 | 0.71 | 68.3 | ||||||
| β-Lactoglobulin | 1BEB (dimer) | A&B:11–20 | 1.25 | 1.29 | 30.5 | 18.6 | 1.03 | 33.6 |
| A&B:101–110 | 1.55 | 15.4 | ||||||
| A&B:116–126 | 1.14 | 12.7 | ||||||
| A&B:146–152 | 1.00 | 15.3 | ||||||
| β2-Microglobulin | 1B0G | 58–71 | 1.14 | 0.93 | 22.9 | 33.1 | 0.83 | 29.4 |
| 83–89 | 0.87 | 45.5 | ||||||
| 91–96 | 0.50 | 42.5 | ||||||
| AcP | 1APS | 16–31 | 1.13 | 0.89 | 11.4 | 10.6 | 1.20 | 6.60 |
| 87–98 | 0.58 | 9.64 | ||||||
| Amphoterin | 1CKT | 12–27 | 1.38 | 1.38 | 19.4 | 19.4 | 1.13 | 41.8 |
| ApoC-II | 1SOH | 60–70 | 1.09 | 1.09 | 58.8 | 58.8 | 0.93 | 59.9 |
| B. subtilis cspB | 2ES2 | 1–22 | 0.91 | 0.91 | 36.9 | 36.9 | 0.71 | 40.5 |
| Gelsolin | 1KCQ | 182–192 | 1.18 | 1.18 | 5.46 | 5.46 | 0.98 | 39.4 |
| Human complement receptor 1, SRC3 | 1GKG | 1038–1054 | 0.76 | 0.76 | 39.0 | 39.0 | 0.62 | 43.6 |
| Insulin | 1XDAc | A: 13–18 | 1.33 | 1.08 | 49.2 | 44.4 | 0.92 | 47.0 |
| B: 11–17 | 0.86 | 40.4 | ||||||
| Kerato-epithelin | 1X3B | 515–525 | 1.18 | 1.18 | 30.3 | 30.3 | 0.69 | 41.9 |
| Lactoferrin | 1LFH | 538–545 | 0.50 | 0.50 | 13.4 | 13.4 | 1.07 | 27.0 |
| Laminin | 2JD4c | 2919–2930 | 1.08 | 1.08 | 21.6 | 21.6 | 0.91 | 29.4 |
| Lysozyme | 1REX | 56–61 | 1.33 | 1.33 | 4.72 | 4.72 | 1.14 | 34.2 |
| Medin | 3BN6d | 299–308 | 1.20 | 1.17 | 8.00 | 20.2 | 0.94 | 31.8 |
| 309–316 | 1.13 | 35.3 | ||||||
| Myoglobin | 1WLA | 101–118 | 1.06 | 1.06 | 24.9 | 24.9 | 1.23 | 36.0 |
| Prolactin | 1RW5 | 7–34 | 1.25 | 1.05 | 39.8 | 44.1 | 1.01 | 35.6 |
| 43–57 | 0.67 | 52.1 | ||||||
| hPrP | 1QLX | 113–127e | 0.33 | 1.09 | 73.6 | 43.8 | 0.90 | 40.7 |
| 138–144 | 0.86 | 54.2 | ||||||
| 170–175 | 1.50 | 46.5 | ||||||
| 178–193 | 1.19 | 32.7 | ||||||
| repA, pPS10 Pseudomonas | 1HKQ (dimer) | 26–34 | 0.83 | 0.83 | 18.9 | 18.9 | 1.16 | 36.2 |
| Transthyretin | 1TTA (tetramer) | 105–115 | 1.18 | 1.18 | 9.64 | 9.64 | 0.96 | 30.0 |
| B. subtilis ‘YjcG’ protein | 2D4G (dimer) | 151–156 | 1.17 | 1.17 | 26.6 | 26.6 | 0.95 | 32.5 |
| M. jannaschii tRNA endonuclease | 1A79 (tetramer) | 47–53 | 1.46 | 1.46 | 2.86 | 2.86 | 1.06 | 27.2 |
| DNA polymerase III subunit alpha, E. coli | 2HNH | 513–518 | 0.67 | 0.67 | 1.52 | 1.52 | 1.09 | 27.4 |
| 20S proteasome Bos taurus | 1IRU | 18–23 (Chains N&2) | 0.83 | 0.83 | 5.83 | 5.83 | 1.05 | 21.3 |
| Enterotoxin, S. aureus | 2NTT (dimer) | 50–54 | 2.50 | 2.50 | 37.6 | 37.6 | 1.03 | 29.8 |
| Na+/Ca2+-exchange protein 1, C. familiaris | 2DPK | 455–459 | 1.80 | 1.80 | 17.5 | 17.5 | 0.86 | 38.5 |
| Cytochrome b, R. sphaeroides | 2QJPc | 337–341 (Chains A&D) | 1.10 | 1.10 | 25.0 | 25.0 | 1.05 | 27.7 |
| Thymidine kinase, cystolic, human | 1W4Rc | 133–137 (Chains A,B,C&D) | 1.00 | 1.00 | 23.1 | 23.1 | 0.99 | 25.1 |
| Glycyl-tRNA synthetase, Thermus thermophilus | 1ATI (dimer) | 399–403 | 1.40 | 1.40 | 2.11 | 2.11 | 1.10 | 24.3 |
| Leucine-binding protein, E. coli | 1USG | 3–7 | 0.80 | 0.80 | 14.3 | 14.3 | 1.10 | 28.9 |
| Mean (±SD) | 1.09 (±0.37) | 1.13 (±0.37) | 30 (±20) | 24 (±16) | 0.98 (±0.15) | 35 (±12) | ||
Number of hydrogen-bonds per residue estimated by the VADAR program.83
Accessible surface area, average relative surface area per residue (%) computed by the NACCESS program.91
Biological molecule 1 used for analysis.
The model 3BN6 is bovine lactadherin C2 domain, which shares 70% SID with human lactadherin of which residues 268–317 are medin. Residues Val70–Val87 in 3BN6 are equivalent to the amyloidogenic sequence in human medin between residues 299 and 316.
Residues 125–127 only are represented in 1QLX.
Hydrogen-bond density
Table IV shows the numbers of hydrogen bonds per residue for each amyloidogenic sequence, for amyloidogenic regions per protein and for non-amyloidogenic regions for each protein in our data set. As for the solvent accessibility calculations, three different methods were applied. Calculations from pooled residues of all proteins showed that amyloidogenic residues have more hydrogen bonds per residue (1.12) than non-amyloidogenic residues (1.03) (Table III). Expressed on a per protein basis, there are 1.13 hydrogen bonds per residue in amyloidogenic residues compared to 0.98 in non-amyloidogenic residues, a difference of borderline significance (P = 0.057). Expressed as an average per discrete amyloidogenic sequence, amyloidogenic sequences have more hydrogen bonds per residue (1.09) than non-amyloidogenic residues (0.98). The slight trend of higher hydrogen-bond density in amyloidogenic compared to non-amyloidogenic regions can be attributed to the higher likelihood of amyloidogenic regions being in helix or strand which are inherently rich in hydrogen-bonds.
The secondary structure, solvent accessible surface area and hydrogen-bond data in Tables II and IV is averaged as mean values per sequence. Table III gives the same properties averaged per residue, thus giving greater weight to longer sequences and larger proteins. Similar trends are seen: amyloidogenic regions have more hydrogen-bonds, marginally lower solvent accessibility and are more likely to be in helix or strand, at the expense of coil.
Solvent accessible surface areas in helices and sheets
Subdivision of the solvent accessible surface area by secondary structure reveals some clear differences that are obscured when this data is pooled (Tables III and IV). Table V gives surface area data per residue only for residues in strands and Table VI gives the same data for helical residues. The surface areas of residues within amyloidogenic strands are nearly always (15 out of 16 cases) lower than those within non-amyloidogenic strands (11% vs. 20%, respectively), with a significant P-value of 0.0045. In contrast, amyloidogenic residues in helices have similar mean solvent accessible surface areas to non-amyloidogenic helical residues (28% vs. 32%, respectively, with no significant difference (P = 0.49). Table VII summarises the same data on a per residue basis, rather than per strand, as in Tables V and VI. Again, it is clear that amyloidogenic residues within strands have significantly lower surface areas than non-amyloidogenic strand residues, while there is no significant difference between helical residues. This suggests that there is pressure to bury amyloidogenic sequences when in β-strands, while this is not the case for helical amyloidogenic sequences.
Table V.
Comparison of Relative Accessible Surface Area in Amyloidogenic and Non-amyloidogenic β-Strand Residues
| Number of β-strand residuesa |
Average relative ASA per β-strand residueb % |
|||||
|---|---|---|---|---|---|---|
| PDB ID | Amyloidogenic sequence(s) | Amyloidogenic | Non-amyloidogenic | Amyloidogenic | Non-amyloidogenic | |
| β-Lactoglobulin | 1BEB (dimer) | 11–20 | 52 | 98 | 11.3 | 22.0 |
| 101–110 | ||||||
| 116–126 | ||||||
| 146–152 | ||||||
| β2-Microglobulin | 1BOG | 58–71 | 16 | 38 | 27.5 | 20.2 |
| 83–89 | ||||||
| 91–96 | ||||||
| B. subtilis cspB protein | 2ES2 | 1–22 | 15 | 23 | 23.9 | 26.8 |
| Gelsolin | 1KCQ | 182–192 | 8 | 27 | 3.44 | 28.9 |
| Human complement receptor 1 | 1GKG | 1038–1054 | 5 | 41 | 23.5 | 34.2 |
| Lactoferrin | 1LFH | 538–545 | 4 | 138 | 0 | 12.6 |
| Laminin | 2JD4 (biol. mol.1) | 2919–2930 | 9 | 187 | 6.3 | 18.3 |
| Medin | 3BN6 | 299–308 | 15 | 69 | 14.1 | 18.3 |
| 309–316 (70–87 in 3BN6) | ||||||
| Transthyretin | 1TTA (tetramer) | 105–115 | 40 | 232 | 10.6 | 16.4 |
| B. subtilis ‘YjcG’ protein | 2D4G (dimer) | 151–156 | 8 | 110 | 11.7 | 19.6 |
| DNA polymerase III subunit alpha, E. coli | 2HNH | 513–518 | 6 | 81 | 1.52 | 10.6 |
| 20S proteasome Bos taurus | 1IRU | 18–23 (chains N and 2) | 10 | 144 | 0.41 | 11.3 |
| Na+/Ca2+-exchange protein 1, C. familiaris | 2DPK | 455–459 | 5 | 73 | 17.5 | 26.7 |
| Thymidine kinase, cystolic, human | 1W4R | 133–137 (chains A,B,C & D) | 4 | 232 | 8.03 | 15.3 |
| Glycyl-tRNA synthetase, Thermus thermophilus | 1ATI (dimer) | 399–403 | 6 | 294 | 0.50 | 16.4 |
| Leucine-binding protein, E. coli | 1USG | 3–7 | 5 | 74 | 14.3 | 18.1 |
| Mean ± SD | 11 ± 9 | 20 ± 7 | ||||
| t-test, t | −3.20 | |||||
| t-test, df | 27.7 | |||||
| t-test, P-value | 0.0035 | |||||
| Mann-Whitney test, P-value | 0.0045 | |||||
Secondary structure according to DeepView: Swiss-PdbViewer (Guex and Peitsch, 1997).
Accessible surface area (ASA), average relative surface area per residue (%) computed by the NACCESS program (Hubbard and Thornton, 1993).
Table VI.
Comparison of Relative Accessible Surface Area in Amyloidogenic and Non-amyloidogenic Helical Residues
| No. of helical residuesa |
Average relative ASA per helical residueb % |
|||||
|---|---|---|---|---|---|---|
| Protein | PDB ID | Amyloidogenic sequence(s) containing residues in helical conformation | Amyloidogenic | Nonamyloidogenic | Amyloidogenic | Nonamyloidogenic |
| α-Synuclein | 1XQ8 | 51–56 | 28 | 53 | 62.5 | 65.0 |
| 66–74 | ||||||
| 77–82 | ||||||
| 86–92 | ||||||
| β-Lactoglobulin | 1BEB dimer | 11–20c | 4 | 28 | 53.0 | 39.8 |
| AcP | 1APS | 16–31c | 7 | 10 | 13.8 | 7.9 |
| Amphoterin | 1CKT | 12–27 | 14 | 34 | 20.4 | 34.4 |
| ApoC-II | 1SOH | 60–70 | 6 | 23 | 56.3 | 56.1 |
| Insulin | 1XDA(1) | 13–18 | 13 | 14 | 44.4 | 41.4 |
| 11–17 | ||||||
| Kerato-epithelin | 1X3B | 515–525 (21–32 in 1X3B) | 8 | 33 | 33.8 | 35.1 |
| Lysozyme | 1REX | 55–61 | 1 | 42 | 0 | 24.0 |
| Myoglobin | 1WLA | 101–118 | 17 | 94 | 24.3 | 31.1 |
| Prolactin | 1RW5 | 7–34 | 21 | 97 | 27.2 | 25.0 |
| 43–57 | ||||||
| hPrP | 1QLX | 138–144c | 16 | 38 | 34.4 | 37.7 |
| 170–175c | ||||||
| 178–193c | ||||||
| repA pPS10 | 1HKQ dimer | 26–34 | 10 | 80 | 12.2 | 29.2 |
| M. jannaschii tRNA endonuclease | 1A79 tetramer | 47–53 | 28 | 190 | 2.86 | 25.9 |
| Enterotoxin, S. aureus | 2NTT dimer | 50–54 | 8 | 58 | 38.4 | 16.4 |
| Cytochrome b Rhodobacter sphaeroides | 2QJP(1) (Chains A&D) | 337–341 | 10 | 526 | 25.0 | 21.2 |
| Thymidine kinase, cystolic, human | 1W4R (Chains A,B,C&D) | 133–137 | 8 | 167 | 2.79 | 24.6 |
| Mean ± SD | 28 ± 19 | 32 ± 14 | ||||
| t-test, t | −0.66 | |||||
| t-test, df | 27.49 | |||||
| t-test, P-value | 0.52 | |||||
| Mann-Whitney test, P-value | 0.49 | |||||
Secondary structure according to DeepView: Swiss-PdbViewer (Guex and Peitsch, 1997).
Accessible surface area (ASA), average relative surface area per residue (%) computed by the NACCESS program (Hubbard and Thornton, 1993).
One of two or more amyloidogenic sequences in given protein: only this sequence has residues in helical conformation.
Table VII.
Pooled Data for Accessible Surface Area of Amyloidogenic and Non-amyloidogenic β-strand and Helical Residues
| Average relative ASA per β-strand residuea % |
Average relative ASA per helical residuea % |
|||
|---|---|---|---|---|
| Amyloidogenic | Non-amyloidogenic | Amyloidogenic | Non-amyloidogenic | |
| Number of residues | 208 | 1861 | 199 | 1487 |
| Mean ± SD | 12 ± 16 | 17 ± 20 | 29 ± 28 | 27 ± 24 |
| Mann-Whitney test, p-value | 0.0011 | 0.95 | ||
Accessible surface area (ASA), average relative surface area per residue (%) computed by the NACCESS program.
Hydrophobicity
Mean residue hydrophobicities for amyloidogenic and non-amyloidogenic residues are given in Table VIII. Amyloidogenic residues are much more likely to be hydrophobic than non-amyloidogenic residues. The average hydrophobicity of amyloidogenic residues is greater than non-amyloidogenic residues in all proteins except for human complement factor and prolactin (data not shown). (Human complement factor has a Cys to Ser mutation that causes amyloidogenicity, perhaps via loss of a disulphide bond.) This is the case when comparing residues within strands or helices, though there is an overall trend for strand residues to be more hydrophobic than helical residues. We compared our data set to a representative set of 586 non-homologous PDB structures (200,754 amino acid residues). Our data set has slightly more hydrophobic helices and less hydrophobic coil regions overall, though these differences are much smaller than those seen when comparing amyloidogenic with non-amyloidogenic sequences. There is thus a clear trend for amyloidogenic sequences to be hydrophobic, as expected since they are prone to aggregation by definition. Also apparent is that amyloidogenic β-strand residues are the most hydrophobic of all types of residue (average hydrophobicity per residue 0.800).
Table VIII.
Hydrophobicity of Amyloidogenic and Non-amyloidogenic Residues in Amyloidogenic Proteins and of Residues in Globular Proteins in Generala,b
| Amyloidogenic proteinsc | ||||
|---|---|---|---|---|
| Amyloidogenic residues | Non-amyloidogenic residues | All residues | Culled set of globular proteinsb | |
| Secondary structured | ||||
| All residues | 0.600 | 0.372 | 0.380 | 0.366 |
| Helical | 0.638 | 0.409 | 0.418 | 0.356 |
| Strand | 0.800 | 0.625 | 0.634 | 0.616 |
| Coil | 0.356 | 0.159 | 0.165 | 0.218 |
Thirty amyloidogenic proteins represented by PDB models: 1A79, 1APS, 1ATI, 1B0G, 1BEB, 1CKT, 1GKG, 1HKQ, 1IRU, 1KCQ, 1LFH, 1QLX, 1REX, 1RW5, 1SOH, 1TTA, 1USG, 1W4R, 1WLA, 1X3B, 1XDA, 1XQ8, 2D4G, 2DPK, 2ES2, 2HNH, 2JD4, 2NTT, 2QJP and 3BN6. Hydrophobicity calculated using Perl program ‘stride_hydrophob’. Analysis comprised 589 amyloidogenic and 15654 non-amyloidogenic residues: 214 helical amyloidogenic, 188 strand amyloidogenic and 187 coil amyloidogenic residues; 5593 helical non-amyloidogenic, 4136 strand non-amyloidogenic and 5925 coil non-amyloidogenic residues.
Culled set obtained from PISCES website: http://dunbrack.fccc.edu/PISCES.php (<20% SID, <1.6 Å resolution, <0.25 R factor).62 Hydrophobicity calculated using Perl program ‘stride_hydrophob’. Analysis comprised 586 PDB structures consisting of 200,754 amino acid residues.
For AcP and medin, structures of homologous proteins were used (PDB IDs: 1APS and 3BN6, respectively), and the FASTA sequence from the UniProt entries, P14621 and Q08431, applies for hydrophobicity measurements.
Secondary structure according to STRIDE: http://webclu.bio.wzw.tum.de/cgi-bin/stride/stridecgi.py.114
Comparison of solvent accessible surface areas with secondary structure contents
The solvent accessible surface area data, subdivided by secondary structure (Tables V–VII), suggests that distinct strategies are used by proteins to avoid aggregation depending on whether amyloidogenic sequences are found within strands or helices. We therefore divided our data set into two parts: the H-set, which contains all amyloidogenic sequences that have no residues in strand (Supp. Info. Table 1), and the S-set which contains all amyloidogenic sequences that have one or more residues in strand (Supp. Info. Table 2).
Figure 2 shows correlations between solvent accessible surface area and secondary structure strand content. There is a significant correlation for strands, with sequences that have more β content, more likely to be buried. This is apparent when looking at the amyloidogenic sequences in all our data set (Fig. 2a), within the S-set (Fig. 2b) and for strand content in non-amyloidogenic sequences (Fig. 2c). This general trend for sequences with a higher strand content to be more buried can explain why amyloidogenic sequences can be tolerated in proteins if they are in β structure.
Figure 2.
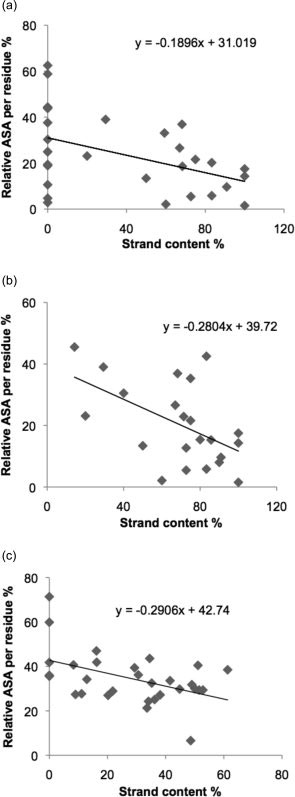
(a) Correlation between relative accessible surface area (ASA) per residue and strand content in amyloidogenic sequences of 30 native proteins (one average value per protein). Correlation coefficient = −0.4568, p = 0.0112; slope of trendline = −0.1896. (b) Correlation between relative accessible surface area (ASA) per residue and strand content in S-set of amyloidogenic sequences. Correlation coefficient = −0.5239, p = 0.0123; slope of the trendline = −0.2804. (c) Correlation between relative accessible surface area (ASA) per residue and strand content in non-amyloidogenic sequences of 30 native proteins. Correlation coefficient = −0.4735, p = 0.0082; slope of the trendline = −0.2906.
In contrast to strands, there is no preference for sequences with more helical content to have a lower solvent accessible surface area (Fig. 3). Figure 3a shows a weak trend for sequences with a high helical content in amyloidogenic sequences to have a higher surface area, though this correlation arises from the inclusion of sequences with low accessibility and zero helical content, since within the H-set the correlation is not apparent (Fig. 3b). There is also no correlation between accessibility and helical content within non-amyloidogenic sequences (Fig. 3c). This therefore suggests that amyloidogenic sequences in helices do not need to be buried to avoid aggregation, in contrast to strand sequences.
Figure 3.
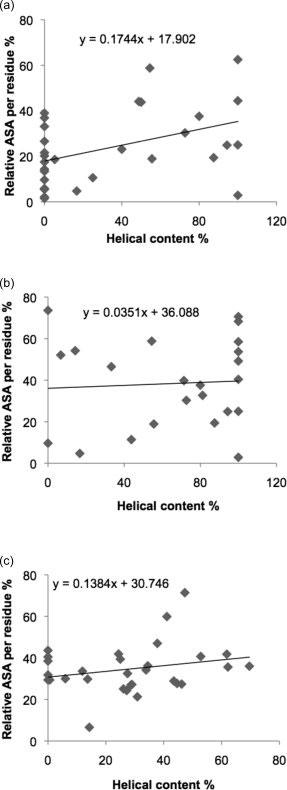
(a) Correlation between relative accessible surface area (ASA) per residue and helical content in amyloidogenic sequences of 30 native proteins (one average value per protein). Correlation coefficient = 0.4244, p = 0.0194; slope of trendline = 0.1744. (b) Correlation between relative accessible surface area (ASA) per residue and helical content in H-set of amyloidogenic sequences. Correlation coefficient = 0.0610, p = 0.7823; slope of the trendline = −0.0351. (c) Correlation between relative accessible surface area (ASA) per residue and helical content in non-amyloidogenic sequences of 30 native proteins. Correlation coefficient = 0.2414, p = 0.1987; slope of the trendline = 0.1384.
Discussion
Proteins that contain a sequence capable of forming amyloid pose a real danger for a cell, since they can be toxic if they fold into this form. A simple solution to this problem might therefore be for such sequences to be never present within proteins. While selection against sequences that may form amyloid does seem to occur,50 they are still present in some proteins, perhaps because they are essential for function or important for folding. By examining experimentally verified amyloidogenic sequences within protein structures, we have identified two mechanisms by which proteins avoid aggregation: Firstly, amyloidogenic sequences are often found within helices. This is remarkable, since these sequences have an inherent preference to form β structures, by definition, since amyloid has a cross-β structure. Despite this preference, the rest of the protein forces the amyloidogenic region into helix. Helix is arguably as distant as possible from amyloid, since in order to form amyloid the sequence will presumably have to first unfold and then refold into a β structure. If the amyloidogenic sequence is in a helix, there is no additional pressure for it to be buried. Discordant helices have previously been discussed as regions of a protein predicted to form strand, while actually forming helix.27,30,49 During folding into the native structure, such regions of secondary structure ambivalence have similar potential to fold into α-helices or β-sheets. The results presented here clearly demonstrate this ambivalence manifested in the different secondary structures adopted by fibril-forming sequences in native proteins. The sequence LYQLEN is 100% helical in human insulin, but 67% strand and 33% random coil in Bacillus subtilis YjcG protein. The sequence FGAIL, is 100% helical in cytochrome b, but 40% helical, 20% strand and 40% random coil in thymidine kinase (Table II). Similarly, the sequence GGVVIA, the region of the Abeta(1–42) peptide with the highest aggregation propensity,36 where it is 100% helical,104 is shown in this study to adopt a 100% strand conformation in E. coli DNA polymerase and a conformation which is 83% strand, 17% random coil in chains N and 2 of the 20S proteasome of Bos taurus (Table II).
Hydrophobicity is arguably the single most important physico-chemical feature influencing the aggregation potential of a polypeptide chain.14,32,105 Our results clearly show that the hydrophobicity of amyloidogenic residues in native proteins is similar to that of β strand residues in globular proteins in general. Furthermore, it is clear that amyloidogenic β strand residues are highly hydrophobic (Table VIII). Nevertheless, observations from this study support conclusions from previous work that observed patterns of β aggregation are not solely the outcome of hydrophobicity and β-sheet propensity.103 Globular proteins contain three times as many aggregation nucleating regions as intrinsically disordered proteins suggesting that tertiary structure formation competes with β aggregation propensity and that burying of the aggregating regions in the folded state is expected as a logical consequence.103 Destabilisation of the native state by natural mutation leads to amyloid disease.28 Globular proteins are thus protected from self-association by having aggregation-prone stretches sequestered by structure.23
The existence of strong selection pressure on the conformational stability of the native state is well established.106 Negative selection pressure will ensure that amyloidogenic sequences having a detrimental effect on the organism will be sequestered into protein structures where their harmful effect is mitigated.106 In the case of functional amyloid, the ability to exploit an environmental niche has resulted in retention of these sequences.16,107,108
These earlier conclusions are borne out by this study, which shows that in native proteins there is a greater tendency for amyloidogenic sequences to form either α helical or β strand secondary structure rather than random coil. Furthermore, the results show that potentially fibril-forming residues in β-strand conformation are more buried than non-fibril-forming residues. This is not the case for fibril-forming helices which are equally as exposed to the protein surface as their nonfibril-forming counterparts. The helical conformation would therefore appear to offer equal protection against fibril formation as buried strand conformation. Surface exposed amyloidogenic sequences are not tolerated in strands, presumably because they lead to protein aggregation via assembly of the amyloidogenic regions.
Methods
Viewing the protein molecules
Protein structures, downloaded from the Protein Data Bank, were viewed using the software package DeepView, version 3.7 (formerly Swiss-PdbViewer).109 Biological units were used throughout. In the case of β-lactoglobulin, PDB ID 1BEB, the two biological units were used to construct the dimer, the physiologically functional form of the protein, using the ‘Create Merged Layer’ function in DeepView.
Secondary structure
Secondary structure was recorded for each residue according to the designation given by DeepView, in which residues are classified as helical, strand, or random coil.109 This classification often differs slightly from that given in the PDB file header for a particular protein.
Surface accessibility
The relative accessible surface area (RASA) (%) for each residue of the biological unit was calculated using the NACCESS program, version 2.1.1.110 Average relative surface accessibilities per residue were calculated for amyloidogenic and non-amyloidogenic sequences and for the different secondary structures thereof, using Excel.
Hydrogen-bond density
Putative hydrogen-bonds were calculated using the VADAR program, version 1.5111 and results expressed as hydrogen-bonds per residue for a given sequence. Structures were uploaded to the VADAR website for single or multiple chain analysis, as appropriate. The 20S proteasome, PDB ID 1IRU, exceeded the upper limit of VADAR (2000 residues) and so a construct was used comprising chains N and 2 which contain the amyloidogneic sequence GGVVIA, and those chains having potential hydrogen-bond interactions with chains N and 2, as measured in DeepView.
Hydrophobicity
Hydrophobicity calculations were carried out applying Perl programs. FASTA sequence files downloaded from the respective PDB entry for each protein were used in the calculations, except for AcP and medin where human sequences matching the 1APS and 3BN6 sequences were taken from the UniProt entries P14621 and Q08431, respectively. Each amino acid was assigned its hydrophobicity value according to the scale of Fauchere and Pliska112 and a simple average of the individual values was calculated for any given sequence. For comparative purposes, hydrophobicity measurements were carried out on subsets of sequences culled from the PDB using PISCES67 with a maximum sequence identity of 20%, R factor of no greater than 0.25 and resolution 1.6 Å or better. For the hydrophobicity calculations, secondary structure was assigned according to STRIDE114 with simplification of the STRIDE classification into helical, strand, and coil secondary structure types, whereby helical comprises 310 and α-helical types, strand comprises strand and bridge types and coil comprises coil and turn types.
Amyloidogenic sequences and datasets
Except in the case of pooled data, values for percentage secondary structure distribution, relative accessible surface area (ASA)/residue and hydrogen-bond density (hydrogen-bonds/residue) were calculated for each protein and for each amyloidogenic sequence. In the case of oligomeric proteins with more than one copy of an amyloidogenic sequence, one average value for the sequence and protein was calculated to avoid redundancy. To observe more accurately the relationship between surface accessibility and secondary structure in the amyloidogenic sequences, the proteins were further divided into those with a β-strand content of >0% in their amyloidogenic sequences, the so-called S-set, and those whose amyloidogenic sequences contained 0% strand content, the H-set. Some amyloidogenic sequences occur in more than one protein and so are associated with the corresponding number of values for each parameter. Thus, two values each for relative solvent accessible surface area, helical, strand, and coil content and hydrogen-bond density are associated with the sequence LVEALYL, which occurs in the insulin B chain and each chain of the M. jannaschii tRNA endonuclease, a tetramer. Similarly, two values for each parameter are associated with the S-set sequences, GGVVIA and IKVAV. The amyloidogenic sequence LYQLEN, which occurs in the A chain of insulin and the ‘YjcG’ protein of B. subtilis, is ambivalent with respect to secondary structure. Similarly, FGAIL occurs in chains A and D of cytochrome b from Rhodobacter sphaeroides (H-set) as well as human cystolic thymidine kinase (S-set) (Table I and supp. info.).
Statistical analyses
The Kolmogorov-Smirnov test was used to assess normal distribution of datasets. The two-sample t-test and the Mann-Whitney test were used for normally and non-normally distributed data, respectively. The software package R, version 2.6.2, was used for Kolmogorov-Smirnov, Mann-Whitney and t-test calculations.113 Correlation coefficients were calculated using Matlab, version 7.1.0.21 (The MathWorks, Inc). Significance was assumed at the P < 0.05 level.
Acknowledgments
We thank Tracey Bray for helpful discussion regarding Perl programming.
Glossary
Abbreviations:
- AD
Alzheimer's disease
- ASA
accessible surface area
- PDB
Protein Data Bank
- PFH
paired helical filament
- SRE
self-recognition element.
References
- 1.Guijarro JI, Sunde M, Jones JA, Campbell ID, Dobson CM. Amyloid fibril formation by an SH3 domain. Proc Natl Acad Sci USA. 1998;95:4224–4228. doi: 10.1073/pnas.95.8.4224. [DOI] [PMC free article] [PubMed] [Google Scholar]
- 2.Chiti F, Webster P, Taddei N, Clark A, Stefani M, Ramponi G, Dobson CM. Designing conditions for in vitro formation of amyloid protofilaments and fibrils. Proc Natl Acad Sci USA. 1999;90:3590–3594. doi: 10.1073/pnas.96.7.3590. [DOI] [PMC free article] [PubMed] [Google Scholar]
- 3.Fändrich M, Forge V, Buder K, Kittler M, Dobson CM, Diekmann S. Myoglobin forms amyloid fibrils by association of unfolded polypeptide segments. Proc Natl Acad Sci USA. 2003;100:15463–15468. doi: 10.1073/pnas.0303758100. [DOI] [PMC free article] [PubMed] [Google Scholar]
- 4.Dobson CM. Protein folding and misfolding. Nature. 2003;426:884–890. doi: 10.1038/nature02261. [DOI] [PubMed] [Google Scholar]
- 5.Thirumalai D, Klimov DK, Dima RI. Emerging ideas on the molecular basis of protein and peptide aggregation. Curr Opin Struct Biol. 2003;13:146–159. doi: 10.1016/s0959-440x(03)00032-0. [DOI] [PubMed] [Google Scholar]
- 6.Makin OS, Serpell LC. Structures for amyloid fibrils. FEBS J. 2005;272:5950–5961. doi: 10.1111/j.1742-4658.2005.05025.x. [DOI] [PubMed] [Google Scholar]
- 7.Haass C, Selkoe DJ. Soluble protein oligomers in neurodegeneration: lessons from the Alzheimer's amyloid β-peptide. Nat Rev Mol Cell Biol. 2007;8:101–112. doi: 10.1038/nrm2101. [DOI] [PubMed] [Google Scholar]
- 8.Dobson CM. Protein misfolding, evolution and disease. Trends Biochem Sci. 1999;24:329–332. doi: 10.1016/s0968-0004(99)01445-0. [DOI] [PubMed] [Google Scholar]
- 9.Stefani M, Dobson CM. Protein aggregation and aggregate toxicity: new insights into protein folding, misfolding diseases and biological evolution. J Mol Med. 2003;81:678–699. doi: 10.1007/s00109-003-0464-5. [DOI] [PubMed] [Google Scholar]
- 10.Uversky VN, Fink AL. Conformational constraints for amyloid fibrillation: the importance of being unfolded. Biochim Biophys Acta. 2004;1698:131–153. doi: 10.1016/j.bbapap.2003.12.008. [DOI] [PubMed] [Google Scholar]
- 11.Ventura S, Zurdo J, Narayanan S, Parreno M, Mangues R, Reif B, Chiti F, Giannoni E, Dobson CM, Aviles FX. Short amino acid stretches can mediate amyloid formation in globular proteins: the Src homology 3 (SH3) case. Proc Natl Acad Sci USA. 2004;101:7258–7263. doi: 10.1073/pnas.0308249101. [DOI] [PMC free article] [PubMed] [Google Scholar]
- 12.Kenney JM, Knight D, Wise MJ, Vollrath F. Amyloidogenic nature of spider silk. Eur J Biochem. 2002;269:4159–4163. doi: 10.1046/j.1432-1033.2002.03112.x. [DOI] [PubMed] [Google Scholar]
- 13.Kelly JW, Balch WE. Amyloid as a natural product. J Cell Biol. 2003;161:461–462. doi: 10.1083/jcb.200304074. [DOI] [PMC free article] [PubMed] [Google Scholar]
- 14.Chiti F, Dobson CM. Protein misfolding, functional amyloid, and human disease. Ann Rev Biochem. 2006;75:333–366. doi: 10.1146/annurev.biochem.75.101304.123901. [DOI] [PubMed] [Google Scholar]
- 15.Iconomidou VA, Chryssikos GD, Gionis V, Galanis AS, Cordopatis P, Hoenger A, Hamodrakas SJ. Amyloid fibril formation propensity is inherent into the hexapeptide tandemly repeating sequence of the central domain of silkmoth chorion proteins of the A-family. J Struc Biol. 2006;156:480–488. doi: 10.1016/j.jsb.2006.08.011. [DOI] [PubMed] [Google Scholar]
- 16.Fowler DM, Koulov AV, Alory-Jost C, Marks MS, Balch WE, Kelly JW. Functional amyloid formation within mammalian tissue. PLoS Biol. 2006;4:e6. doi: 10.1371/journal.pbio.0040006. [DOI] [PMC free article] [PubMed] [Google Scholar]
- 17.Fowler DM, Koulov AV, Balch WE, Kelly JW. Functional amyloid – from bacteria to humans. Trends Biochem Sci. 2007;32:217–224. doi: 10.1016/j.tibs.2007.03.003. [DOI] [PubMed] [Google Scholar]
- 18.Sunde M, Serpell LC, Bartlam M, Fraser PE, Pepys MB, Blake CC. Common core structure of amyloid fibrils by synchrotron X-ray diffraction. J Mol Biol. 1997;273:729–739. doi: 10.1006/jmbi.1997.1348. [DOI] [PubMed] [Google Scholar]
- 19.Petkova AT, Ishii Y, Balbach JJ, Antzutkin ON, Leapman RD, Delaglio F, Tycko R. A structural model for Alzheimer's β-amyloid fibrils based on experimental constraints from solid state NMR. Proc Natl Acad Sci USA. 2002;99:16742–16747. doi: 10.1073/pnas.262663499. [DOI] [PMC free article] [PubMed] [Google Scholar]
- 20.Tycko R. Progress towards a molecular-level structural understanding of amyloid fibrils. Curr Opin Struct Biol. 2004;14:96–103. doi: 10.1016/j.sbi.2003.12.002. [DOI] [PubMed] [Google Scholar]
- 21.Tycko R. Molecular structure of amyloid fibrils: insights from solid state NMR. Quart Rev Biophys. 2006;39:1–55. doi: 10.1017/S0033583506004173. [DOI] [PubMed] [Google Scholar]
- 22.Wilson LM, Mok YF, Binger KJ, Griffin MD, Mertens HD, Lin F, Wade JD, Gooley PR, Howlett GJ. A structural core within apolipoprotein C-II amyloid fibrils identified using hydrogen exchange and proteolysis. J Mol Biol. 2007;366:1639–1651. doi: 10.1016/j.jmb.2006.12.040. [DOI] [PubMed] [Google Scholar]
- 23.Rousseau F, Schymkowitz J, Serrano L. Protein aggregation and amyloidosis: confusion of the kinds? Curr Opin Struc Biol. 2006;16:118–126. doi: 10.1016/j.sbi.2006.01.011. [DOI] [PubMed] [Google Scholar]
- 24.Nichols MR, Moss MA, Reed DK, Cratic-Mcdaniel S, Hoh JH, Rosenberry TL. Amyloid-β protofibrils differ from amyloid-β aggregates induced in dilute hexafluoroisopropanol in stability and morphology. J Biol Chem. 2005;280:2471–2480. doi: 10.1074/jbc.M410553200. [DOI] [PubMed] [Google Scholar]
- 25.Bucciantini M, Giannoni E, Chiti F, Baroni F, Formigli L, Zurdo J, Taddei N, Ramponi G, Dobson CM, Stefani M. Inherent toxicity of aggregates implies a common mechanism for protein misfolding diseases. Nature. 2002;416:507–511. doi: 10.1038/416507a. [DOI] [PubMed] [Google Scholar]
- 26.Baglioni S, Casamenti F, Bucciantini M, Luheshi LM, Taddei N, Chiti F, Dobson CM, Stefani M. Prefibrillar amyloid aggregates could be generic toxins in higher organisms. J Neurosci. 2006;26:8160–8167. doi: 10.1523/JNEUROSCI.4809-05.2006. [DOI] [PMC free article] [PubMed] [Google Scholar]
- 27.Kallberg Y, Gustafsson M, Persson B, Thyberg J, Johansson J. Prediction of amyloid fibril-forming proteins. J Biol Chem. 2001;276:12945–12950. doi: 10.1074/jbc.M010402200. [DOI] [PubMed] [Google Scholar]
- 28.Chiti F, Taddei N, Baroni F, Capanni C, Stefani M, Ramponi G, Dobson CM. Kinetic partitioning of protein folding and aggregation. Nat Struct Biol. 2002;9:137–143. doi: 10.1038/nsb752. [DOI] [PubMed] [Google Scholar]
- 29.Chiti F, Stefani M, Taddei N, Ramponi G, Dobson CM. Rationalization of the effects of mutations on peptide and protein aggregation rates. Nature. 2003;424:805–808. doi: 10.1038/nature01891. [DOI] [PubMed] [Google Scholar]
- 30.Johansson J. Molecular determinants for amyloid fibril formation: lessons from lung surfactant protein C. Swiss Med Wkly. 2003;133:275–282. doi: 10.4414/smw.2003.09987. [DOI] [PubMed] [Google Scholar]
- 31.Chien P, Weissman JS, Depace AH. Emerging principles of conformation-based prion inheritance. Ann Rev Biochem. 2004;73:617–656. doi: 10.1146/annurev.biochem.72.121801.161837. [DOI] [PubMed] [Google Scholar]
- 32.Dubay KF, Pawar AP, Chiti F, Zurdo J, Dobson CM, Vendruscolo M. Prediction of the absolute aggregation rates of amyloidogenic polypeptide chains. J Mol Biol. 2004;341:1317–1326. doi: 10.1016/j.jmb.2004.06.043. [DOI] [PubMed] [Google Scholar]
- 33.Fernandez-Escamilla AM, Rousseau F, Schymkowitz J, Serrano L. Prediction of sequence-dependent and mutational effects on the aggregation of peptides and proteins. Nat Biotechnol. 2004;22:1302–1306. doi: 10.1038/nbt1012. [DOI] [PubMed] [Google Scholar]
- 34.Lopez De La Paz M, Serrano L. Sequence determinants of amyloid fibril formation. Proc Natl Acad Sci USA. 2004;101:87–92. doi: 10.1073/pnas.2634884100. [DOI] [PMC free article] [PubMed] [Google Scholar]
- 35.Pastor MT, Esteras-Chopo A, De La Paz MT. Design of model systems for amyloid formation: lessons for prediction and inhibition. Curr Opin Struct Biol. 2005;15:57–63. doi: 10.1016/j.sbi.2005.01.004. [DOI] [PubMed] [Google Scholar]
- 36.Pawar AP, Dubay KF, Zurdo J, Chiti F, Vendruscolo M, Dobson CM. Prediction of ‘aggregation-prone’ and ‘aggregation-susceptible’ regions in proteins associated with neurodegenerative diseases. J Mol Biol. 2005;350:379–392. doi: 10.1016/j.jmb.2005.04.016. [DOI] [PubMed] [Google Scholar]
- 37.Sanchez De Groot N, Pallares I, Aviles FX, Vendrell J, Ventura S. Prediction of “hot spots” of aggregation in disease-linked polypeptides. BMC Struc Biol. 2005;5:18. doi: 10.1186/1472-6807-5-18. [DOI] [PMC free article] [PubMed] [Google Scholar]
- 38.Tartaglia GG, Cavalli A, Pellarin R, Caflisch A. Prediction of aggregation rate and aggregation-prone segments in polypeptide sequences. Protein Sci. 2005;14:2723–2734. doi: 10.1110/ps.051471205. [DOI] [PMC free article] [PubMed] [Google Scholar]
- 39.Caflisch A. Computational models for the prediction of polypeptide aggregation propensity. Curr Opin Chem Biol. 2006;10:437–444. doi: 10.1016/j.cbpa.2006.07.009. [DOI] [PubMed] [Google Scholar]
- 40.Thompson MJ, Sievers SA, Karanicolas J, Ivanova MI, Baker D, Eisenberg D. The 3D profile method for identifying fibril-forming segments of proteins. Proc Natl Acad Sci USA. 2006;103:4074–4078. doi: 10.1073/pnas.0511295103. [DOI] [PMC free article] [PubMed] [Google Scholar]
- 41.Conchillo-Sole O, De Groot NS, Aviles FX, Vendrell J, Daura X, Ventura S. AGGRESCAN: a server for the prediction and evaluation of “hot spots” of aggregation in polypeptides. BMC Bioinform. 2007;8:65. doi: 10.1186/1471-2105-8-65. [DOI] [PMC free article] [PubMed] [Google Scholar]
- 42.Tartaglia GG, Cavalli A, Vendruscolo M. Prediction of local structural stabilities of proteins from their amino acid sequences. Structure. 2007;15:139–143. doi: 10.1016/j.str.2006.12.007. [DOI] [PubMed] [Google Scholar]
- 43.Azriel R, Gazit E. Analysis of the minimal amyloid-forming fragment of the islet amyloid polypeptide. An experimental support for the key role of the phenylalanine residue in amyloid formation. J Biol Chem. 2001;276:34156–34161. doi: 10.1074/jbc.M102883200. [DOI] [PubMed] [Google Scholar]
- 44.Schwartz R, King J. Frequencies of hydrophobic and hydrophilic runs and alternations in proteins of known structure. Protein Sci. 2006;15:102–112. doi: 10.1110/ps.051741806. [DOI] [PMC free article] [PubMed] [Google Scholar]
- 45.Lopez De La Paz M, Goldie K, Zurdo J, Lacroix E, Dobson CM, Hoenger A, Serrano L. De novo designed peptide-based amyloid fibrils. Proc Natl Acad Sci USA. 2002;99:16052–16057. doi: 10.1073/pnas.252340199. [DOI] [PMC free article] [PubMed] [Google Scholar]
- 46.Chiti F, Calamai M, Taddei N, Stefani M, Ramponi G, Dobson CM. Studies of the aggregation of mutant proteins in vitro provide insights into the genetics of amyloid diseases. Proc Natl Acad Sci USA. 2002;99:16419–16426. doi: 10.1073/pnas.212527999. [DOI] [PMC free article] [PubMed] [Google Scholar]
- 47.Schmittschmitt JP, Scholtz JM. The role of protein stability, solubility, and net charge in amyloid fibril formation. Protein Sci. 2003;12:2374–2378. doi: 10.1110/ps.03152903. [DOI] [PMC free article] [PubMed] [Google Scholar]
- 48.Calloni G, Zoffoli S, Stefani M, Dobson CM, Chiti F. Investigating the effects of mutations on protein aggregation in the cell. J Biol Chem. 2005;280:10607–10613. doi: 10.1074/jbc.M412951200. [DOI] [PubMed] [Google Scholar]
- 49.Paivio A, Nordling E, Kallberg Y, Thyberg J, Johansson J. Stabilization of discordant helices in amyloid fibril-forming proteins. Protein Sci. 2004;13:1251–1259. doi: 10.1110/ps.03442404. [DOI] [PMC free article] [PubMed] [Google Scholar]
- 50.Broome BM, Hecht MH. Nature disfavors sequences of alternating polar and non-polar amino acids: implications for amyloidogenesis. J Mol Biol. 2000;296:961–968. doi: 10.1006/jmbi.2000.3514. [DOI] [PubMed] [Google Scholar]
- 51.Williams AD, Portelius E, Kheterpal I, Guo J, Cook JD, Xu Y, Wetzel R. Mapping Abeta Amyloid fibril secondary structure using scanning proline mutagenesis. J Mol Biol. 2004;335:833–842. doi: 10.1016/j.jmb.2003.11.008. [DOI] [PubMed] [Google Scholar]
- 52.Hecht MH, Richardson JS, Richardson DC, Ogden RC. De novo design, expression, and characterization of Felix: a four-helix bundle protein of native-like sequence. Science. 1990;249:884–891. doi: 10.1126/science.2392678. [DOI] [PubMed] [Google Scholar]
- 53.Richardson JS, Richardson DC. Natural β-sheet proteins use negative design to avoid edge-to-edge aggregation. Proc Natl Acad Sci USA. 2002;99:2754–2759. doi: 10.1073/pnas.052706099. [DOI] [PMC free article] [PubMed] [Google Scholar]
- 54.Wang W, Hecht MH. Rationally designed mutations convert de novo amyloid-like fibrils into monomeric β-sheet proteins. Proc Natl Acad Sci USA. 2002;99:2760–2765. doi: 10.1073/pnas.052706199. [DOI] [PMC free article] [PubMed] [Google Scholar]
- 55.Otzen DE, Kristensen O, Oliveberg M. Designed protein tetramer zipped together with a hydrophobic Alzheimer homology: a structural clue to amyloid assembly. Proc Natl Acad Sci USA. 2000;97:9907–1992. doi: 10.1073/pnas.160086297. [DOI] [PMC free article] [PubMed] [Google Scholar]
- 56.Inouye H, Kirschner DA. X-ray fiber and powder diffraction of PrP prion peptides. Adv Prot Chem. 2006;73:181–215. doi: 10.1016/S0065-3233(06)73006-6. [DOI] [PubMed] [Google Scholar]
- 57.Sawaya MR, Sambashivan S, Nelson R, Ivanova MI, Sievers SA, Apostol MI, Thompson MJ, Balbirnie M, Wiltzius JJ, Mcfarlane HT. Atomic structures of amyloid cross-beta spines reveal varied steric zippers. Nature. 2007;447:453–457. doi: 10.1038/nature05695. [DOI] [PubMed] [Google Scholar]
- 58.Goux WJ, Kopplin L, Nguyen AD, Leak K, Rutkofsky M, Shanmuganandam VD, Sharma D, Inouye H, Kirschner DA. The formation of straight and twisted filaments from short tau peptides. J Biol Chem. 2004;279:26868–26875. doi: 10.1074/jbc.M402379200. [DOI] [PubMed] [Google Scholar]
- 59.Balbach JJ, Ishii Y, Antzutkin ON, Leapman RD, Rizzo NW, Dyda F, Reed J, Tycko R. Amyloid fibril formation by A beta 16–22, a seven-residue fragment of the Alzheimer's beta-amyloid peptide, and structural characterization by solid state NMR. Biochemistry. 2000;39:13748–13759. doi: 10.1021/bi0011330. [DOI] [PubMed] [Google Scholar]
- 60.Reches M, Gazit E. Amyloidogenic hexapeptide fragment of medhomology to functional islet amyloid polypeptide fragments. Amyloid. 2004;11:81–89. doi: 10.1080/13506120412331272287. [DOI] [PubMed] [Google Scholar]
- 61.Reches M, Porat Y, Gazit E. Amyloid fibril formation by pentapeptide and tetrapeptide fragments of human calcitonin. J Biol Chem. 2002;277:35475–35480. doi: 10.1074/jbc.M206039200. [DOI] [PubMed] [Google Scholar]
- 62.Haspel N, Zanuy D, Ma B, Wolfson H, Nussinov R. A comparative study of amyloid fibril formation by residues 15–19 of the human calcitonin hormone: a single beta-sheet model with a small hydrophobic core. J Mol Biol. 2005:1213–1227. doi: 10.1016/j.jmb.2004.11.002. [DOI] [PubMed] [Google Scholar]
- 63.Tenidis K, Waldner M, Bernhagen J, Fischle W, Bergmann M, Weber M, Merkle ML, Voelter W, Brunner H, Kapurniotu A. Identification of a penta- and hexapeptide of islet amyloid polypeptide (IAPP) with amyloidogenic and cytotoxic properties. J Mol Biol. 2000;295:1055–1071. doi: 10.1006/jmbi.1999.3422. [DOI] [PubMed] [Google Scholar]
- 64.Madine J, Doig AJ, Middleton DA. Design of an N-methylated peptide inhibitor of α-synuclein aggregation guided by solid-state NMR. J Am Chem Soc. 2008;130:7873–7881. doi: 10.1021/ja075356q. [DOI] [PMC free article] [PubMed] [Google Scholar]
- 65.Laskowski RA, Hutchinson EG, Michie AD, Wallace AC, Jones ML, Thornton JM. PDBsum: A Web-based database of summaries and analyses of all PDB structures. Trends Biochem Sci. 1997;22:488–490. doi: 10.1016/s0968-0004(97)01140-7. [DOI] [PubMed] [Google Scholar]
- 66.Laskowski RA, Chistyakov VV, Thornton JM. PDBsum more: new summaries and analyses of the known 3D structures of proteins and nucleic acids. Nucl Acids Res. 2005;33:D266–D268. doi: 10.1093/nar/gki001. [DOI] [PMC free article] [PubMed] [Google Scholar]
- 67.Wang GL, Dunbrack RL. PISCES: a protein sequence culling server. Bioinformatics. 2003;19:1589–1591. doi: 10.1093/bioinformatics/btg224. [DOI] [PubMed] [Google Scholar]
- 68.El-Agnaf OMA, Irvine GB. Aggregation and neurotoxicity of α-synuclein and related peptides. Biochem Soc Trans. 2002;30:559–565. doi: 10.1042/bst0300559. [DOI] [PubMed] [Google Scholar]
- 69.Giasson BI, Murray IVJ, Trojanowski JQ, Lee VMY. A hydrophobic stretch of 12 amino acid residues in the middle of α-synuclein is essential for filament assembly. J Biol Chem. 2001;276:2380–2386. doi: 10.1074/jbc.M008919200. [DOI] [PubMed] [Google Scholar]
- 70.Madine J, Doig AJ, Middleton DA. The aggregation and membrane-binding properties of an α-synuclein peptide fragment. Biochem Soc Trans. 2004;32:1127–1129. doi: 10.1042/BST0321127. [DOI] [PubMed] [Google Scholar]
- 71.El-Agnaf OM, Jakes R, Curran MD, Middleton D, Ingenito R, Bianchi E, Pessi A, Neill D, Wallace A. Aggregates from mutant and wild-type alpha-synuclein proteins and NAC peptide induce apoptotic cell death in human neuroblastoma cells by formation of beta-sheet and amyloid-like filaments. FEBS Lett. 1998;440:71–76. doi: 10.1016/s0014-5793(98)01418-5. [DOI] [PubMed] [Google Scholar]
- 72.Hamada D, Tanaka T, Tartaglia GG, Pawar A, Vendruscolo M, Kawamura M, Tamura A, Tanaka N, Dobson CM. Competition between Folding, Native-State Dimerisation and Amyloid Aggregation in β-Lactoglobulin. J Mol Biol. 2009;386:878–890. doi: 10.1016/j.jmb.2008.12.038. [DOI] [PubMed] [Google Scholar]
- 73.Iwata K, Fujiwara T, Matsuki Y, Akutsu H, Takahashi S, Naiki H, Goto Y. 3D structure of amyloid protofilaments of beta2-microglobulin fragment probed by solid-state NMR. Proc Natl Acad Sci USA. 2006;103:18119–18124. doi: 10.1073/pnas.0607180103. [DOI] [PMC free article] [PubMed] [Google Scholar]
- 74.Jones S, Manning J, Kad NM, Radford SE. Amyloid-forming peptides from β2-microglobulin-Insights into the mechanism of fibril formation in vitro. J Mol Biol. 2003;325:249–257. doi: 10.1016/s0022-2836(02)01227-5. [DOI] [PubMed] [Google Scholar]
- 75.Ivanova MI, Thompson MJ, Eisenberg D. A systematic screen of β-microglobulin and insulin for amyloid-like segments. Proc Natl Acad Sci USA. 2006;103:4079–4082. doi: 10.1073/pnas.0511298103. [DOI] [PMC free article] [PubMed] [Google Scholar]
- 76.Bemporad F, Taddei N, Stefani M, Chiti F. Assessing the role of aromatic residues in the amyloid aggregation of human muscle acylphosphatase. Protein Sci. 2006;15:862–870. doi: 10.1110/ps.051915806. [DOI] [PMC free article] [PubMed] [Google Scholar]
- 77.Kallijarvi J, Haltia M, Baumann MH. Amphoterin includes a sequence motif which is homologous to the Alzheimer's β-amyloid peptide (Aβ), forms amyloid fibrils in vitro, and binds avidly to Aβ. Biochemistry. 2001;40:10032–10037. doi: 10.1021/bi002095n. [DOI] [PubMed] [Google Scholar]
- 78.Gross M, Wilkins DK, Pitkeathly MC, Chung EW, Higham C, Clark A, Dobson CM. Formation of amyloid fibrils by peptides derived from the bacterial cold shock protein CspB. Protein Sci. 1999;8:1350–1357. doi: 10.1110/ps.8.6.1350. [DOI] [PMC free article] [PubMed] [Google Scholar]
- 79.Wilkins DK, Dobson CM, Gross M. Biophysical studies of the development of amyloid fibrils from a peptide fragment of cold shock protein B. Eur J Biochem. 2000;267:2609–2616. doi: 10.1046/j.1432-1327.2000.01270.x. [DOI] [PubMed] [Google Scholar]
- 80.Maury CP, Nurmiaho-Lassila EL. Creation of amyloid fibrils from mutant Asn187 gelsolin peptides. Biochem Biophys Res Commun. 1992;183:227–231. doi: 10.1016/0006-291x(92)91632-z. [DOI] [PubMed] [Google Scholar]
- 81.Gazit E. Mechanisms of amyloid fibril self-assembly and inhibition. Model short peptides as a key research tool. FEBS J. 2005;272:5971–5978. doi: 10.1111/j.1742-4658.2005.05022.x. [DOI] [PubMed] [Google Scholar]
- 82.Pertinhez TA, Bouchard M, Smith RA, Dobson CM, Smith LJ. Stimulation and inhibition of fibril formation by a peptide in the presence of different concentrations of SD. FEBS Lett. 2002;529:193–197. doi: 10.1016/s0014-5793(02)03333-1. [DOI] [PubMed] [Google Scholar]
- 83.Yuan C, Berscheit HL, Huang AJ. Identification of an amyloidogenic region on keratoepithelin via synthetic peptides. FEBS Lett. 2007;581:241–247. doi: 10.1016/j.febslet.2006.12.019. [DOI] [PubMed] [Google Scholar]
- 84.Nilsson MR, Dobson CM. In vitro characterization of lactoferrin aggregation and amyloid formation. Biochemistry. 2003;42:375–382. doi: 10.1021/bi0204746. [DOI] [PubMed] [Google Scholar]
- 85.Kasai S, Urushibata S, Hozumi K, Yokoyama F, Ichikawa N, Kadoya Y, Nishi N, Watanabe N, Yamada Y, Nomizu M. Identification of multiple amyloidogenic sequences in laminin-1. Biochemistry. 2007;46:3966–3974. doi: 10.1021/bi062097t. [DOI] [PubMed] [Google Scholar]
- 86.Frare E, Mossuto MF, Polverino De Laureto P, Dumoulin M, Dobson CM, Fontana A. Identification of the core structure of lysozyme amyloid fibrils by proteolysis. J Mol Biol. 2006;361:551–561. doi: 10.1016/j.jmb.2006.06.055. [DOI] [PubMed] [Google Scholar]
- 87.Larsson A, Söderberg L, Westermark GT, Sletten K, Engström U, Tjernberg LO, Näslund J, Westermark P. Unwinding fibril formation of medin, the peptide of the most common form of human amyloid. 2007;361:822–828. doi: 10.1016/j.bbrc.2007.06.187. [DOI] [PubMed] [Google Scholar]
- 88.Häggqvist B, Näslund J, Sletten K, Westermark GT, Mucchiano G, Tjernberg LO, Nordstedt C, Engström U, Westermark P. Medan integral fragment of aortic smooth muscle cell-produced lactadherin forms the most common human amyloid. Proc Natl Acad Sci USA. 1999;96:8669–8674. doi: 10.1073/pnas.96.15.8669. [DOI] [PMC free article] [PubMed] [Google Scholar]
- 89.Picotti P, De Franceschi G, Frare E, Spolaore B, Zambonin M, Chiti F, De Laureto PP, Fontana A. Amyloid fibril formation and disaggregation of fragment 1–29 of apomyoglobinsights into the effect of pH on protein fibrillogenesis. J Mol Biol. 2007;367:1237–1245. doi: 10.1016/j.jmb.2007.01.072. [DOI] [PubMed] [Google Scholar]
- 90.Satheeshkumar KS, Jayakumar R. Conformational polymorphism of the amyloidogenic peptide homologous to residues 113–127 of the prion protein. Biophys J. 2003;85:473–483. doi: 10.1016/S0006-3495(03)74492-0. [DOI] [PMC free article] [PubMed] [Google Scholar]
- 91.Torrent J, Alvarez-Martinez MT, Liautard JP, Balny C, Lange R. The role of the 132–160 region in prion protein conformational transitions. Protein Sci. 2005;14:956–967. doi: 10.1110/ps.04989405. [DOI] [PMC free article] [PubMed] [Google Scholar]
- 92.Jones EM, Surewicz K, Surewicz WK. Role of N-terminal familial mutations in prion protein fibrillization and prion amyloid propagation in vitro. J Biol Chem. 2006;281:8190–8196. doi: 10.1074/jbc.M513417200. [DOI] [PubMed] [Google Scholar]
- 93.Thompson A, White AR, Mclean C, Masters CL, Cappai R, Barrow CJ. Amyloidogenicity and neurotoxicity of peptides corresponding to the helical regions of PrP(C) J Neurosci Res. 2000;62:293–301. doi: 10.1002/1097-4547(20001015)62:2<293::AID-JNR14>3.0.CO;2-Y. [DOI] [PubMed] [Google Scholar]
- 94.Westermark P, Eriksson L, Engstrom U, Enestrom S, Sletten K. Prolactin-derived amyloid in the aging pituitary gland. Am J Pathol. 1997;150:67–73. [PMC free article] [PubMed] [Google Scholar]
- 95.Giraldo R. Defined DNA sequences promote the assembly of a bacterial protein into distinct amyloid nanostructures. Proc Natl Acad Sci USA. 2007;104:17388–17393. doi: 10.1073/pnas.0702006104. [DOI] [PMC free article] [PubMed] [Google Scholar]
- 96.Jaroniec CP, Macphee CE, Astrof NS, Dobson CM, Griffin RG. Molecular conformation of a peptide fragment of transthyretin in an amyloid fibril. Proc Natl Acad Sci USA. 2002;99:16748–16753. doi: 10.1073/pnas.252625999. [DOI] [PMC free article] [PubMed] [Google Scholar]
- 97.Jaroniec CP, Macphee CE, Bajaj VS, Mcmahon MT, Dobson CM, Griffin RG. High-resolution molecular structure of a peptide in an amyloid fibril determined by magic angle spinning NMR spectroscopy. Proc Natl Acad Sci USA. 2004;101:711–716. doi: 10.1073/pnas.0304849101. [DOI] [PMC free article] [PubMed] [Google Scholar]
- 98.Mazor Y, Gilead S, Benhar I, Gazit E. Identification and characterization of a novel molecular-recognition and self-assembly domain within the islet amyloid polypeptide. J Mol Biol. 2002;322:1013–1024. doi: 10.1016/s0022-2836(02)00887-2. [DOI] [PubMed] [Google Scholar]
- 99.Wiltzius JJ, Sievers SA, Sawaya MR, Cascio D, Popov D, Riekel C, Eisenberg D. Atomic structure of the cross-beta spine of islet amyloid polypeptide (amylin) Protein Sci. 2008;17:1467–1474. doi: 10.1110/ps.036509.108. [DOI] [PMC free article] [PubMed] [Google Scholar]
- 100.Tashiro K, Sephel GC, Weeks B, Sasaki M, Martin GR, Kleinman HK, Yamada Y. A synthetic peptide containing the IKVAV sequence from the A chain of laminin mediates cell attachment, migration, and neurite outgrowth. J Biol Chem. 1989;264:16174–16182. [PubMed] [Google Scholar]
- 101.Yamada M, Kadoya Y, Kasai S, Kato K, Mochizuki M, Nishi N, Watanabe N, Kleinman HK, Yamada Y, Nomizu M. Ile-Lys-Val-Ala-Val (IKVAV)-containing laminin alpha1 chain peptides form amyloid-like fibrils. FEBS Lett. 2002;530:48–52. doi: 10.1016/s0014-5793(02)03393-8. [DOI] [PubMed] [Google Scholar]
- 102.Tagliavini F, Prelli F, Verga L, Giaccone G, Sarma R, Gorevic P, Ghetti B, Passerini F, Ghibaudi E, Forloni G. Synthetic peptides homologous to prion protein residues 106–147 form amyloid-like fibrils in vitro. Proc Natl Acad Sci USA. 1993;90:9678–9682. doi: 10.1073/pnas.90.20.9678. [DOI] [PMC free article] [PubMed] [Google Scholar]
- 103.Linding R, Schymkowitz J, Rousseau F, Diella F, Serrano L. A comparative study of the relationship between protein structure and β-aggregation in globular and intrinsically disordered proteins. J Mol Biol. 2004;342:345–353. doi: 10.1016/j.jmb.2004.06.088. [DOI] [PubMed] [Google Scholar]
- 104.Crescenzi O, Tomaselli S, Guerrini R, Salvadori S, D'ursi AM, Temussi PA, Picone D. Solution structure of the Alzheimer amyloid beta-peptide (1–42) in an apolar microenvironment. Similarity with a virus fusion domain. Eur J Biochem. 2002;269:5642–5648. doi: 10.1046/j.1432-1033.2002.03271.x. [DOI] [PubMed] [Google Scholar]
- 105.Kim W, Hecht MH. Generic hydrophobic residues are sufficient to promote aggregation of the Alzheimer's Abeta42 peptide. Proc Natl Acad Sci USA. 2006;103:15824–15829. doi: 10.1073/pnas.0605629103. [DOI] [PMC free article] [PubMed] [Google Scholar]
- 106.Monsellier E, Chiti F. Prevention of amyloid-like aggregation as a driving force of protein evolution. EMBO Rep. 2007;8:737–742. doi: 10.1038/sj.embor.7401034. [DOI] [PMC free article] [PubMed] [Google Scholar]
- 107.Sutherland TD, Young JH, Weisman S, Hayashi CY, Merritt DJ. Insect silk: one name, many materials. Ann Rev Entomol. 2010;55:171–188. doi: 10.1146/annurev-ento-112408-085401. [DOI] [PubMed] [Google Scholar]
- 108.Weisman S, Okada S, Mudie ST, Huson MG, Trueman HE, Sriskantha A, Haritos VS, Sutherland TD. Fifty years later: The sequence, structure and function of lacewing cross-beta silk. J Struct Biol. 2009;168:467–475. doi: 10.1016/j.jsb.2009.07.002. [DOI] [PubMed] [Google Scholar]
- 109.Guex N, Peitsch MC. SWISS-MODEL and the Swiss-PdbViewer: an environment for comparative protein modeling. Electrophoresis. 1997;18:2714–2723. doi: 10.1002/elps.1150181505. [DOI] [PubMed] [Google Scholar]
- 110.Hubbard SJ, Thornton JM. NACCESS' computer program, Department of Biochemistry and Molecular Biology. 1993. Available at http://www.bioinf.manchester.ac.uk/naccess/. University College London. [Google Scholar]
- 111.Willard L, Ranjan A, Zhang H, Monzavi H, Boyko RF, Sykes BD, Wishart DS. VADAR: a web server for quantitative evaluation of protein structure quality. Nucl Acids Res. 2003;31:3316–3319. doi: 10.1093/nar/gkg565. [DOI] [PMC free article] [PubMed] [Google Scholar]
- 112.Fauchere JL, Pliska V. Hydrophobic parameters π of amino-acid side chains from the partitioning of N-acetyl-amino-acid amides. Eur J Med Chem-Chim Ther. 1983;18:369–375. [Google Scholar]
- 113.Team RDC. R: A language and environment for statistical computing. Vienna, Austria: R Foundation for Statistical Computing; 2008. ISBN 3-900051-07–0. Available at: http://www.R-project.org. [Google Scholar]
- 114.Frishman D, Argos P. Knowledge-based protein secondary structure assignment. Proteins. 1995;23:566–579. doi: 10.1002/prot.340230412. [DOI] [PubMed] [Google Scholar]