

Abstract
Site-directed spin labeling (SDSL) was used to investigate local structure and conformational exchange in two bacterial outer-membrane TonB-dependent transporters, BtuB and FecA. Protecting osmolytes, such as polyethylene glycols (PEGs) are known to modulate a substrate-dependent conformational equilibrium in the energy coupling motif (Ton box) of BtuB. Here, we demonstrate that a segment that is N-terminal to the Ton box in BtuB, is in conformational exchange between ordered and disordered states with or without substrate. Protecting osmolytes shift this equilibrium to favor the more ordered, folded state. However, a segment of BtuB that is C-terminal to the Ton box that is not solvent exposed is insensitive to PEGs. Protecting osmolytes also modulate a conformational equilibrium in the Ton box of FecA, with larger molecular weight PEGs producing the largest shifts in the conformational free energy. These data indicate that solvent-exposed regions of these transporters undergo conformational exchange and that regions of these transporters that are involved in protein–protein interactions sample multiple conformational substates. The sensitivity to solute provides an explanation for differences seen between two high-resolution structures of BtuB, which each likely represent one conformation from a subset of states that are normally sampled by the protein. This work also illustrates how SDSL and osmolytes may be used to characterize and quantitate conformational equilibria in membrane proteins.
Keywords: site-directed spin labeling, TonB-dependent transport, EPR spectroscopy, protein dynamics
Introduction
Proteins do not assume one unique structure but sample a range of conformational states over a wide range of timescales1,2; furthermore, protein dynamics underlies function and is a key to enzyme activity and allosteric regulation.3–5 Dynamics also underlies protein–protein recognition, which is often mediated by conserved and highly dynamic or unstructured regions of proteins.6,7 It is not precisely understood how structural fluctuations facilitate and mediate recognition, but there is considerable interest in characterizing the dynamics and conformation substates in regions that function in recognition.
A number of methods can provide information on protein dynamics and conformational exchange. Among these, site-directed spin labeling (SDSL) is a relatively new approach to investigate conformation and local dynamics in proteins,8–10 and it is particularly well-suited to examine membrane proteins or proteins in large complexes where slow rotational correlation times prohibit measurements by high-resolution NMR. The electron paramagnetic resonance (EPR) spectrum of a spin label side chain encodes information regarding the rate and amplitude of label motion, which in turn is dictated by the local structure and tertiary contact made by the spin label side chain.11 Local protein backbone fluctuations also modulate the motion of spin-labeled side chains, making EPR spectra sensitive to backbone dynamics on the ns timescale12,13; moreover, conformational transitions that result in altered local structure or tertiary contact are easily detected by EPR, as are distinct conformational substates that are in equilibrium.
SDSL has been used to examine structure and dynamics in a family of outer membrane bacterial transporters that are TonB-dependent. These transporters function in the uptake of trace nutrients, such as iron and vitamin B12, and they extract energy for active transport from the inner membrane proton potential by interacting with the inner membrane protein TonB.
The structure of the Escherichia coli vitamin B12 transporter, BtuB, (see Fig. 1) is based on a 22-stranded antiparallel β-barrel, where the first 137 residues are folded into the interior of the barrel. Near the N-terminus of BtuB (residues 6–12) lies a segment termed the Ton box, which interacts with TonB17 and is believed to mediate energy flow from the inner membrane to BtuB. High-resolution models for BtuB obtained from crystals in either a mesophase15 or detergent (micelle) phase14 reveal different conformations of the Ton box and the segment N-terminal to the Ton box. In micelles [Fig. 1(a)], the Ton box is resolved, however residues 1–5 are not. In the mesophase structure,15 which is obtained in the absence of substrate [Fig. 1(b)], residues 1–5 are resolved and the Ton box is in a similar but not identical configuration to that observed in the micelle-derived structure. There are also differences between the configurations of the extracellular loops in these structures.
Figure 1.

Three models for BtuB. (a) Apo-structure of BtuB obtained from crystals in a micelle phase (PDB ID: 1NQE),14 (b) apo-structure of BtuB obtained from crystals in mesophase (PDB ID: 2GUF),15 and (c) model for the Ton box of BtuB in the presence of substrate obtained by EPR spectroscopy.16
SDSL presents a different view of the Ton box than does the substrate bound crystal structure. Spectroscopic measurements using both continuous wave and pulse EPR indicate that the Ton box of BtuB unfolds in the presence of substrate and extends as far as 30 Å into the periplasmic space [Fig. 1(c)].16 In contrast, the Ton box remains folded in the BtuB crystal structure in the presence of substrate, with a localized change in structure about residue 7. This difference is the result of a conformational equilibrium that includes the Ton box, which is sensitive to the precipitants used in crystallography. In particular polyethelyene glycols, salts and other osmolytes are found to shift the Ton box equilibrium to a folded state, so that the conformational transition seen by EPR is effectively blocked under the solute conditions used for crystallography.18,19
In this work, SDSL is used to examine sites in BtuB and FecA that are in conformational exchange. In solvent-exposed periplasmic regions of these transporters, osmolytes such as polyethylene glycols (PEGs) are shown to drive the protein to a more folded state as a result of steric exclusion of the solute. We provide evidence that the segment encompassing residues 1–5 in BtuB is in conformational exchange between folded and disordered states, and that this segment is sensitive to solutes such as PEGs. The results provide an explanation for differences that are seen between spectroscopic and crystallographic methods and suggest that regions where the two crystal structures of BtuB differ represent sites of conformational exchange. The results also indicate that osmolytes such as PEGs when used in combination with SDSL are a powerful tool to explore conformational exchange in membrane proteins.
Results
The N-terminal region of BtuB exhibits a conformational equilibrium that is modulated by osmolytes
Site-directed mutagenesis was used to incorporate the spin-labeled side chain, R1 (Fig. 2), into the N-terminal region of BtuB (see Methods). The X-band EPR spectra from spin labels placed at positions 1–5 in BtuB are shown in Figure 3, along with the position of these sites in the BtuB meso structure. These spectra are similar to those published previously,22 and are composed of two components resulting from populations of spin labels that have different dynamics. The mobile component (labeled “m”) in these spectra is similar to that expected for R1 attached to an unstructured protein segment; and as a result, it was concluded previously that this segment was flexible.22 However, the spectra also contain a component resulting from an immobilized nitroxide in tertiary contact with the protein (labeled “i”). For the nitroxide label attached to the very N-terminus of BtuB (Q1R1), the difference between the immobile and mobile components is pronounced, and the immobile component is near the rigid limit of nitroxide motion at X-band (correlation times longer than 30–50 ns). The mobile and immobile populations of R1 may easily be estimated for the spectra obtained from positions 1, 2, 3 and 5 by spectral subtraction, and indicate that the mobile population is approximately 20% of the total signal.
Figure 2.
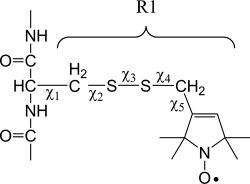
Structure of the nitroxide side chain R1. The label is linked to the protein backbone through five rotatable bonds; however, interactions between the distal sulfur and the Cα proton20 restrict rotameric conversions to X4 and X5.21
Figure 3.

(a) Structure of the N-terminal segment encompassing residues 1–5 in the model for BtuB obtained from mesophase (PDB ID: 2GUF). (b) EPR spectra from spin labels on residues 1–5 in the absence of substrate. In most of these spectra, both a mobile (m) and immobile (i) component are revealed. The immobile component in Q1R1 is near the rigid limit of nitroxide motion at X-band.
In general, multiple motional components in an EPR spectrum of R1 may arise from multiple rotameric states of the R1 side chain, or they may reflect distinct conformational states of the protein. In the present case, there is strong evidence these components reflect distinct protein conformational states. First, the dramatic difference in dynamics represented by the two components seen in the EPR spectra from N-terminus (particularly for Q1R1) is not typically seen for rotameric equilibria in the R1 side chain. Second, spectra along the N-terminus yield approximately the same ratio of mobile and immobile populations, which would not be expected if rotameric states of the label were the source of the components. Finally, as discussed below, these spectra are sensitive to the addition of osmolytes such as polyethelyene glycols (PEGs). PEGs are protecting osmolytes that stabilize a native protein fold,23 and in the case where two protein conformers are in equilibrium, PEGs are expected to lower the energy of the least hydrated conformer. Protecting osmolytes are observed to have little effect upon rotameric states of R1, probably because of the small differences in solvent-exposed areas for different rotamers.24 As a result, sensitivity to PEGs indicates that the populations in an EPR spectrum result from a protein conformational equilibrium.
Shown in Figure 4 are EPR spectra obtained from sites 1–5 of BtuB in the presence of 0 and 30% w/v PEG 3350, an osmolyte that has been shown to modulate other conformational equilibria in BtuB.18,19,25 In the absence of substrate [Fig. 4(a)], the addition of this osmolyte alters the EPR spectrum and enhances the more immobile component in the spectrum. When substrate is added [Fig. 4(b)], the fraction of the narrow, mobile component increases; however, PEG 3350 addition reverses this change and increases the immobile fraction. Since the spectra are strongly affected by osmolyte, the two components are unlikely to result from different rotameric states of R1 and must result from a protein conformational equilibrium. The addition of Ficoll 400, a 400,000 molecular weight polymer with little solute activity, produces no change in these EPR spectra (data not shown), indicating that viscosity or crowding effects are not modulating the motion of these spin-labeled side chains.
Figure 4.

EPR spectra obtained from spin labels placed at positions 1–5 in the N-terminus of BtuB in the absence (black traces) and presence (red traces) of 30% w/v PEG 3350. (a) EPR spectra of sites 1–5 in BtuB reconstituted into POPC in the absence of substrate. (b) EPR spectra of sites 1–5 in the presence of substrate. The amplitudes of these spectra are normalized relative to the same spin number, except where the scale is adjusted as indicated.
An earlier report on BtuB using SDSL indicated that the N-terminal segment (residues 1–5) was dynamic,22 which is apparently inconsistent with the mesophase crystal structure.15 However, while the mobile component in these spectra cannot be reconciled with this structure, the immobilized components in these EPR spectra (Fig. 3) are consistent with the mesophase structure [Fig. 1(b)]. For example, site 1 is buried within the protein and a nitroxide at this position would be expected to be highly immobilized. The side chain at position 4 faces outward toward the periplasmic surface at this position. As a result, the EPR spectrum should not show a highly immobilized component since the label will not be strongly influenced by the packing of this segment within the protein. Positions 1–5 are not resolved in the micelle structure [Fig. 1(a)],14 which would be expected from the highly mobile conformer seen in the EPR spectra in Figure 3. The existence of a conformational equilibrium in this segment of the protein suggests that the differences between the meso and micelle structures seen in Figure 1(a,b) may originate from this equilibrium and the different conditions used in the two crystallization procedures. In this work, we did not attempt to record spectra under identical conditions to those in the BtuB crystals, but we expect that both solutes and amphiphiles will influence the state of the N-terminal segment as they do for the Ton box of BtuB.18,26
Estimating conformational free-energy changes due to solute activity
Solutes that stabilize a native protein fold, such as sucrose and PEGs, are excluded from protein surfaces, and this exclusion of solute is sometimes referred to as preferential hydration.27 In addition to stabilizing the native protein fold, these solutes will tend to drive the protein to its least hydrated state when multiple conformations are in equilibrium.
Shown in Figure 5 are several EPR spectra for the label T3R1 at different concentrations of PEG 3350. From each of these spectra, the equilibrium between a folded and unfolded form of this segment was determined and the result plotted as a function of solution osmolality (see “Materials and Methods” section). As expected, the data yield a roughly linear dependence on solute activity and the slope of this line is positive. The slope [see Eq. (1)] may be used to estimate the apparent free-energy change in this equilibrium per molal of added solute (ΔΔG°), which is listed in Table I. Although this value can be influenced by a number of factors, it is expected to depend on the extent of solvent exposure that accompanies the conformational change and the degree of preferential hydration produced by the solute.
Figure 5.

(a) EPR spectra from T3R1 in BtuB as a function of the concentration (% w/v) of PEG3350. Increasing PEG concentration alters the EPR spectrum and increases the fraction of immobilized label. (b) Plot of −lnK versus solution osmolality for T3R1, where K is the apparent equilibrium constant for the N-terminal conformational equilibrium [see Eq. (1)].
Table I.
Conformational Free-Energy Change per Molal of Solute Activity
| Spin label | Solute | ΔΔG° (kcal/mol)a |
|---|---|---|
| BtuB | ||
| T3R1 | Sucrose | 0.35 ± 0.05 |
| T3R1 | PEG 400 | 0.16 ± 0.03 |
| T3R1 | PEG 1000 | 0.45 ± 0.05 |
| T3R1 | PEG 3350 | 0.61 ± 0.07 |
| T3R1 | PEG 6000 | 0.95 ± 0.1 |
| FecA | ||
| A81R1 | PEG 400 | 0.9 ± 0.2 |
| A81R1 | PEG 1000 | 1.1 ± 0.2 |
| A81R1 | PEG 3350 | 1.4 ± 0.3 |
| A81R1 | PEG 6000 | 1.9 ± 0.5 |
| V85R1 | PEG 400 | 1.0 ± 0.2 |
| V85R1 | PEG 1000 | 1.1 ± 0.2 |
| V85R1 | PEG 3350 | 1.9 ± 0.3 |
| V85R1 | PEG 6000 | 2.0 ± 0.5 |
Errors in the free energies are ∼20% or less and are based on the standard deviations obtained from multiple measurements.
There is evidence that PEGs are excluded from protein surfaces due to steric effects,23 and this exclusion (preferential hydration) should increase for larger molecular weight PEGs. Using T3R1, measurements of the free-energy change per molal of solute were made for the N-terminal conformational equilibrium for PEGs of varied molecular weight and for sucrose. As shown in Table I, the changes in the free-energy difference (ΔΔG°) increase as a function of the size of the PEG.
Some conformational transitions in BtuB are not sensitive to osmolytes
In BtuB, substrate binding unfolds the Ton box and several residues C-terminal to the Ton box (up to residue 15).16,22 As indicated earlier, this transition is modulated by osmolytes. Several other sites within BtuB also yield EPR spectra that are dependent on substrate addition. Shown in Figure 6(a) are EPR spectra obtained from positions 18 to 24. This stretch of residues links the Ton box to a series of β-sheets within the core of BtuB. Most of these spectra yield relatively immobile spectra near the rigid limit for nitroxide motion at X-band, consistent with crystal structures of BtuB showing that they are buried within the protein. Changes in lineshape at positions 18 and 23 are observed in the presence of substrate, and involve a decrease and increase in nitroxide motion, respectively. The label at position 23 [Fig. 6(c)] is expected to face the outer barrel of BtuB, and the changes in this spectrum likely reflect an increase in the distance between site 23 and the barrel on substrate binding. For both P18R1 and L23R1, the spectra were examined in the presence and absence of the osmolyte PEG 3350, both with and without substrate. The spectra are unchanged from those seen in Figure 6(a) (data not shown), indicating that osmolytes do not modulate the conformation of this region of the protein. In general, osmolytes have not been observed to alter the EPR spectra from sites within the core of BtuB. This is expected for sites that do not undergo conformational exchange or are not coupled to conformational transitions that involve a significant change in hydration. Spectra at structurally stable sites, for example within the Ton box in the absence of substrate, are also not observed to change in the presence of osmolytes.18
Figure 6.

(a) EPR spectra obtained from positions 18–24 in BtuB in the absence (black trace) and presence (red trace) of vitamin B12. (b) Location of the spin label P18R1 and (c) location of the spin label L23R1 within the crystal structure of BtuB (PDB ID: 1NQE). The EPR spectra indicate the existence of a substrate-driven conformational change; however, unlike the BtuB Ton box, these spectra are insensitive to the addition of osmolytes.
The Ton box conformation in FecA undergoes a substrate-dependent disordering that is sensitive to osmolytes
Previous work using SDSL demonstrated that the Ton box of FecA, the Escherichia coli ferric citrate transporter, also displayed a substrate-dependent disorder transition on substrate addition.28 Spectra from two sites in the Ton box of FecA, L82R1 and V85R1, are shown in Figure 7. Substrate addition narrows the lineshapes and increases the amplitudes of the EPR spectra from the FecA Ton box [Fig. 7(b)], similar to that seen for the BtuB Ton box. The Ton box of this transporter is sensitive to the addition of protecting osmolytes such as PEGs. On the addition of PEG 1000 (following the addition of ferric citrate), the motion of R1 decreases dramatically, yielding spectra similar to but not identical to those of the substrate-free state [Fig. 7(c)]. As a control for the effect of viscosity or crowding, Ficoll 400 added at an equivalent viscosity (following ferric citrate addition) produces no change in the EPR spectra from L82R1 or V85R1. This result indicates that this segment of FecA is in conformational exchange following the addition of substrate.
Figure 7.

(a) Spectra from sites 82 and 85 within the Ton box of FecA. (b) Spectra in the presence of substrate (ferric citrate or FC) indicate an increase in backbone dynamics and a disordering of the Ton box. (c) Spectra in the presence of substrate with the addition of PEG 1000 (30% w/v) indicate a decrease in nitroxide motion reflecting an ordering in the Ton box. (d) EPR spectra in the presence of substrate but with the addition of Ficoll 400 at a solution viscosity (∼17% w/v) that matches the viscosity of the PEG solution.
To determine the effect of osmolyte on the FecA Ton box equilibrium, EPR spectra from V85R1 were recorded as a function of the concentration of PEG, and the equilibrium plotted as a function of solution osmolality. Shown in Figure 8(b) are a series of EPR spectra for V85R1 as a function of solute (PEG 1000) concentration. Also shown is a plot of the log of the equilibrium constant for unfolded and folded forms of the FecA Ton box as a function of solution osmolality for PEG 1000. The conformational free-energy changes produced by solute addition are given in Table I for two positions in the Ton box of FecA and as a function of the size of the osmolyte. At each site, the free-energy change (ΔΔG°) per molal of solute is found to increase as a function of PEG size, as seen for the N-terminus of BtuB. This is consistent with the observation that PEGs are excluded from protein surfaces as a result of steric interactions23 (see “Discussion” section). Moreover, each site yields similar values for the free-energy change with increasing PEG molecular weight, indicating that both spin labels are reporting on the same conformational equilibrium.
Figure 8.

(a) Position of the Ton box (highlighted in a stick configuration) in the apo-crystal structure of FecA (PDB ID: 1KMO). (b) EPR spectra from V85R1 at increasing concentrations of PEG 1000. Both a slow or immobile (i) and fast or mobile (m) motional components are revealed in the EPR spectra, and PEG 1000 addition shifts the conformational equilibrium and increases the fraction of Ton box in the more ordered (immobile) form. (c) Plots of the apparent equilibrium constant measured from V85R1 as a function of solution osmolality for PEG 1000.
Discussion
Osmolytes may act to stabilize or destabilize the native structures of proteins. Solutes that destabilize proteins, such as urea, interact with the protein, lowering the free energy of the unfolded state relative to the folded state.29 Osmolytes that stabilize proteins include a wide range of naturally occurring solutes such as trimethylamine-N-oxide, glycine betaine, glycerol, sucrose, and trehalose as well as synthetic PEGs.30 These stabilizing solutes are known to be excluded from protein surfaces leading to preferential hydration of the protein.31 Preferential hydration lowers the free energy of the folded state relative to the unfolded state, and stabilizing osmolytes have the ability to modulate protein structure in regions where there is conformational exchange, provided that these conformations are different in their exposure to the solvent.27,32,33 EPR spectroscopy provides an ideal approach to examine protein conformational exchange. At X-band, the spectroscopic timescale is sufficiently fast to allow different protein states to be resolved in an EPR spectrum; as a result, SDSL can be used to examine the sensitivity to osmolyte and conformational equilibria in select regions of proteins.24
In this study, conformational exchange is demonstrated at the N-terminus of BtuB and in the Ton box of FecA. At least two motional components are found in the EPR spectra from R1 placed within the N-terminal five residues of BtuB. These components result from a conformational equilibrium that exists between folded and disordered forms of this segment, and protecting osmolytes shift the equilibrium toward the folded state. EPR spectra from the energy-coupling segment (Ton box) of FecA are also sensitive to protecting osmolytes and indicate that this segment samples at least two conformations. Previous work has demonstrated a similar sensitivity to osmolytes in the Ton box of BtuB18,19 and in the extracellular loops of both BtuB and FecA.25
The N-terminal periplasmic segment and the extracellular loops of FecA and BtuB are regions of these transporters that are involved in protein–protein or protein–ligand interactions, and the existence of conformational exchange in these regions likely has functional significance. Regions involved in molecular recognition are frequently dynamic or unstructured, and the existence of conformational substates, as seen by EPR spectroscopy, is consistent with models for protein–protein recognition that have implicated ensemble sampling, induced fit, and conformation selection.34–36
Previous work using SDSL demonstrated that the Ton box unfolds 20–30 Å into the periplasmic space on the addition of substrate. The addition of osmolytes, such as PEG 3350, refolds the Ton box to a configuration that resembles the apo-state of BtuB.18 For this equilibrium, the free-energy change on the addition of PEG is approximately two to three times that observed for the segment encompassing residues 1–5. This is expected, since the conformational event that unfolds the Ton box involves a significantly larger segment of protein, and a larger change in solvent-exposed surface area. The BtuB Ton box is also more sensitive to solute than is the FecA Ton box. The Ton box unfolding in BtuB appears to leave behind a cavity,19 which may lead to a larger preferential hydration than in the case of the FecA Ton box. EPR spectroscopy indicates that the extracellular ligand binding loops of BtuB and FecA are modulated by PEGs. In the presence of osmolyte, these loops assume a more compact less hydrated configuration, and the second extracellular loop of BtuB moves ∼2–3 Å in response to the addition of PEG 3350.25 The apparent conformational free-energy change due to osmolyte addition is much larger for the BtuB loops than the Ton box, suggesting that the conformational substates that are sampled in these loops involve significant differences in hydration.
For both the FecA Ton box and the N-terminus of BtuB, we measured the sensitivity of the free-energy shift due to solute as a function of the size of the protecting osmolyte (Table I). For site T3R1 in the N-terminus of BtuB and both sites examined within the Ton box of FecA, ΔΔG° is found to increase with the molecular weight of the added PEG. PEGs are excluded from protein-solution interfaces due to steric exclusion,23 and since steric exclusion should increase as a function of the polymer size, the behavior seen in Table I is expected. A conformational equilibrium such as the opening of an ion channel involves the formation cavity or pore. In these cases, a molecular weight cutoff is expected, because PEGs beyond a certain size are fully excluded from the cavity.37,38 The values of ΔΔG° seen for the two FecA sites in Table I increase more dramatically for the largest molecular weight PEGs, which might be due to some exclusion from a cavity that is formed after the Ton box unfolds.
As indicated earlier, X-ray diffraction of BtuB crystallized either in a meso15 or detergent phase14 yields structural models with different configurations for the extracellular ligand binding loops, the Ton box and the N-terminal five residues. The mesophase structure is obtained from protein that is crystallized into a cubic mesophase formed from monoolein, while the detergent phase structure is obtained from protein crystallized into micelles formed from the oligo-oxyethylene detergent C8E4. In both cases, precipitants are used to drive crystallization. Does one of these models represent a better or more accurate structure? While the mesophase structure is of higher resolution and yields a completely resolved N-terminus, the results of SDSL presented here and elsewhere indicate that regions where these structures differ are in conformational exchange.19,25 At least one explanation for the differences between the two crystal structures is that the different conditions used for crystallography trap the protein in different conformational substates. As a result, these two models likely present different conformers among a subset of conformers that are sampled by the protein in bilayers.
In summary, protecting osmolytes used in combination with SDSL provide a powerful tool to probe regions of membrane proteins that are in conformational exchange. The conformers that are normally sampled by a protein may be important in understanding molecular recognition events, and SDSL provides a means to characterize these conformers. EPR spectra from the N-terminal segment of BtuB and the Ton box of FecA are sensitive to protecting osmolytes, indicating that these protein segments sample conformational substates in equilibrium. Furthermore, high concentrations of osmolytes, such as PEGs, shift regions in conformational exchange to a more compact less hydrated state. As expected, segments within the core of the protein that are not solvent exposed are not sensitive to osmolytes. This work suggests that differences between the high-resolution structures that have been obtained for BtuB are the result of conformational exchange that normally takes place within this membrane protein.
Materials and Methods
Mutagenesis, expression, purification, and spin labeling
Plasmids harboring wild-type FecA, pIS711,39 were generously provided by Dr. Volkmar Braun (University of Tübingen, Germany), and the plasmid was used as template to introduce a single cysteine mutation into the Ton box at positions A81C, L82C, and V85C using the Quick Change Site Directed Mutagenesis Kit (Stratagene, La Jolla, CA). Proteins containing a single cysteine mutation were overexpressed in an E. coli BL21(DE3) strain lacking all the outer membrane porins such as OmpA, OmpC, and LamB.40 Cells were grown in LB media containing 100 μg/mL ampicillin, and transcription of FecA was initiated by addition of isopropyl-β-d-thiogalactoside to a final concentration of 0.6 mM.
For BtuB, the Quick Change Site Directed Mutagenesis Kit was used to produce the five single-cysteine BtuB mutants (Q1C, D2C, T3C, S4C, and P5C) used in this work. The mutants were overexpressed in the E. coli strain RK5016 (metE).41 Cells were grown in minimal “A” media containing 100 μg/mL ampicillin and supplemented with 0.24% w/v glucose, 150 μM thiamine, 3 mM MgSO4, 300 μM CaCl2, and 0.01% w/v of Met and Arg.
For both FecA and BtuB, outer membranes were prepared, solubilized and spin labeled with 1-oxyl-2,2,5,5-tetramethyl-3-pyrroline-3-methyl methanethiosulfonate (MTSL, Toronto Research Chemicals, North York, ON, Canada) to introduce the spin-labeled side chain, R1 (Fig. 2), as previously described.42 The protein was purified, reconstituted into POPC vesicles as described previously,43 and samples were concentrated using a Beckman Airfuge.
Sample preparation and EPR measurements
For FecA, ferric citrate (Sigma, St. Louis, MO) was added from a stock solution to a final concentration of 2 mM. For BtuB, a stock solution of vitamin B12 was mixed with the protein sample to give a final concentration of 1 mM, about 200 times the KD of the interaction between BtuB and B12.44 For these two proteins, a series of five freeze–thaw cycles were performed in liquid nitrogen to ensure that the substrate was uniformly distributed within the membrane sample. For titrations of the EPR spectrum with PEG, appropriate amounts of a 50% w/v PEG stock solution were mixed with the reconstituted sample, and five freeze–thaw cycles were performed. For each PEG solution, solution osmolalities were measured using a Wescor 5500 vapor pressure osmometer (Logan, UT).
EPR measurements were performed on 5 μL of sample loaded into glass capillaries with 0.6 mm i.d. × 0.84 mm o.d. (VitroCom, Mountain Lakes, NJ). These samples had protein concentrations ranging from 200 to 500 μM. EPR spectra were obtained on a Varian E-line 102 Century series X-band spectrometer with a loop gap resonator (Medical Advances, Milwaukee, WI). LabVIEW software, which was generously provided by Drs. Christian Altenbach and Wayne Hubbell (University of California, Los Angeles, CA), was used for digital collection and analysis of data. All spectra were taken using a 2 mW incident microwave power and a 1 G p-p modulation amplitude. The scan range was 100 G, and the spectra were normalized to equivalent spin numbers.
Solute activity and conformational free energy
The equilibrium between two protein conformational states may be defined by an equilibrium constant, K, which represents the ratio of the populations of these conformations. In the present case, i and m are used to represent folded (immobile R1 side chain) and unfolded (mobile R1 side chain) conformations of a specific protein segment where K = Nm/Ni. To obtain K from the EPR spectrum, the spectrum is assumed to be a composite or sum of two spectra resulting from the two conformational states. The equilibrium constant was obtained by spectral subtraction as described previously.19 Briefly, a spectrum that simulated the mobile component of the R1 spin label was subtracted from the experimentally determined EPR spectrum to obtain the spectrum corresponding to the immobilized spin label. The percentage of free spin required to generate the immobile spectrum was then taken as the percentage of the mobile component observed. It should be noted that the actual relative heights between the mobile and immobile spectral peaks in the first derivative EPR spectrum do not correlate directly with the percentage of mobile and immobile components that are present.
The dependence of the equilibrium constant on osmolyte concentration is expected to have the following behavior45:
| 1 |
where C is the solute concentration and m is a parameter that reflects a free-energy change per unit solute concentration.25 Solutes that specifically interact with the protein and promote unfolding of the protein (urea and gunidinium) yield a negative value of m. Solutes such as PEGs and sucrose yield a positive value of m. In the present case, we will use the solution osmolality in place of C, which includes effects of the solution nonideality. For the PEGs used here, plots of lnK versus osmolality are roughly linear, and a linear fit to the data yields an estimate of m. This slope (in units of RT) may be reported as the change in ΔG for the protein conformational equilibrium (or ΔΔG°) per molal of solute activity. To ensure that the effects on the EPR spectra due to PEG addition were not the result of viscosity or crowding effects, Ficoll 400 was added to a concentration of 17% w/v, which approximates the viscosity of the 30% PEGs solutions used here.
References
- 1.Frauenfelder H, Sligar SG, Wolynes PG. The energy landscapes and motions of proteins. Science. 1991;254:1598–1603. doi: 10.1126/science.1749933. [DOI] [PubMed] [Google Scholar]
- 2.Henzler-Wildman K, Kern D. Dynamic personalities of proteins. Nature. 2007;450:964–972. doi: 10.1038/nature06522. [DOI] [PubMed] [Google Scholar]
- 3.Swain JF, Gierasch LM. The changing landscape of protein allostery. Curr Opin Struct Biol. 2006;16:102–108. doi: 10.1016/j.sbi.2006.01.003. [DOI] [PubMed] [Google Scholar]
- 4.Bahar I, Chennubhotla C, Tobi D. Intrinsic dynamics of enzymes in the unbound state and relation to allosteric regulation. Curr Opin Struct Biol. 2007;17:633–640. doi: 10.1016/j.sbi.2007.09.011. [DOI] [PMC free article] [PubMed] [Google Scholar]
- 5.Henzler-Wildman KA, Lei M, Thai V, Kerns SJ, Karplus M, Kern D. A hierarchy of timescales in protein dynamics is linked to enzyme catalysis. Nature. 2007;450:913–916. doi: 10.1038/nature06407. [DOI] [PubMed] [Google Scholar]
- 6.Romero P, Obradovic Z, Dunker AK. Natively disordered proteins: functions and predictions. Appl Bioinform. 2004;3:105–113. doi: 10.2165/00822942-200403020-00005. [DOI] [PubMed] [Google Scholar]
- 7.Dunker AK, Cortese MS, Romero P, Iakoucheva LM, Uversky VN. Flexible nets. The roles of intrinsic disorder in protein interaction networks. FEBS J. 2005;272:5129–5148. doi: 10.1111/j.1742-4658.2005.04948.x. [DOI] [PubMed] [Google Scholar]
- 8.Hubbell WL, Gross A, Langen R, Lietzow MA. Recent advances in site-directed spin labeling of proteins. Curr Opin Struct Biol. 1998;8:649–656. doi: 10.1016/s0959-440x(98)80158-9. [DOI] [PubMed] [Google Scholar]
- 9.Hubbell WL, Cafiso DS, Altenbach CA. Identifying conformational changes with site-directed spin labeling. Nat Struct Biol. 2000;7:735–739. doi: 10.1038/78956. [DOI] [PubMed] [Google Scholar]
- 10.Fanucci GE, Cafiso DS. Recent advances and applications of site-directed spin labeling. Curr Opin Struct Biol. 2006;16:644–653. doi: 10.1016/j.sbi.2006.08.008. [DOI] [PubMed] [Google Scholar]
- 11.Mchaourab H, Lietzow M, Hideg K, Hubbell W. Motion of spin-labeled side-chains in T4 lysozyme. I. Correlation with protein structure and dynamics. Biochemistry. 1996;35:7692–7704. doi: 10.1021/bi960482k. [DOI] [PubMed] [Google Scholar]
- 12.Columbus L, Hubbell WL. A new spin on protein dynamics. Trends Biochem Sci. 2002;27:288–295. doi: 10.1016/s0968-0004(02)02095-9. [DOI] [PubMed] [Google Scholar]
- 13.Columbus L, Hubbell WL. Mapping backbone dynamics in solution with site-directed spin labeling: GCN4-58 bZip free and bound to DNA. Biochemistry. 2004;43:7273–7287. doi: 10.1021/bi0497906. [DOI] [PubMed] [Google Scholar]
- 14.Chimento DP, Mohanty AK, Kadner RJ, Wiener MC. Substrate-induced transmembrane signaling in the cobalamin transporter BtuB. Nat Struct Biol. 2003;10:394–401. doi: 10.1038/nsb914. [DOI] [PubMed] [Google Scholar]
- 15.Cherezov V, Yamashita E, Liu W, Zhalnina M, Cramer WA, Caffrey M. In meso structure of the cobalamin transporter, BtuB, at 1.95 A resolution. J Mol Biol. 2006;364:716–734. doi: 10.1016/j.jmb.2006.09.022. [DOI] [PMC free article] [PubMed] [Google Scholar]
- 16.Xu Q, Ellena JF, Kim M, Cafiso DS. Substrate-dependent unfolding of the energy coupling motif of a membrane transport protein determined by double electron-electron resonance. Biochemistry. 2006;45:10847–10854. doi: 10.1021/bi061051x. [DOI] [PMC free article] [PubMed] [Google Scholar]
- 17.Postle K, Kadner R. Touch and go: tying TonB to transport. Mol Microbiol. 2003;49:869–882. doi: 10.1046/j.1365-2958.2003.03629.x. [DOI] [PubMed] [Google Scholar]
- 18.Fanucci GE, Lee JY, Cafiso DS. Spectroscopic evidence that osmolytes used in crystallization buffers inhibit a conformation change in a membrane protein. Biochemistry. 2003;42:13106–13112. doi: 10.1021/bi035439t. [DOI] [PubMed] [Google Scholar]
- 19.Kim M, Xu Q, Fanucci GE, Cafiso DS. Solutes modify a conformational transition in a membrane transport protein. Biophys J. 2006;90:2922–2929. doi: 10.1529/biophysj.105.078246. [DOI] [PMC free article] [PubMed] [Google Scholar]
- 20.Guo Z, Cascio D, Hideg K, Kalai T, Hubbell WL. Structural determinants of nitroxide motion in spin-labeled proteins: tertiary contact and solvent-inaccessible sites in helix G of T4 lysozyme. Protein Sci. 2007;16:1069–1086. doi: 10.1110/ps.062739107. [DOI] [PMC free article] [PubMed] [Google Scholar]
- 21.Columbus L, Kalai T, Jeko J, Hideg K, Hubbell WL. Molecular motion of spin labeled side chains in a-helices: analysis by variation of side chain structure. Biochemistry. 2001;40:3228–3846. doi: 10.1021/bi002645h. [DOI] [PubMed] [Google Scholar]
- 22.Fanucci GE, Coggshall KA, Cadieux N, Kim M, Kadner RJ, Cafiso DS. Substrate-induced conformational changes of the perplasmic N-terminus of an outer-membrane transporter by site-directed spin labeling. Biochemistry. 2003;42:1391–1400. doi: 10.1021/bi027120z. [DOI] [PubMed] [Google Scholar]
- 23.Arakawa T, Timasheff SN. Mechanism of poly(ethylene glycol) interaction with proteins. Biochemistry. 1985;24:6756–6762. doi: 10.1021/bi00345a005. [DOI] [PubMed] [Google Scholar]
- 24.Lopez CJ, Fleissner MR, Guo Z, Kusnetzow AK, Hubbell WL. Osmolyte perturbation reveals conformational equilibria in spin-labeled proteins. Protein Sci. 2009;18:1637–1652. doi: 10.1002/pro.180. [DOI] [PMC free article] [PubMed] [Google Scholar]
- 25.Kim M, Xu Q, Murray D, Cafiso DS. Solutes alter the conformation of the ligand binding loops in outer membrane transporters. Biochemistry. 2008;47:670–679. doi: 10.1021/bi7016415. [DOI] [PubMed] [Google Scholar]
- 26.Fanucci GE, Lee JY, Cafiso DS. Membrane mimetic environments alter the conformation of the outer membrane protein BtuB. J Am Chem Soc. 2003;125:13932–13933. doi: 10.1021/ja0376442. [DOI] [PubMed] [Google Scholar]
- 27.Timasheff SN. Protein hydration, thermodynamic binding, and preferential hydration. Biochemistry. 2002;41:13473–13482. doi: 10.1021/bi020316e. [DOI] [PubMed] [Google Scholar]
- 28.Kim M, Fanucci GE, Cafiso DS. Substrate-dependent transmembrane signaling in TonB-dependent transporters is not conserved. Proc Natl Acad Sci USA. 2007;104:11975–11980. doi: 10.1073/pnas.0702172104. [DOI] [PMC free article] [PubMed] [Google Scholar]
- 29.Timasheff SN, Xie G. Preferential interactions of urea with lysozyme and their linkage to protein denaturation. Biophys Chem. 2003;105:421–448. doi: 10.1016/s0301-4622(03)00106-6. [DOI] [PubMed] [Google Scholar]
- 30.Bolen DW. Effects of naturally occurring osmolytes on protein stability and solubility: issues important in protein crystallization. Methods. 2004;34:312–322. doi: 10.1016/j.ymeth.2004.03.022. [DOI] [PubMed] [Google Scholar]
- 31.Timasheff SN. Control of protein stability and reactions by weakly interacting cosolvents: the simplicity of the complicated. Adv Protein Chem. 1998;51:355–432. doi: 10.1016/s0065-3233(08)60656-7. [DOI] [PubMed] [Google Scholar]
- 32.Zimmerberg J, Bezanilla F, Parsegian VA. Solute inaccessible aqueous volume changes during opening of the potassium channel of the squid giant axon. Biophys J. 1990;57:1049–1064. doi: 10.1016/S0006-3495(90)82623-0. [DOI] [PMC free article] [PubMed] [Google Scholar]
- 33.Colombo MF, Rau DC, Parsegian VA. Protein solvation in allosteric regulation: a water effect on hemoglobin. Science. 1992;256:1335–1336. doi: 10.1126/science.1585178. [DOI] [PubMed] [Google Scholar]
- 34.Goh CS, Milburn D, Gerstein M. Conformational changes associated with protein-protein interactions. Curr Opin Struct Biol. 2004;14:104–109. doi: 10.1016/j.sbi.2004.01.005. [DOI] [PubMed] [Google Scholar]
- 35.Grunberg R, Leckner J, Nilges M. Complementarity of structure ensembles in protein-protein binding. Structure. 2004;12:2125–2136. doi: 10.1016/j.str.2004.09.014. [DOI] [PubMed] [Google Scholar]
- 36.Chaudhury S, Gray JJ. Conformer selection and induced fit in flexible backbone protein-protein docking using computational and NMR ensembles. J Mol Biol. 2008;381:1068–1087. doi: 10.1016/j.jmb.2008.05.042. [DOI] [PMC free article] [PubMed] [Google Scholar]
- 37.Vodyanoy I, Bezrukov SM, Parsegian VA. Probing alamethicin channels with water-soluble polymers. Size-modulated osmotic action. Biophys J. 1993;65:2097–2105. doi: 10.1016/S0006-3495(93)81245-1. [DOI] [PMC free article] [PubMed] [Google Scholar]
- 38.Parsegian VA, Rand RP, Rau DC. Macromolecules and water: probing with osmotic stress. Methods Enzymol. 1995;259:43–94. doi: 10.1016/0076-6879(95)59039-0. [DOI] [PubMed] [Google Scholar]
- 39.Kim I, Stiefel A, Plantor S, Angerer A, Braun V. Transcription induction of the ferric citrate transport genes via the N-terminus of the FecA outer membrane protein, the Ton system and the electrochemical potential of the cytoplasmic membrane. Mol Microbiol. 1997;23:333–344. doi: 10.1046/j.1365-2958.1997.2401593.x. [DOI] [PubMed] [Google Scholar]
- 40.Prilipov A, Phale PS, Van Gelder P, Rosenbusch JP, Koebnik R. Coupling site-directed mutagenesis with high-level expression: large scale production of mutant porins from E. coli. FEMS Microbiol Lett. 1998;163:65–72. doi: 10.1111/j.1574-6968.1998.tb13027.x. [DOI] [PubMed] [Google Scholar]
- 41.Heller K, Kadner RJ. Nucleotide sequence of the gene for the vitamin B12 receptor protein in the outer membrane of Escherichia coli. J Bacteriol. 1985;161:904–908. doi: 10.1128/jb.161.3.904-908.1985. [DOI] [PMC free article] [PubMed] [Google Scholar]
- 42.Coggshall KA, Cadieux N, Piedmont C, Kadner R, Cafiso DS. Transport-defective mutations alter the conformation of the energy-coupling motif of an outer membrane transporter. Biochemistry. 2001;40:13946–13971. doi: 10.1021/bi015602p. [DOI] [PubMed] [Google Scholar]
- 43.Fanucci GE, Cadieux N, Piedmont CA, Kadner RJ, Cafiso DS. Structure and dynamics of the β-barrel of the membrane transporter BtuB by site-directed spin labeling. Biochemistry. 2002;41:11543–11551. doi: 10.1021/bi0259397. [DOI] [PubMed] [Google Scholar]
- 44.Bradbeer C, Gudmundsdottir A. Interdependence of calcium and cobalamin binding by wild-type and mutant BtuB protein in the outer membrane of Escherichia coli. J Bacterial. 1990;172:4919–4926. doi: 10.1128/jb.172.9.4919-4926.1990. [DOI] [PMC free article] [PubMed] [Google Scholar]
- 45.Rosgen J, Pettitt BM, Bolen DW. Protein folding, stability, and solvation structure in osmolyte solutions. Biophys J. 2005;89:2988–2997. doi: 10.1529/biophysj.105.067330. [DOI] [PMC free article] [PubMed] [Google Scholar]