Abstract
Objectives:
Lacunar strokes account for 25% of all ischemic strokes and may represent the cerebral manifestation of a systemic small vessel vasculopathy of unknown etiology. Altered retinal vessel fractal dimensions may act as a surrogate marker for diseased cerebral vessels. We used a cross-sectional study to investigate fractal properties of retinal vessels in lacunar stroke.
Methods:
We recruited patients presenting with lacunar stroke and patients with minor cortical stroke as controls. All patients were examined by a stroke expert and had MRI at presentation. Digital retinal photographs were taken of both eyes. Monofractal and multifractal analyses were performed with custom-written semiautomated software.
Results:
We recruited 183 patients. Seventeen were excluded owing to poor photographic quality, leaving 166 patients (86 with lacunar and 80 with cortical stroke). The mean age was 67.3 years (SD 11.5 years). The patients with lacunar stroke were younger but the prevalence of diabetes, hypertension, and white matter hyperintensities did not differ between the groups. The mean Dbox (monofractal dimension) was 1.42 (SD 0.02), the mean D0 (multifractal dimension) 1.67 (SD 0.03). With multivariate analysis, decreased Dbox and D0 (both representing decreased branching complexity) were associated with increasing age and lacunar stroke subtype after correcting for hypertension, diabetes, stroke severity, and white matter hyperintensity scores.
Conclusions:
Lacunar stroke subtype and increasing age are associated with decreased fractal dimensions, suggesting a loss of branching complexity. Further studies should concentrate on longitudinal associations with other manifestations of cerebral small vessel disease.
Cerebral small vessel disease causes lacunar stroke.1 There is increasing evidence that small vessel disease is a systemic vascular disorder2 although the exact nature of the small vessel abnormality is uncertain. Current imaging techniques cannot adequately visualize the small vessels in the brain and postmortem studies are limited. The retinal blood vessels have similar size and physiology to the cerebral small vessels.3 Certain retinal microvascular abnormalities are associated with stroke4 and white matter disease,5 differ in small and large artery stroke,6,7 and may act as a surrogate marker for cerebral small vessel disease. Previous studies have focused on retinopathy,8 vessel widths,6,7 or simple geometric abnormalities9,10 in cerebral small vessel disease, but have only found small differences, perhaps reflecting a low sensitivity for identification of subtle changes.
Fractal analysis is a method of quantifying complex geometric patterns in biological structures such as the retinal vascular tree. The fractal dimension is a measure of the degree of branching complexity of a structure and fractal analysis is a sensitive method to identify subtle differences in structures.11 Initially, retinal fractal assessment was laborious, precluding large sample sizes, but we have developed a computer-assisted and quick automated technique.12
We investigated the fractal properties of the retinal vessels in patients with clinical and MRI features of lacunar stroke and a control group of patients with cortical ischemic stroke to avoid confounding by common vascular risk factors to test the hypothesis that patients with lacunar stroke (a marker of cerebral small vessel disease) will have altered fractal properties.
METHODS
We prospectively recruited patients with clinical ischemic lacunar and minor cortical stroke seen at our hospital stroke service, aiming to recruit all relevant patients as consecutively as possible. We used patients with cortical stroke as controls because they have similar risk factor profiles and medications to patients with lacunar stroke, thus controlling for potential confounders and allowing us to identify any findings specific to small vessel as opposed to large artery atherothromboembolic stroke. Normal age-matched controls or a nonstroke control group would only allow us to identify differences due to having a stroke of any type and not those associated specifically with lacunar stroke. We excluded patients with contraindications to magnetic resonance, hemorrhagic stroke, or severe stroke (equating to total anterior circulation stroke), as these patients would not have been able to participate in retinal photography and the disease mechanisms for severe infarction are present in those with minor cortical stroke.
All patients were examined at presentation by an experienced stroke physician. We assessed stroke severity with the National Institutes of Health Stroke Scale13 and classified the stroke clinical syndrome (lacunar or cortical) according to the Oxfordshire Community Stroke Project classification.14 We used a risk factor–free definition to avoid confounding.15 We defined minor cortical stroke syndrome as a maximum clinical deficit of weakness or sensory loss in the face, arm, or leg, or loss of higher cerebral dysfunction (dysphasia or neglect), or weakness in more than one limb in the presence of loss of higher cerebral function (all in keeping with a partial anterior circulation stroke), or a homonymous hemianopia suggestive of occipital cortical infarct (in keeping with a cortical posterior circulation stroke).14 We defined lacunar stroke as per the classic lacunar syndromes (pure motor weakness or sensory loss or both in face and arm, arm and leg, or all 3, ataxic hemiparesis or clumsy hand dysarthria syndrome). We also classified stroke subtype using radiologic criteria, i.e., whether the recent infarct on MRI was cortical or lacunar, and used both the clinical and radiologic classification to assign a final stroke subtype classification. Where the clinical classification differed from the radiologic classification, the radiologic classification was used, because using clinical criteria alone may result in misclassification of cortical and lacunar infarcts in up to 20% of cases.16
Patients underwent usual investigations for stroke (brain imaging as below, carotid Doppler ultrasound, electrocardiogram, blood tests, and other tests if indicated). We recorded personal medical history of diabetes, hypertension, ischemic heart disease, and peripheral vascular disease.
Patients had cerebral MRI at presentation, on a 1.5-T magnetic resonance scanner (Signa LX; General Electric) with 22 mT m−1 maximum strength gradients. Diagnostic MRI included axial diffusion-weighted, T2-weighted, fluid-attenuated inversion recovery, and gradient echo sequences (details available on request).
All patients had 6-field retinal photography (centered on the disc, macula, lateral macula, nasal to the disc, upper arcade, and lower arcade) of the left and right eyes, with 1% tropicamide eyedrops where mydriasis was necessary, using a Canon CR-DGi digital retinal camera (Canon USA Inc.). Photographs were taken within 4 weeks of stroke onset.
MRI analysis.
All MRI scans were coded for the presence, location, and size of the recent infarct and any old infarcts or hemorrhages and white matter hyperintensities by an experienced neuroradiologist. A recent infarct was a hyperintense area on diffusion imaging with corresponding reduced signal on apparent diffusion coefficient with or without increased signal on fluid-attenuated inversion recovery or T2-weighted imaging, in a distribution compatible with an arterial territory. Recent lacunar infarcts were in the cerebral hemispheric white matter, basal ganglia, or brainstem and <2 cm diameter (subcortical lesions >2 cm were classed as striatocapsular or cortical as they are caused by large artery disease). Scans were coded (from 0 to 3) for deep and periventricular WMH according to the Fazekas scale.17
Retinal image analysis.
Retinal images were analyzed in Matlab (The Mathworks Inc.). We combined fractal analysis with an automatic vessel segmentation procedure to speed up analysis. We found that the left and right eye fractal dimensions were correlated (Pearson coefficient 0.53) and we therefore chose the right eye where available for analysis which was blinded to other clinical details.
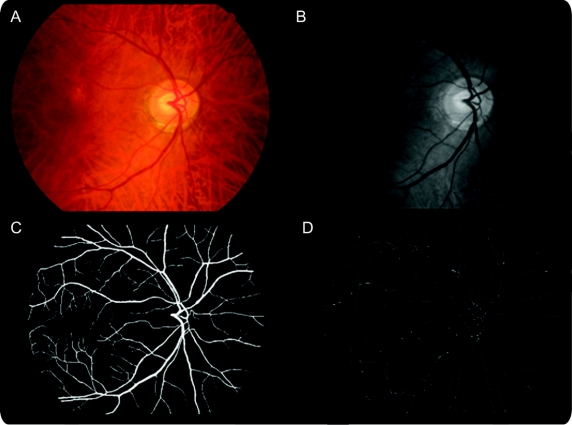
We converted color images (figure 1A) to grayscale (figure 1B). We then segmented the retinal vascular tree (arterioles and venules) using an algorithm previously described18 which denotes each pixel in the retinal image as being vessel or nonvessel to produce segmented images (figure 1C). We trained and tested our implementation of this algorithm using a set of 20 retinal images that had been manually segmented by 2 human observers. Before fractal analysis, we manually inspected and corrected each computational segmented image removing obvious artifacts such as noise introduced by areas of low contrast in the image and “ring” object caused by dust on the camera face. We then skeletonized each image (figure 1D) using Matlab's bwmorph algorithm, which is based on iterative deletion of pixels.19
Figure 1 Retinal images showing the processing, segmentation, and skeletonization steps
Top left image (A) is the original color image which is processed to grayscale (top right B) which is then segmented to produce the bottom left image (C). Finally, this image is skeletonized to produce the bottom right image (D) upon which fractal analyses are based.
Fractal dimensions can be assessed using a monofractal or a multifractal approach.20 We measured the monofractal dimension (Dbox) using the box-counting technique. We covered the skeletonized image with a number of equally sized square boxes and then counted how many of these boxes contained part of the skeletonized retinal vascular tree. We repeated this process with multiple different sized boxes, each time counting how many boxes contained part of the retinal vascular tree and recording the size of the box. We then plotted the logarithm of the number of boxes containing part of the retinal vascular tree against the logarithm of the size of the box (figure e-1 on the Neurology® Web site at www.neurology.org). The fractal dimension (Dbox) was the slope of the best fit line of these points.
Multifractal techniques are considered to be better suited to characterizing complex spatial arrangements such as the retinal arteriolar tree which may represent a composite of many monofractal dimensions.20 A multifractal approach calculates multiple fractal dimensions from randomly chosen points (in this case, 1,000 points) within the skeletonized vascular tree (rather than just one dimension from one run with the monofractal approach).
To calculate the multifractal dimensions of the retinal vascular tree we used the generalized sandbox method.20 We investigated the effect of scale on the fractal dimension and found that the retinal tree clearly exhibited multifractal properties as the fractal dimension changed when different scales were used. If the retinal vasculature was a simple monofractal, the fractal dimension would be constant. With multifractal analysis we denoted dimension D0 as the most appropriate measure of the fractal properties of the retinal vascular tree as it appeared the most sensitive scale to small vascular changes.
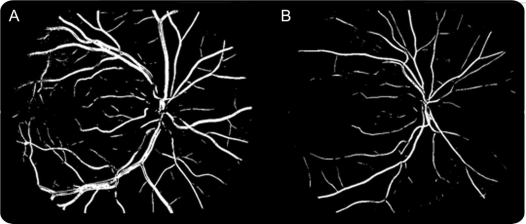
When a fractal dimension is calculated from a retinal vascular tree there is a confidence interval or uncertainty associated with it that is calculated during the fitting of the straight line to the logarithm graph. Confidence intervals associated with multifractal analysis are very small, i.e., <1%. We found this to be much lower than the uncertainties from monofractal analysis, which were in the order of 14%. We assessed both monofractal and multifractal properties of the retinal vessels to compare methods and to permit comparisons with previous studies which used the monofractal approach. Figure 2 shows the retinal vascular trees with the highest (left) and lowest (right) multifractal dimensions in this study. Further technical details of the methodology are available on request. The intragrader reliability estimates for this technique were excellent (in 20 randomly chosen images) with intraclass correlation coefficients of 0.94 for monofractal Dbox and 0.96 for multifractal D0.
Figure 2 Segmented vessel maps of 2 retinal vascular trees
The image on the left (A) was the highest fractal dimension in this study (multifractal D0 1.736) and the image on the right (B) the lowest fractal dimension (multifractal D0 1.622). Note these images are segmented vessel maps for illustration purposes. We used the skeletonized images to actually perform the fractal analysis.
Statistical analysis.
All analyses were performed within Minitab (version 15). We assessed differences between the lacunar and cortical groups with t test, differences in proportions, and Mann-Whitney U test. Dbox and D0 were both normally distributed and we therefore used multiple linear regression with Dbox and D0 as the dependent variable with age, stroke subtype, and white matter hyperintensity scores as independent variables. We modeled deep and periventricular white matter lesion scores as covariates as they are correlated. There were no immediately applicable data upon which to base sample size calculations for the assessment of retinal fractals in stroke. The sample size chosen was based upon our pilot study12 with 80% power at the 5% level of significance to find a difference between groups of a Dbox of 0.01 with a 2-sample 2-tailed t test which predicted each group should have a minimum of 88 subjects. There were no missing data.
Standard protocol approvals and patient consent.
This study was approved by the Regional (Lothian) Research Ethics Committee and all patients gave written informed consent for research.
RESULTS
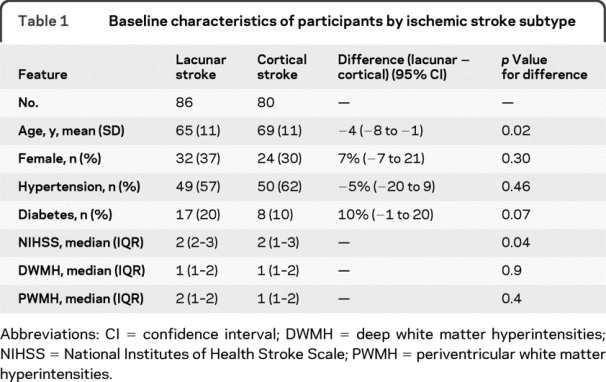
We recruited 183 patients between May 2005 and December 2007 (from 280 patients who were potentially eligible) of whom 17 with poor photographic quality were excluded, leaving 166 patients for analysis. The 97 patients who were screened and not included were excluded for the following reasons: uncertainty about the diagnosis of stroke, brain imaging showed another nonischemic stroke pathology, the stroke was too severe, or the patient declined. The mean age of those analyzed was 67.3 years (SD 11.5 years) with a median National Institutes of Health Stroke Scale score of 2 (interquartile range 2–3). There were 86 participants with lacunar stroke and 80 with cortical stroke. The baseline characteristics by stroke subtype are detailed in table 1. The lacunar stroke patients were younger with a higher stroke severity than the cortical stroke patients. The prevalence of diabetes, hypertension, and white matter hyperintensities did not differ between the groups.
Table 1 Baseline characteristics of participants by ischemic stroke subtype
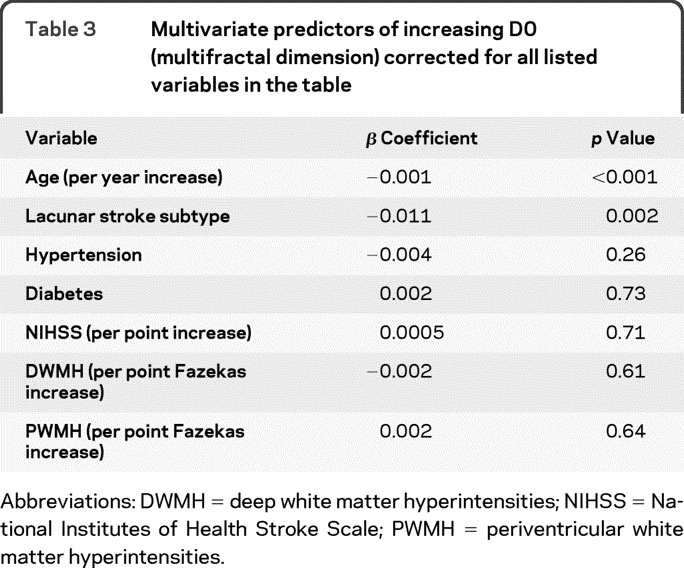
In this cohort (n = 166), the mean Dbox (monofractal dimension) was 1.42 with SD 0.02, the mean D0 (multifractal dimension) was 1.67 with SD 0.03. With multivariate analysis, decreased Dbox (table 2) and D0 (table 3), both representing decreased branching complexity, were associated with increasing age and lacunar stroke subtype after correcting for hypertension, diabetes, stroke severity, and white matter hyperintensity scores. We did not find associations between Dbox (monofractal) or D0 (multifractal) dimensions and hypertension, diabetes, or white matter hyperintensities on either univariate or multivariate analysis.
Table 2 Multivariate predictors of increasing Dbox (monofractal dimension) corrected for all listed variables in the table
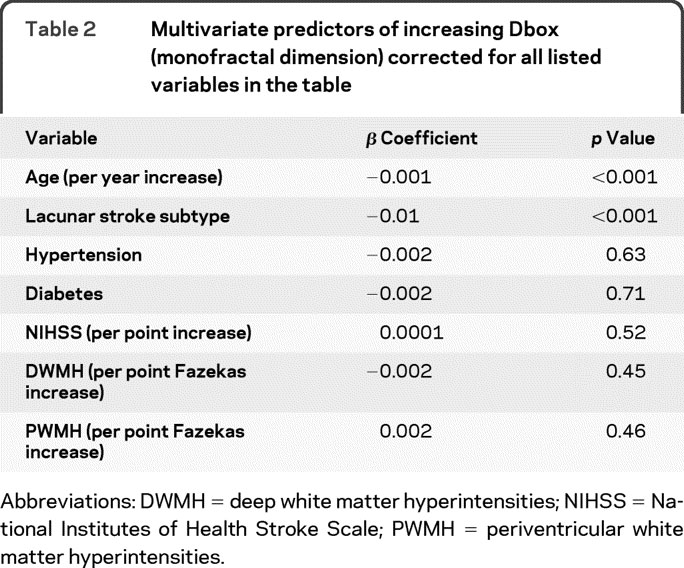
Table 3 Multivariate predictors of increasing D0 (multifractal dimension) corrected for all listed variables in the table
DISCUSSION
This study demonstrates that decreased fractal dimension (decreased branching complexity) with both monofractal and multifractal analyses is associated with lacunar stroke and increasing age after correcting for other vascular risk factors and WMH. We were able to demonstrate this despite the cortical stroke patients being on average 4 years older than the lacunar stroke patients, which would tend to mask any associations with lacunar stroke. Furthermore, we have demonstrated that it is feasible to perform automated fractal analysis on larger numbers of patients.
Until recently, fractal analysis had only been performed on smaller sample sizes, reflecting the laborious nature of hand tracing the vessels. We have previously presented details of our semiautomated approach to fractal analysis.12 Decreased monofractal dimension has been shown previously to be associated with both hypertension and increasing age.21 We have replicated the latter but not the former. Interestingly, the mean Dbox from this sample of 300 community-based patients, mean age 66 years, was 1.44 with SD 0.02, closely matching our mean of 1.43 with SD 0.02. A separate study using the same monofractal technique found that in younger diabetic patients (aged 12–20 years) increased fractal dimension was associated with increasing odds of retinopathy.22 The exact cause for this association is unclear. Further studies are required to assess the associations and determine the clinical implications of retinal fractal analysis.
The strengths of this study are the prospective, accurate, and detailed clinical and imaging characterization of all patients to be certain of stroke subtypes to reduce the 20% misclassification rate and reduce observer dependency,16 the use of automated fractal analysis software, and the correction with multivariate analysis for vascular risk factors. We used risk factor–free definitions of lacunar and cortical stroke to reduce confounding.15 We were able to assess both monofractal and multifractal measures of the fractal dimension and the automated nature of the work was not labor intensive. We were also able to measure left and right eyes in most of our patients. These results have external validity to patients presenting with minor stroke.
We also acknowledge the weaknesses in this study. The recruitment focused on patients with lacunar and minor cortical stroke (it would have been difficult to photograph patients with severe strokes and also the likely mechanisms for severe cortical stroke [atherothromboembolism and cardioembolism] were represented in those patients with minor cortical stroke). We did not find an association between white matter hyperintensities and fractal dimension but this study may have been underpowered for this. Although all patients had definite stroke diagnosed by a panel of experts and we used MRI in all cases, it is possible that stroke subtypes in some patients were misclassified. We were unable to assess fractal dimension in 10% of patients due to photographic issues but this was similar across both stroke subtypes. Ideally this proportion would have been smaller as we barely made the target sample size but we note that this is similar to previous exclusion rates in younger populations.22 Problems exist with the computerized segmentation: the edge of the optic disk is sometimes wrongly detected as a vessel, incorrect detections result from the underlying choroidal vessels, and occasionally smaller vessel paths are broken.
It is intriguing that decreased branching complexity is associated with both increasing age and lacunar stroke. It has been suggested previously that many physiologic systems become less complex with increasing age.23 The results from this study strengthen this theory and suggest a role for fractal analysis in the study of senescence. The exact cause of lacunar stroke is unclear but it may be the focal manifestation of a widespread nonatheromatous small vessel vasculopathy perhaps resulting from increased blood–brain barrier permeability associated with endothelial dysfunction.24 We have shown that although the presence of retinopathy (hemorrhages and exudates) does not differ,8 retinal venules are wider in lacunar compared to cortical stroke,6 which has been confirmed by others.7 The presence of these small yet important differences in the retinal vessels points toward a distinct vasculopathy causing lacunar stroke, which is likely to be systemic and also affect other major organs.2
Automated fractal analysis is an emerging technique that has multiple possible applications especially in studies of aging. We have used fractals to elucidate underlying pathologic mechanisms but future uses might include using the subtle changes visible in the retina as a biomarker for future development of retinal and cerebral disease. Subsequent work should concentrate on clarifying associations between fractals and cognitive function and subtypes of lacunar stroke and assessing the predictive power of fractal analysis for future eye or systemic disease.
AUTHOR CONTRIBUTIONS
Statistical analysis was conducted by Dr. F.N. Doubal.
ACKNOWLEDGMENT
Brain imaging took place in the SFC Brain Imaging Research Centre (www.sbirc.ac.uk), a center in the SINAPSE (Scottish Imaging Network–A Platform for Scientific Excellence; www.sinapse.ac.uk), which also funds J.M.W. Retinal photographs were taken in the Wellcome Trust Clinical Research Facility, Western General Hospital, Edinburgh.
DISCLOSURE
Dr. Doubal, Dr. MacGillivray, Dr. Patton, and Dr. Dhillon report no disclosures. Dr. Dennis has served/serves on the editorial boards of Stroke and Cerebrovascular Diseases; receives royalties from the publication of Stroke: A Practical Guide to Management (Wiley-Blackwell, 2001); received research materials from Covidien; and has received research support from the Medical Research Council UK, Chief Scientists Office (Scotland), and Chest Heart and Stroke Scotland. Dr. Wardlaw serves as European Editor of Stroke and receives research support from the Wellcome Trust and the Scottish Funding Council.
Address correspondence and reprint requests to Dr. F.N. Doubal, Division of Clinical Neurosciences, University of Edinburgh, Western General Hospital, Edinburgh, UK EH4 2XU fergus.doubal@ed.ac.uk
Editorial, page 1088
Supplemental data at www.neurology.org
Study funding: Supported by the Wellcome Trust 075611 (F.D.) and the Scottish Funding Council through the SINAPSE Initiative (www.sinapse.ac.uk) (J.W.). The Chief Scientists Office (Scotland) funded the brain imaging (CZB-4-281). The funders had no role in the conception or writing of this article.
Disclosure: Author disclosures are provided at the end of the article.
Received August 31, 2009. Accepted in final form December 15, 2009.
REFERENCES
- 1.Wardlaw JM. What causes lacunar stroke? J Neurol Neurosurg Psychiatry 2005;76:617–619. [DOI] [PMC free article] [PubMed] [Google Scholar]
- 2.Thompson CS, Hakim AM. Living beyond our physiological means: small vessel disease of the brain is an expression of a systemic failure in arteriolar function: a unifying hypothesis. Stroke 2009;40:322–330. [DOI] [PubMed] [Google Scholar]
- 3.Patton N, Aslam T, Macgillivray T, et al. Retinal vascular image analysis as a potential screening tool for cerebrovascular disease: a rationale based on homology between cerebral and retinal microvasculatures. J Anat 2005;206:319–348. [DOI] [PMC free article] [PubMed] [Google Scholar]
- 4.Doubal FN, Hokke PE, Wardlaw JM. Retinal microvascular abnormalities and stroke: a systematic review. J Neurol Neurosurg Psychiatry 2009;80:158–165. [DOI] [PubMed] [Google Scholar]
- 5.Wong TY, Klein R, Sharrett AR, et al. Cerebral white matter lesions, retinopathy, and incident clinical stroke. JAMA 2002;288:67–74. [DOI] [PubMed] [Google Scholar]
- 6.Doubal FN, MacGillivray TJ, Hokke PE, et al. Differences in retinal vessels support a distinct vasculopathy causing lacunar stroke. Neurology 2009;72:1773–1778. [DOI] [PMC free article] [PubMed] [Google Scholar]
- 7.Lindley RI, Wang JJ, Wong MC, et al. Retinal microvasculature in acute lacunar stroke: a cross-sectional study. Lancet Neurol 2009;8:628–634. [DOI] [PubMed] [Google Scholar]
- 8.Doubal FN, Dhillon B, Dennis MS, et al. Retinopathy in ischemic stroke subtypes. Stroke 2009;40:389–393. [DOI] [PMC free article] [PubMed] [Google Scholar]
- 9.Doubal FN, De Haan R, MacGillivray TJ, et al. Retinal arteriolar geometry is associated with white matter hyperintensities on MRI. Int J Stroke (in press). [DOI] [PMC free article] [PubMed]
- 10.Witt N, Wong TY, Hughes AD, et al. Abnormalities of retinal microvascular structure and risk of mortality from ischemic heart disease and stroke. Hypertension 2006;47:975–981. [DOI] [PubMed] [Google Scholar]
- 11.Masters BR. Fractal analysis of the vascular tree in the human retina. Annu Rev Biomed Eng 2004;6:427–452. [DOI] [PubMed] [Google Scholar]
- 12.MacGillivray TJ, Patton N, Doubal FN, et al. Fractal analysis of the retinal vascular network in fundus images. Conf Proc IEEE Eng Med Biol Soc 2007;2007:6456–6459. [DOI] [PubMed] [Google Scholar]
- 13.Brott T, Adams HP, Olinger CP, et al. Measurements of acute cerebral infarction: a clinical examination scale. Stroke 1989;20:864–870. [DOI] [PubMed] [Google Scholar]
- 14.Bamford J, Sandercock P, Dennis M, et al. Classification and natural history of clinically identifiable subtypes of cerebral infarction. Lancet 1991;337:1521–1526. [DOI] [PubMed] [Google Scholar]
- 15.Jackson CA, Sudlow CLM. Are lacunar strokes really different? A systematic review of differences in risk factor profiles between lacunar and non-lacunar infarcts. Stroke 2005;36:891–904. [DOI] [PMC free article] [PubMed] [Google Scholar]
- 16.Mead GE, Lewis SC, Wardlaw JM, et al. How well does the Oxfordshire Community Stroke Project classification predict the site and size of the infarct on brain imaging? J Neurol Neurosurg Psychiatry 2000;68:558–562. [DOI] [PMC free article] [PubMed] [Google Scholar]
- 17.Fazekas F, Chawluk JB, Alavi A, et al. MR signal abnormalities at 1.5T in Alzheimer's dementia and normal aging. AJR Am J Roentgenol 1987;149:351–356. [DOI] [PubMed] [Google Scholar]
- 18.Soares JV, Leandro JJ, Cesar Junior RM, et al. Retinal vessel segmentation using the 2-D Gabor wavelet and supervised classification. IEEE Trans Med Imaging 2006;25:1214–1222. [DOI] [PubMed] [Google Scholar]
- 19.Lam L, Lee SW, Suen CY. Thinning methodologies: a comprehensive survey. IEEE Trans Pattern Analysis Machine Intelligence 1992;14:869–885. [Google Scholar]
- 20.Stosic T, Stosic BD. Multifractal analysis of human retinal vessels. IEEE Trans Med Imaging 2006;25:1101–1107. [DOI] [PubMed] [Google Scholar]
- 21.Liew G, Wang JJ, Cheung N, et al. The retinal vasculature as a fractal: methodology, reliability, and relationship to blood pressure. Ophthalmology 2008;115:1951–1956. [DOI] [PubMed] [Google Scholar]
- 22.Cheung N, Donaghue KC, Liew G, et al. Quantitative assessment of early diabetic retinopathy using fractal analysis. Diabetes Care 2009;32:106–110. [DOI] [PMC free article] [PubMed] [Google Scholar]
- 23.Lipsitz LA, Goldberger AL. Loss of ‘complexity’ and aging: potential applications of fractals and chaos theory to senescence. JAMA 1992;267:1806–1809. [PubMed] [Google Scholar]
- 24.Wardlaw JM, Doubal F, Armitage P, et al. Lacunar stroke is associated with diffuse blood-brain barrier dysfunction. Ann Neurol 2009;65:194–202. [DOI] [PubMed] [Google Scholar]


