Abstract
Banana is an important crop grown in Oman and there is a dearth of information on its genetic diversity to assist in crop breeding and improvement programs. This study employed amplified fragment length polymorphism (AFLP) to investigate the genetic variation in local banana cultivars from the southern region of Oman. Using 12 primer combinations, a total of 1094 bands were scored, of which 1012 were polymorphic. Eighty-two unique markers were identified, which revealed the distinct separation of the seven cultivars. The results obtained show that AFLP can be used to differentiate the banana cultivars. Further classification by phylogenetic, hierarchical clustering and principal component analyses showed significant differences between the clusters found with molecular markers and those clusters created by previous studies using morphological analysis. Based on the analytical results, a consensus dendrogram of the banana cultivars is presented.
Keywords: Musa, Genetic diversity, Amplified fragment length polymorphism (AFLP), Phylogenetics, Principal component analysis (PCA), Hierarchical clustering analysis (HCA), Oman
1. Introduction
Bananas and plantains belong to the family Musaceae. The edible Musa spp. have their origin in two wild species, Musa accuminata Colla with the AA genotype and Musa balbisiana with the BB genotype, and their hybrids and polyploids (Simmonds, 1966). The dessert bananas belong to the AA, AB, AAA, and AAB genomic groups whereas plantain belongs to the ABB genomic group. The Musa genus is of great importance in the world due to the commercial and nutritional values of bananas and plantains.
Banana production is under threat from different climatic factors and pathogenic agents such as nematodes, bacteria, viruses, and fungi. The combination of varied topography and arid and semi-arid climatic conditions in Oman calls for resistant genotypes that are adapted to these terrains and climates. The major diseases affecting bananas in Oman include fruit rot (causal agent Rhizopus sp.), cigar end rot (causal agent Verticillium theobromae), and leaf spot (causal agent Drechslera sp.) (Viswanath et al., 2000). Breeders need plants with resistance to both abiotic and biotic stress factors. Conventional breeding of banana is difficult due to the complicated genetic system of Musa species. Genetic diversity provides species the ability to adapt to changing environments, including new pests and diseases and new climatic conditions.
Oman is an arid country but the majority of banana production occurs in the southern part of the country (Salalah in Dhofar Governorate), where the monsoon rains contribute to a favorable agro-climate for banana cultivation. Bananas currently cultivated in Oman are presumed to have originated as spontaneous variants from cultivars introduced over the centuries from East Africa and India, and little is known about their genetic diversity. Despite the advancements in DNA marker technology which has been extensively used in banana genetic analysis (Tenkouano et al., 1999; Pillay et al., 2001; 2003; Ude et al., 2002a) and other types of horticultural crops (Lu et al., 2002; Oraguzie et al., 2007; 2005; 2004), existing characterizations of banana genotypes in Oman are largely based on morphological attributes (Viswanath et al., 2000; de Langhe, 2002), which are subject to environmental influences. For future studies on banana improvement there is a need to study the genetic diversity of the local varieties of bananas.
Researchers have used several DNA fingerprinting techniques for the correct identification of plant species and cultivars. These DNA fingerprinting techniques have successfully used markers such as randomly amplified polymorphic DNA marker (RAPD) (Toral Ibañez et al., 2009; Ude et al., 2003; 2006; Gawel and Jarret, 1992), restriction fragment length polymorphism (RFLP) (Bhat et al., 1995), microsatellites (Grapin et al., 1998), inter simple sequence repeat (ISSR) (Godwin et al., 1997), and amplified fragment length polymorphism (AFLP) (Bhat et al., 2004; Ude et al., 2003). Among many researchers, AFLP is the marker technology of choice since it combines the reliability of classical restriction-based fingerprinting with the speed and convenience of polymerase chain reaction (PCR)-based marker techniques (Vos et al., 1995; Powell et al., 1996; Lu et al., 2002; Ude et al., 2002a; 2002b). The AFLP technique rapidly generates hundreds of highly replicable DNA markers, thus allowing high resolution genotyping (Loh et al., 2000). The present study was undertaken to investigate the genetic diversity and genetic relationships between different banana cultivars grown in southern Oman.
2. Materials and methods
2.1. Plant materials
Leaf samples from seven cultivars of banana were collected from farms in the southern part (Dhofar Governorate) in the Sultanate of Oman. For each cultivar, leaf samples were collected from randomly selected four replicate trees, giving a total of 28 replicate samples for the seven banana cultivars studied. These included all the commercial cultivars grown and consumed in Oman such as the ‘milk’ banana, ‘Salalah’ banana, and ‘Sawara Red’ banana. Samples were coded as shown in Table 1 and air-freighted in chilled containers to the research laboratory at Sultan Qaboos University, Muscat.
Table 1.
Banana genotypes used in the AFLP analysis
| No. | Common name | Code | Reported genotype# |
| 1 | Milk Banana | MB | AAB |
| 2 | Plantain Kenya | PK | |
| 3 | Somali | S | AAA |
| 4 | Maisori Fardh | MF | AAB |
| 5 | Sawara Red | SR | AAA |
| 6 | Abubakar Philipino | AP | ABB |
| 7 | Dwarf spotted Cavendish (also called Arabi or Salalah banana) | DS | AAA |
Source: de Langhe (2002)
2.2. Extraction of DNA and AFLP analysis
Total genomic DNA was extracted from young leaves bulked from five individuals per replicate of each cultivar using the modified cetylmethylammonium bromide (CTAB) method of Doyle and Doyle (1990). The extracted genomic DNA was digested with EcoRI and MseI restriction enzymes at 37 °C for 4 h to generate restriction fragments. The fragments were ligated to EcoRI and MseI adaptors as per the manufacture’s protocol. Preselective amplification of digested/ligated DNA was conducted using primers (EcoRI+3′A) and (MseI+3′C). The PCR had a total volume of 20.0 µl containing 15.0 µl AFLP core mixture, 1.0 µl AFLP preselective primer pair, and 4.0 µl diluted digested/ligated DNA, and followed the PCR profile of 72 °C for 2 min, 20 cycles at 94 °C for 20 s, 56 °C for 30 s, and 72 for 2 min. The preselective product was then diluted twice. In the first dilution 1.0 µl product was diluted in 8.0 µl TE buffer comprised of Tris and ethylenediaminetetraacetic acid (EDTA) to protect DNA from degradation. In the second dilution 1.0 µl product was diluted in 4.0 µl TE buffer.
Selective amplification of the target DNA sequences was done with 12 primer combinations (Table 2). The EcoRI primers were labeled with fluorescent dye. The selective PCR had a total volume of 20.0 µl containing 3.0 µl diluted preselective amplified product, 1.0 µl MseI primer (5 µmol/L), 1.0 µl EcoRI primer (1 µmol/L) and 15.0 µl AFLP core mixture. AFLP products were then resolved by loading onto an ABI 310 Genetic Analyzer using 25.0 µl loading buffer master mix (24.0 µl deionized formamide and 1.0 µl Gene Scan-500(ROX) size standard) and 0.5 µl selective amplified product. The tubes were heated to 95 °C for 3–5 min and quickly chilled to 4 °C. The tubes were transferred to the sample tray and run started. The required sample sheet was prepared and the AFLP matrix file was defined. Electrophoresis was carried out in performance optimized polymer 4 (POP-4). All samples were run in quadruplet starting from DNA extraction to maintain the integrity of the sample processing and result analysis.
Table 2.
AFLP bands obtained for the seven banana cultivars using 12-primer combinations
| No. | Primer combination |
ntotal | np | nm | Polymorphism (%) | |
| EcoRI | MseI | |||||
| 1 | AAC | CAA | 60 | 55 | 5 | 91.6 |
| 2 | AAG | CAC | 91 | 84 | 7 | 92.3 |
| 3 | ACA | CAG | 87 | 80 | 7 | 91.9 |
| 4 | ACC | CAT | 93 | 84 | 9 | 90.3 |
| 5 | ACG | CTA | 85 | 79 | 6 | 92.9 |
| 6 | ACT | CTC | 116 | 109 | 7 | 93.9 |
| 7 | ACT | CAT | 87 | 79 | 8 | 90.8 |
| 8 | ACA | CAA | 91 | 84 | 7 | 92.3 |
| 9 | AAC | CAG | 77 | 71 | 6 | 92.2 |
| 10 | ACC | CTT | 98 | 93 | 5 | 94.8 |
| 11 | ACA | CTG | 124 | 111 | 13 | 89.5 |
| 12 | ACT | CAC | 85 | 83 | 2 | 97.6 |
| Total for all primers | 1094 | 1012 | 82 | 92.5 | ||
n total: total number of bands; n p: number of polymorphic bands; n m: number of monomorphic bands
2.3. Data analysis
Raw data obtained from the genetic analyzer were analyzed using the GeneMapper 4.0 program (Applied Biosystems). The amplified fragments (bands) generated using the 12-primer combinations with the 7 cultivars were scored manually for their presence (denoted as “1”) and absence (denoted as “0”). The number of alleles and the discriminatory power of each primer to distinguish between varieties were also assessed.
The resulting data files were parsed with a program implemented in Perl into formats appropriate for phylogenetics, hierarchical clustering analysis (HCA), and principal component analysis (PCA). Restdist was used to create a distance matrix. Phylogenetic analysis was carried out on the resulting distance matrix with the Kitsch, Fitch, and Nearest Neighbor methods in the Phylip (v. 3.68) package (Felsenstein, 1989). HCA was performed with the Cluster (v. 3.0) and visualized with TreeView (Eisen et al., 1998). PCA was carried out with Unscrambler (Martens et al., 1987).
3. Results and discussion
3.1. AFLP profiles of banana cultivars
AFLP analysis was standardized to obtain DNA fingerprint profiles of seven banana cultivars (Table 1). A total of 12-primer combinations of EcoRI and MseI primers were used with each containing selective nucleotides, which identified 1012 polymorphic bands out of total 1094 bands (92.5% polymorphism) (Table 2). The percentage of polymorphism for individual primer combinations was very high and varied from 90.3% (EcoRI-ACC×MseI-CAT) to 97.6% (EcoRI-ACT×MseI-CAC). The size of the fragments obtained ranged from 50 to 400 bp.
3.2. Genetic diversity analysis
AFLP utilizing a single primer pair of EcoRI and MseI primers yields 67 different fragment lengths that can be used to distinguish between and show the relationships among different banana cultivars. We have chosen to use three different methods for data analysis and visualization, namely, phylogenetics, PCA, and HCA.
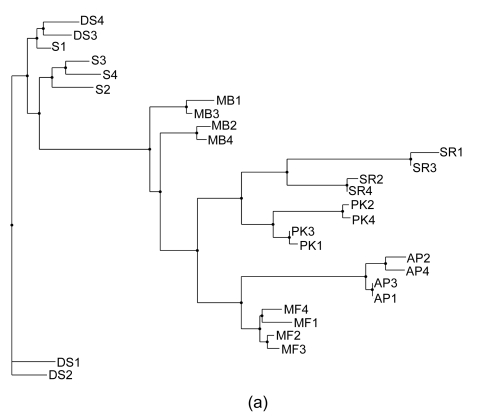
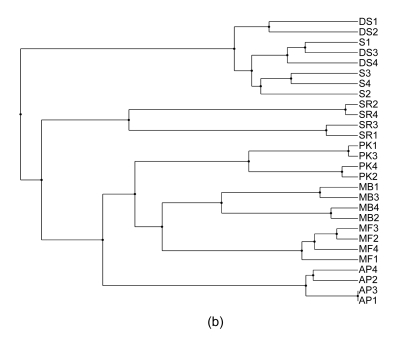
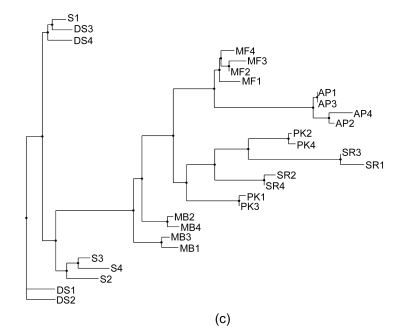
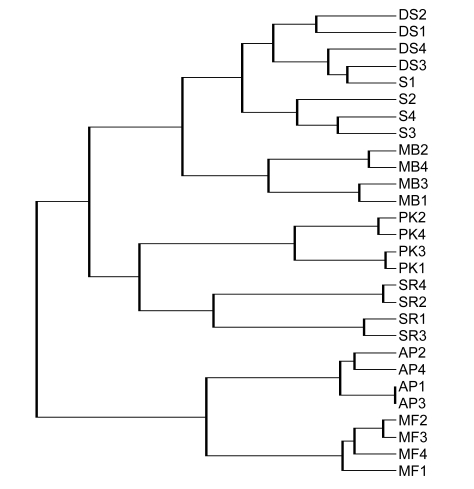
Phylogenetics is perhaps the most traditional method used for analyzing genotype data. There are several different phylogenetic methods that can be used to show the relationships between samples once the data have been reduced to a distance matrix. One of the challenges encountered with phylogenetic approaches is that different methods rely on different sets of underlying assumptions. As such, it is not uncommon for there to be some ambiguity in the results. In fact, several methods are highly dependent on the order in which samples are input into the algorithm, and, as such, it is necessary to run the algorithm many times (100 permutations were used for the data in this study), randomizing the input order each time and building a consensus tree so as to produce the most likely representation of the relationship between the samples. In this study we have employed three different phylogenetic methods. A distance matrix was first created by Restdist from the Phylip (v. 3.68) package. Further analysis was done by Kitsch, Fitch, and Neighbor methods from the Phylip (v. 3.68) package (Felsenstein, 1989). As can be seen in Figs. 1a–1c, the resulting phylogenetic trees generated by different methods give similar but not identical results. A further challenge can be seen in some of the phylogenetic trees in which it can be somewhat difficult to get a quantitative sense of how closely related the various cultivars may be.
Fig. 1.
Consensus phylogenetic trees generated with Fitch, Kitsch, and Neighbor Joining methods. (a) Fitch method estimates phylogenies from distance matrix data under the “additive tree model” according to which the distances are expected to equal the sums of branch lengths between the species; (b) Kitsch method estimates phylogenies from distance matrix data under the “ultrametric” model which is the same as the additive tree model except that an evolutionary clock is assumed; (c) Neighbor Joining is a distance matrix method producing an unrooted tree without the assumption of a clock (Felsenstein, 1989)
To explore this further, we have used PCA to analyze and visualize the data contained in this matrix. In this multivariate statistical technique, each electrophoretic band detected via AFLP can be seen as a binary variable with its presence or absence simply denoted by a “1” or “0”, respectively. As such, one can construct a matrix consisting of the presence or absence of each fragment for each cultivar. PCA allows one to reduce the number of theoretical dimensions of a data set (in this case 67) without a loss of essential information. With PCA one can study many variables simultaneously, showing how variables are correlated if desired, and also showing how the samples are grouped. For the purposes of this study the relationship or grouping of samples is of primary interest. Principal components are determined with a normalized least mean square algorithm and can be seen as a combination of the effects of the different variables reduced to linear trends, along which one can see the most important drivers of the relationships among samples.
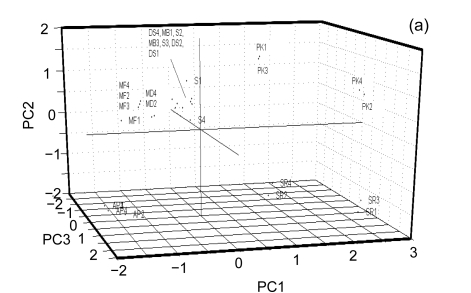
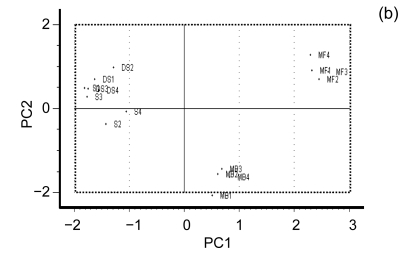
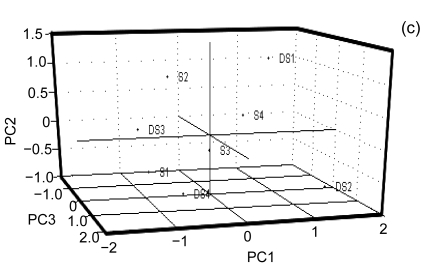
Fig. 2a shows an overview of the relationships amongst the samples. It is readily apparent that PK1 and PK3 are closely related and most similar to PK2 and PK4 and that PK1–PK4 are least related to AP1–AP4. Furthermore, it is clear that S1–S4 and DS1–DS4 are closely related and further analysis is needed to probe the structure of those relationships. In order to do so, a separate PCA was done on this subgroup and the results can be seen in Figs. 2b and 2c. From this analysis, it is clear that MF1–MF4 cluster cleanly as do MB1–MB4. Furthermore, S2, S3, and S4 group together. DS4 and DS2 clearly group together; however DS3 and S1 are more difficult to partition between groups and DS1 is related to but comparatively distant from DS2 and DS3. There is an interesting relationship between S1, DS3, and DS4 especially considering that S1–S4 were thought to be from the same cultivar based on the morphological analysis. It is in fact in this area that the phylogenetic analysis showed ambiguity.
Fig. 2.
Principal component analysis (PCA). (a) Overview of the genotyping data of all the samples projected onto the first three principle components. PK1 and PK3 are closely related as are PK2 and PK4. Similarly SR1 and SR3 cluster cleanly together as do SR2 and SR4. AP1–AP4 clearly cluster together with AP1 and AP3 clustering exactly together; (b) The closely related region isolated and projected onto the two principal components. MF1–MF4 cluster cleanly as do MB1–MB4. The phylogenetic trees show some ambiguity amongst them as to which cultivars within these subgroups are most closely related. The PCA gives a better spatial sense of the relationships within these subgroups. For example it is clear that MB2, MB3 and MB4 are quite closely related to one another whereas MB1, although closely related, clearly differs from the other three; (c) The most closely related banana cultivars projected onto the first three principal components. This is the area that shows the highest degree of ambiguity amongst the phylogenetic trees. From the multivariate analysis it is clear why there is ambiguity as these cultivars are closely related to one another as compared to other cultivars but amongst themselves are relatively evenly distributed throughout the principal component space. A further examination of the data accounting for this would be helpful. This is possible with hierarchical clustering analysis as seen in Fig. 3
From the discussion above and from Figs. 2a–2c, it can be seen that PCA does a surprisingly good job of determining the relationship between the genotypes of the different samples. This is particularly impressive as, unlike the phylogenetic methods, it does not rely on any particular evolutionary model to do so. Furthermore, it is clearly useful to allow the user to visualize the distance between sample groupings and to better understand the ambiguity reported by the phylogenetic methods.
Next, we turned to HCA. While PCA will always provide the same unbiased result for a particular data set, HCA requires one to choose a similarity measure and to define how the distance amongst group will be calculated. HCA will subsequently yield the same result every time once these, somewhat subjective, choices have been made. However, HCA is intuitively appealing and uses all of the information in the data set. In contrast, PCA is reductive in nature and depends on coordinate transformation to represent dominant trends in a data set. However, the reductive nature of PCA can be beneficial as experimental noise often falls into the later principal components, which are typically discarded. As such, PCA can lead to a better signal-to-noise ratio since biological variation (genome structure in this case) is systematic and will be represented in the first three principal components whilst experimental noise is presumably random and will fall into latter principal components, which are not used in the analysis.
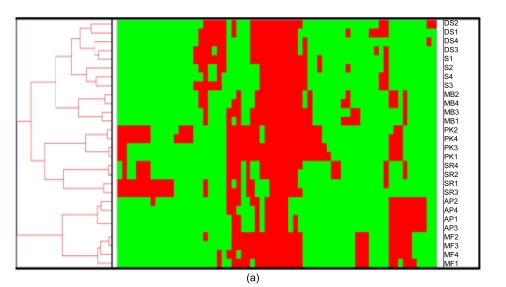
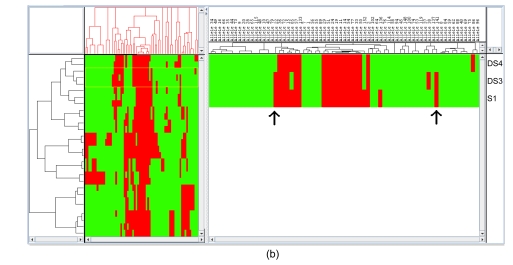
The combination of a two-dimensional HCA and a heatmap for visualization is a powerful analytical approach and allows one to visualize the occurrence and concordance of specific AFLP fragments with different groupings of samples. Fig. 3a demonstrates the hierarchical relationship amongst the samples and shows which AFLP fragments (electrophoretic bands) are responsible for the segregation. It is clear that there is a core set of AFLP fragments common to all cultivars, which is not surprising if one assumes that they have some common points of origin in evolutionary history. It further shows which fragments are responsible for distinguishing amongst samples. Interestingly, of the samples shown to be the most ambiguous by phylogenetic analysis and PCA, one can see that they are very close indeed, with only seven fragments distinguishing them from one another. As shown in Fig. 3b, one can see the specific effects of band presence or absence on the clustering of S1, DS3, and DS4. It would appear that S1 and DS3 share two fragments (arrows in Fig. 3b) more than DS3 and DS4 do, and as such the correct grouping would be to show S1 and DS3 in the same clade.
Fig. 3.
Hierarchical clustering analysis (HCA). (a) HCA of all of the samples. This largely confirms the groupings made by both phylogenetic and multivariate statistical methods; (b) “Zoom view” of a branch in the cluster. In the samples shown to be the most ambiguous by phylogenetic analysis and PCA, HCA analysis shows that only seven fragments distinguish them from one another. One can see the specific effects of band’s presence or absence on the clustering of S1, DS3 and DS4. It would appear that S1 and DS3 share two fragments (see arrows) more than do DS3 and DS4 and as such, the correct grouping would be to show S1 and DS3 in the same clade
Classifications by phylogenetics, PCA and HCA are based on different mathematical models and approaches to data analysis, which makes them complimentary. PCA is based on variables and focuses on identifying patterns or trends in the data by reducing the dimensionality into a set of abstract factors (principal components), creating a new coordinate space to visualize the data set. In doing so, PCA will eliminate most of the noise, but some biological signal will possibly be lost. However, PCA is an unbiased and unsupervised method that analyzes everything at once and may be less prone to underlying assumptions or algorithmic bias possible in the other two methods. Hierarchical clustering works sequentially to create clusters from subsets of the data. Once data have been assigned to a cluster, it is no longer considered in the analysis. As such, even though all of the data are considered, they are not considered simultaneously and some bias can occur. Phylogenetic methods are based on a set of underlying evolutionary assumptions that may in fact not be correct for a given data set and may not account for direct human intervention in a cultivar lineage (e.g., selective plant breeding).
Given the factors associated with each of the methods discussed above, it is worthwhile to independently validate each of the methods. Furthermore, as they each bring different approaches to data visualization, combining them does bring further clarity as to the relationships between samples and a direct visualization of each variable’s contribution to the differentiation between samples.
For the data analyzed in this study, the different methods provide similar enough results to suggest that the conclusions reached are valid. Furthermore, this approach allows one to disambiguate (and/or understand the underlying cause for any ambiguity) the cultivars that appear to be quite closely related.
3.3. Morphological genotypes vs. AFLP-based genotypes
Seven banana cultivars from the southern region of Oman studied for their genetic variation were clearly differentiated by AFLP. The phylogenetics, PCA and HCA divided the banana cultivars into closely related clusters. All seven cultivars separated from each other but grouped into several clusters as shown in Figs. 2–3. In some cases these results correlate with the morphological classification of selected banana cultivars grown in Oman by de Langhe (2002) whilst in other cases show that there are markedly different genotypic vs. morphological classifications.
In their survey of the southern region of Oman, de Langhe (2002) classified the cv. ‘Salalah’ Dwarf spotted (DS) Cavendish and cv. ‘Somali’ (S) as the Cavendish subgroup with the AAA genotype and as evident from Figs. 2–3, and the two varieties are related to one another. However, there is a significant ambiguity as to how they are classified with different phylogenetic methods (Fig. 1). Given the even spread in multidimensional space as seen in the PCA in Fig. 2c, it is easy to understand why these cultivars are difficult to definitively classify amongst one another. S1 consistently segregates nearest to DS3 and DS4, likely reflecting that they are actually from the same or very similar cultivars and that S1 may not actually belong to the Somali cultivar. The other two morphological sub-clusters included cv. ‘Abubakar’ in one group by itself and ‘Maisori Fardh’ (MF) and ‘Milk Banana’ (MB) in another subgroup. Cv. ‘Abubakar Philipino’ (AP) samples cosegregate together with all of the methods employed and in some cases (Figs. 1a, 1c and 3a) share a parent clade with MF. MF and MB are distinct but cosegregate with a common parent clade in two of the five methods (Figs. 1a and 2a). The AAA morphological grouping places S, DS, and Sawara Red (SR) together in the same group. This is clearly not supported by the AFLP-based genotyping, as SR does not cosegregate with S and DS in any of the analyses.
To the contrary, SR is quite distant in nearly all of the analytical methods applied and in fact shows an inverse correlation with S and DS in the PCA. The Plantain Kenya (PK) is not included in the morphological characterization but genotypically shows two distinct subgroups within its samples, both of which correlate closest to SR in most cases but as can be seen in the PCA (Fig. 2a) are quite distinct from the other cultivars. A summary of the comparison between morphological and AFLP-based genotypic methods of classification can be seen in Table 3, while Fig. 4 presents a consensus dendrogram of the banana cultivars based on the analytical results.
Table 3.
Correlations and differences between morphological classifications and AFLP-based genotypic classifications
| Morphology | Cultivars | Phylogenetics |
PCA | HCA | ||
| Fitch | Kitsch | Neighbor Joining | ||||
| AAB | MB, MF | − | + | − | + | − |
| AAA | S, DS | +/− | +* | +/− | +* | +* |
| AAA | S, SR, DS | − | − | − | − | − |
| ABB | AP, others | AP, MF | − | AP, MF | − | AP, MF |
| None | PK, others | PK, SR | PK, MB, MF | PK, SR | −** | PK, SR |
Correlations between morphological classification and AFLP genotyping data analysis methods are scored with + or − to denote agreement or disagreement between morphology and genotype
Mixture in classes between S and DS samples
PK and SR are distinct groups and each of them has two distinct subgroups, which are consistently found in the other methods as well, although Neighbor Joining apparently confuses the relationships between PK and SR subgroups
Fig. 4.
Consensus tree diagram of the genetic relationships between the banana cultivars
According to Loh et al. (2000) it is possible that the differences in phenotypic characters may not be due to euploidy differences but rather due to allelic differences in single or multiple genes. They found a similar discrepancy between some of the banana cultivars. The cv. Dwarf Cavendish, Grand Nain, and Raja Udang, which were designated by Simmond (1966) as having the AAA genomic constitution based on morphological characterization, fell in separate clusters. Use of morphological traits may be helpful but is sometimes inadequate in differentiating closely related cultivars (Bhat et al., 2004) because they are highly influenced by the environment.
In conclusion, the AFLP technique has been demonstrated in the present study to be a useful tool in determining the genetic diversity in banana cultivars grown in Oman. This finding is congruent with previous studies that have successfully used AFLP markers to acquire genetic diversity information of banana (Ude et al., 2002a; 2002b; Loh et al., 2000; Wong et al., 2002; Wang et al., 2007) and other economically important plants (Allaby and Brown, 2003; Miller and Schaal, 2006; Jiang et al., 2007; Jansen and van Hintum, 2007; Magnussen and Hauser, 2007). Our results on AFLP analysis of banana cultivars grown in southern Oman confirm in some cases and conflict starkly in others when compared to the previous studies on characterization of banana cultivars based on morphological characters (de Langhe, 2002), pointing out the deficiencies in purely morphological characterizations. Our study has demonstrated that the combination of AFLP technique with analyses such as phylogenetics, PCA, and HCA will assist in understanding the genetic diversity of the banana cultivars and other crops grown in Oman.
Since the points of origin for bananas now cultivated in Oman cannot be strictly determined from historical records, it should now be possible to use AFLP markers to determine the relationships between banana cultivars found in Oman and bananas found elsewhere along the Indian Ocean (southern and eastern Africa and India) as well as cultivars found elsewhere in the world. To do so could be the first step in determining the adaptive changes that have taken place since introduction to the various terrain and climactic conditions found in Oman.
Acknowledgments
We thank the Directors and Staff at Rumais Experiment Station, and field staff in Salalah, Ministry of Agriculture, Oman for their support and assistance in arranging the research field trip. The technical support of Mr. Ali Masoud AL-SUBHI (Department of Crop Science) and Mr. Adel Abdullah AL-MAHDOURY (Department of Soils, Water and Agricultural Engineering) at Sultan Qaboos University is appreciated.
Footnotes
Project supported by Programs of Sultan Qaboos University (Nos. SR/AGR/BIOR/05/01 and IG/AGR/PLANT/04/01), Sultanate of Oman, and the Research Chair in Postharvest Technology at the University of Stellenbosch, South Africa
References
- 1.Allaby RG, Brown TA. AFLP data and the origins of domesticated crops. Genome. 2003;46(3):448–453. doi: 10.1139/g03-025. [DOI] [PubMed] [Google Scholar]
- 2.Bhat KV, Jarret RL, Rana RS. DNA profiling of banana and plantain cultivars using random amplified polymorphic DNA (RAPD) and restriction fragment length polymorphism (RFLP) markers. Electrophoresis. 1995;16(1):1736–1745. doi: 10.1002/elps.11501601287. [DOI] [PubMed] [Google Scholar]
- 3.Bhat KV, Amaravathi Y, Guatam PL, Velayudhan KC. AFLP characterization and genetic diversity analysis of Indian banana and plantain cultivars (Musa spp.) Plant Genetic Resources. 2004;2(2):121–130. doi: 10.1079/PGR200440. [DOI] [Google Scholar]
- 4.de Langhe E. Banana Diversity in the Middle East (Jordan, Egypt and Oman) Montpellier, France: International Network for the Improvement of Banana and Plantain (INIBAP); 2002. [Google Scholar]
- 5.Doyle JJ, Doyle JL. A rapid total DNA preparation procedure for fresh plant tissue. Focus. 1990;12:13–15. [Google Scholar]
- 6.Eisen MB, Spellman PT, Brown PO, et al. Cluster analysis and display of genome-wide expression patterns. Proc Nat Acad Sci. 1998;95(25):14863–14868. doi: 10.1073/pnas.95.25.14863. [DOI] [PMC free article] [PubMed] [Google Scholar]
- 7.Felsenstein J. PHYLIP—phylogeny inference package (version 3.2) Cladistics. 1989;5(2):163–166. doi: 10.1111/j.1096-0031.1989.tb00562.x. [DOI] [Google Scholar]
- 8.Gawel NJ, Jarret RL. Restriction fragment length polymorphism (RFLP)-based phylogenetic analysis of Musa. Theor Appl Genet. 1992;84(3-4):286–290. doi: 10.1007/BF00229484. [DOI] [PubMed] [Google Scholar]
- 9.Godwin ID, Aitken EAB, Smith LW. Application of inter-simple sequence repeat (ISSR) markers to plant genetics. Electrophoresis. 1997;18(9):1524–1528. doi: 10.1002/elps.1150180906. [DOI] [PubMed] [Google Scholar]
- 10.Grapin A, Noyer JL, Carrel F, Dambler D, Baurens FC, Lanaud C, Lagoda PJL. Diploid Musa acuminate genetic diversity assayed with sequence-tagged microsatellite sites. Electrophoresis. 1998;19(8-9):1374–1380. doi: 10.1002/elps.1150190829. [DOI] [PubMed] [Google Scholar]
- 11.Jansen J, van Hintum T. Genetic distance sampling: a novel sampling method for obtaining core collections using genetic distances with an application to cultivated lettuce. Theor Appl Genet. 2007;114(3):421–428. doi: 10.1007/s00122-006-0433-9. [DOI] [PubMed] [Google Scholar]
- 12.Jiang H, Liao B, Ren X, Lei Y, Mace E, Fu T, Crouch JH. Comparative assessment of genetic diversity of peanut (Arachis hypogaea L.) genotypes with various levels of resistance to bacterial wilt through SSR and AFLP analyses. J Genet Genomics. 2007;34(6):544–554. doi: 10.1016/S1673-8527(07)60060-5. [DOI] [PubMed] [Google Scholar]
- 13.Loh JP, Kiew R, Set O, Gan LH, Gan YY. Amplified fragment length polymorphism fingerprinting of 16 banana cultivars (Musa cvs.) Mol Phylogenetics Evol. 2000;17(3):360–366. doi: 10.1006/mpev.2000.0848. [DOI] [PubMed] [Google Scholar]
- 14.Lu G, Cao JS, Chen H. Genetic linkage map of Brassica campestris L. using AFLP and RAPD markers. J Zhejiang Univ-Sci A. 2002;3(5):600–605. doi: 10.1631/jzus.2002.0600. [DOI] [Google Scholar]
- 15.Magnussen LS, Hauser TP. Hybrids between cultivated and wild carrots in natural populations in Denmark. Heredity. 2007;99(2):185–192. doi: 10.1038/sj.hdy.6800982. [DOI] [PubMed] [Google Scholar]
- 16.Martens H, Karstang T, Næs T. Improved selectivity in spectroscopy by multivariate calibration. J Chemom. 1987;1(4):201–219. doi: 10.1002/cem.1180010403. [DOI] [Google Scholar]
- 17.Miller AJ, Schaal BA. Domestication and the distribution of genetic variation in wild and cultivated populations of the Mesoamerican fruit tree Spondias purpurea L. (Anacardiaceae) Mol Ecol. 2006;15(6):1467–1480. doi: 10.1111/j.1365-294X.2006.02834.x. [DOI] [PubMed] [Google Scholar]
- 18.Oraguzie NC, Iwanami H, Soejima J, Harada T, Hall A. Inheritance of the Md-ACS1 gene and its relationship to fruit softening in apple (Malus×domestica Borkh) Theor Appl Genet. 2004;108(8):1526–1533. doi: 10.1007/s00122-003-1574-8. [DOI] [PubMed] [Google Scholar]
- 19.Oraguzie NC, Yamamoto T, Soejima J, Suzuki T, de Silva N. DNA fingerprinting of apple (Malus spp.) rootstocks using simple sequence repeats. Plant Breeding. 2005;124(2):197–202. doi: 10.1111/j.1439-0523.2004.01064.x. [DOI] [Google Scholar]
- 20.Oraguzie NC, Rikkerink EHA, Gardiner S, et al. Association Mapping in Plants. New York: Springer; 2007. [DOI] [Google Scholar]
- 21.Pillay M, Ogundiwin E, Nwakanma DC, Ude G, Tenkouano A. Analysis of genetic diversity and relationships in east African banana germplasm. Theor Appl Genet. 2001;102(6-7):965–970. doi: 10.1007/s001220000500. [DOI] [Google Scholar]
- 22.Pillay M, Dimpka C, Ude GN, Makumbi D, Tushemereirwe W. Genetic variation in banana cultivar ‘Sukali Nidzi’ grown in different regions of Uganda. Afr Crop Sci J. 2003;11(2):87–95. [Google Scholar]
- 23.Powell W, Morgante M, Andre C, Hanafey M, Vogel J, Tingey S, Rafalski A. The comparison of RFLP, RAPD, AFLP and SSR (microsatellite) markers for germplasm analysis. Mol Breed. 1996;2(3):225–238. doi: 10.1007/BF00564200. [DOI] [Google Scholar]
- 24.Simmonds NW. Bananas. 2nd Ed. London: Longmans; 1966. (Tropical Agriculture Series). [Google Scholar]
- 25.Tenkouano A, Crouch JH, Crouch HK, Vuylsteke D, Ortiz R. Comparison of DNA marker and pedigree-based methods of genetic analysis in plantain and banana (Musa spp.) clones. I. Estimation of genetic relationships. Theor Appl Genet. 1999;98(1):62–68. doi: 10.1007/s001220051040. [DOI] [Google Scholar]
- 26.Toral Ibañez MT, Caru M, Herrera MA, Gonzalez L, Martin LM, Miranda J, Navarro-Cerrillo RM. Clones identification of Sequoia sempervirens (D. Don) Endl. in Chile by using PCR-RAPDs technique. J Zhejiang Univ-Sci B. 2009;10(2):112–119. doi: 10.1631/jzus.B0820162. [DOI] [PMC free article] [PubMed] [Google Scholar]
- 27.Ude G, Pillay M, Nwakanma D, Tenkouano A. Analysis of genetic diversity and sectional relationships in Musa using AFLP markers. Theor Appl Genet. 2002;104(8):1239–1245. doi: 10.1007/s00122-001-0802-3. [DOI] [PubMed] [Google Scholar]
- 28.Ude G, Pillay M, Nwakanma D, Tenkouano A. Genetic diversity in Musa acuminata Colla and Musa balbisiana Colla and some of their natural hybrids using AFLP markers. Theor Appl Genet. 2002;104(8):1246–1252. doi: 10.1007/s00122-002-0914-4. [DOI] [PubMed] [Google Scholar]
- 29.Ude G, Ogundiwin E, Pillay M, Tenkouano A. Genetic diversity in an African Plantain core collection using AFLP and RAPD markers. Theor Appl Genet. 2003;107(2):248–255. doi: 10.1007/s00122-003-1246-8. [DOI] [PubMed] [Google Scholar]
- 30.Ude GN, Dimpka CO, Anegbeh PO, Saibu AA, Tenkouano A, Pillay M, Tchoundjeu Z. Analysis of genetic diversity in accessions of Irvingia gabonensis (Aubry-Lecomte ex O′Rorke) Baill. Afr J Biotechnol. 2006;5(3):219–223. [Google Scholar]
- 31.Viswanath P, Nadaf SK, Mazroui Y, et al. Present Status of Banana Production in Oman; Bananas and Food Security, International Symposium; Nov. 10–14, 1998; Douala, Cameroon. 2000. pp. 237–250. [Google Scholar]
- 32.Vos P, Hogers R, Bleeker M, Reijans M, van de Lee T, Hornes M, Frijters A, Pot J, Peleman J, Kuiper M, et al. AFLP: a new technique for DNA fingerprinting. Nucleic Acids Res. 1995;23(21):4407–4414. doi: 10.1093/nar/23.21.4407. [DOI] [PMC free article] [PubMed] [Google Scholar]
- 33.Wang XL, Chiang TY, Roux N, Hao GX. Genetic diversity of wild banana (Musa balbisiana Colla) in China as revealed by AFLP markers. Genet Resour Crop Evol. 2007;54(5):1125–1132. doi: 10.1007/s10722-006-9004-9. [DOI] [Google Scholar]
- 34.Wong C, Kiew R, Set O, Argent G, Lee SK, Gan YY. Assessment of the validity of the sections in Musa (Musaceae) using AFLP. Ann Bot. 2002;90(2):231–238. doi: 10.1093/aob/mcf170. [DOI] [PMC free article] [PubMed] [Google Scholar]


