Abstract
Elucidation of the chemical composition of biological samples is a main focus of systems biology and metabolomics. Their comprehensive study requires reliable, efficient, and automatable methods to identify and quantify the underlying metabolites. Because nuclear magnetic resonance (NMR) spectroscopy is a rich source of molecular information, it has a unique potential for this task. Here we present a suite of public web servers (http://spinportal.magnet.fsu.edu), termed COLMAR, that facilitates complex mixture analysis by NMR. The COLMAR web portal presently consists of three servers: COLMAR covariance calculates the covariance NMR spectrum from an NMR input dataset, such as a TOCSY spectrum; COLMAR DemixC method decomposes the 2D covariance TOCSY spectrum into a reduced set of non-redundant 1D cross sections or traces, which belong to individual mixture components; COLMAR query screens the traces against a NMR spectral database to identify individual compounds. Examples are presented that illustrate the utility of this web server suite for complex mixture analysis.
Keywords: Covariance NMR, resolution enhancement, complex mixture analysis, metabolomics, metabonomics, NMR processing, COLMAR web server
Introduction
Identification of individual chemical components of biological systems and monitoring of their concentration changes in response to a multitude of factors such as genetics, age, pathology, development, environment, stress, and treatment are key aspects of metabolomics and metabonomics. The comprehensive, systems biological approach to the study of metabolic mixtures thereby promises a better understanding of complex biochemical processes in living systems.1–5 Efficient and reliable analysis of these complex mixtures in terms of the underlying metabolites is an important prerequisite toward achieving this goal. Nuclear magnetic resonance (NMR) spectroscopy has a unique potential for this task as it can bypass the potentially time-consuming physical separation process of the components and deconvolute the mixture by means of suitable pulse sequence schemes and new data processing and analysis methods.6–8 NMR methods for complex mixture analysis include diffusion-ordered spectroscopy (DOSY),9 differential analysis of COSY spectra,10 selective 1D TOCSY11 and 2D TOCSY,12 and STOCSY.13
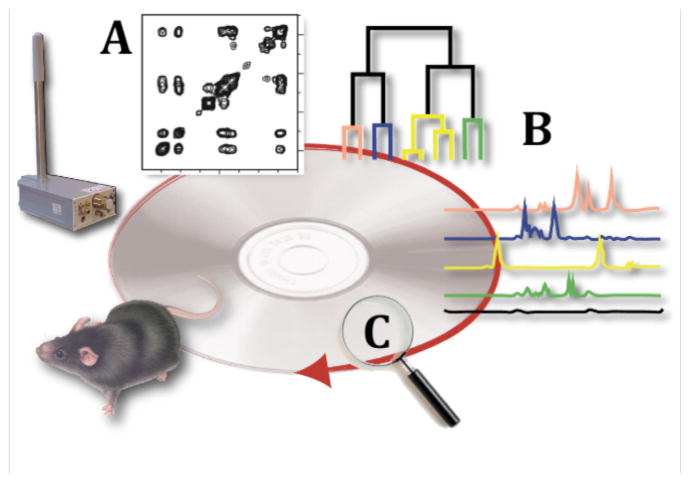
In typical metabolomics applications, a large number of samples need to be measured and analyzed, which generates a need for resolution and sensitivity enhancement. One such method is covariance NMR.14–16 Here, we describe the COLMAR suite of public web servers for the processing, analysis, and interpretation of covariance-based NMR data of complex mixtures. The philosophy behind COLMAR is depicted in Figure 1, which illustrates the different steps, starting with sample collection, NMR data acquisition, covariance processing (COLMAR covariance), deconvolution by clustering (COLMAR DemixC), to database screening for the identification of components (COLMAR query). The three COLMAR servers (covariance, DemixC, query) can be used together or separately as described in the following.
Figure 1.
Illustration of COLMAR web portal approach for complex mixture analysis by NMR using (A) covariance processing, (B) deconvolution of the spectrum by DemixC cluster analysis into traces of individual components, and (C) query of the traces against NMR database.
Methods
Sample Preparation
A metabolic model mixture was prepared by mixing carnitine, glucose, lysine, myo-inositol and shikimate at final concentrations of 1.0 mM in D2O.
NMR data collection and analysis
2D 1H-1H TOCSY NMR data17 was collected at 800 MHz using a 5-mm cryogenic probe. The MLEV-17 mixing sequence18 with 220 ms mixing time was applied. The sample temperature was maintained at 298 K. Data was collected using 2048 t2 and 1024 t1 (complex) data points with 8 scans per t1-increment and a 1H spectral width of 9615 Hz.
Results
COLMAR covariance
Metabolomics studies are typically carried out on multiple samples. This makes the reduction of data collection time a key consideration. Since 2D Fourier transform (FT) NMR requires a large number of t1 increments (N1) to obtain sufficient resolution along the indirect dimension ω1,19 it is not optimally suited for this task.
Approach
Covariance NMR14–16 with its resolution enhancement and time saving properties has significant potential for such applications as described previously.20 Briefly, covariance transform endows the indirect dimension the same resolution as the direct dimension, which leads to a symmetric spectrum C that has the same high resolution along ω1 as along ω2. Operationally, the covariance spectrum is obtained from the 2D FT spectrum F(ω1,ω2) represented by a N1×N2 matrix, or mixed time-frequency spectrum F(t1,ω2) represented by a N1×N2 matrix, by means of matrix multiplication followed by the matrix square root operation C = (FT·F)1/2 where superscript T denotes the matrix transpose. The matrix square-root can be determined either by matrix diagonalization of FT·F or by singular value decomposition (SVD) of the 2D FT spectrum F.16 The SVD method is the method of choice when N1 < N2, which applies when experimental time-saving is a key consideration.
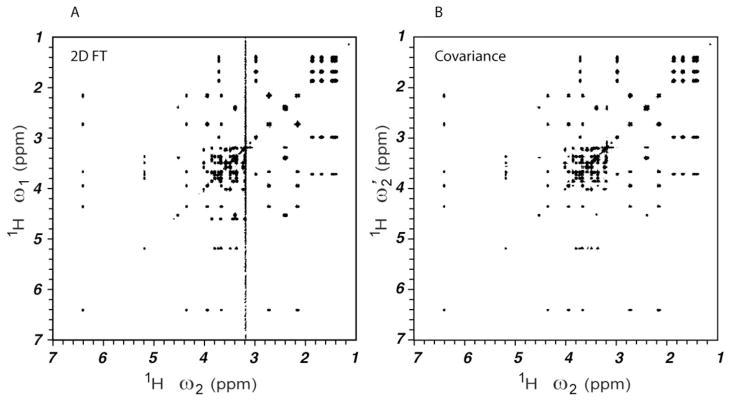
Figure 2 shows a 2D FT TOCSY spectrum (A) and the corresponding covariance spectrum (B) of a model mixture containing the five common metabolites carnitine, glucose, lysine, myo-inositol, and shikimate. A total of 1024 complex t1 points was used for both Figure 1A and 1B. For such a large number of increments (N1) the covariance spectrum is virtually identical to the 2D FT spectrum. Note that the water t1-noise is reduced in the covariance TCOSY spectrum, since the water signal lacks spin correlations with other resonances.
Figure 2.
(A) 2D FT processed and (B) covariance processed 1H-1H TOCSY NMR spectrum of metabolite model mixture containing carnitine, glucose, lysine, myo-inositol and shikimate in aqueous solution. N1=1024 complex points was used for both panels.
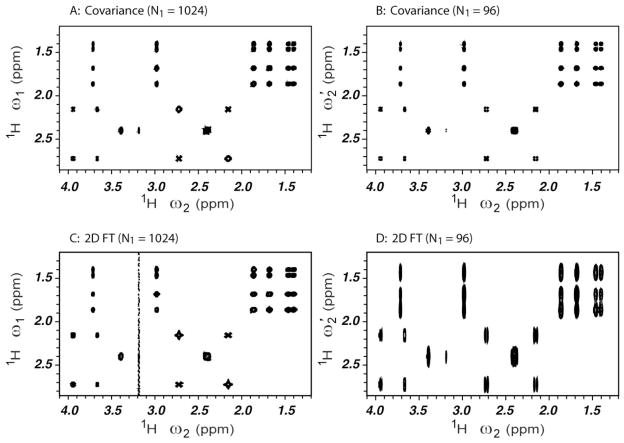
An expanded region of the covariance and the 2D FT TOCSY spectra collected with N1 = 1024 complex points (Panels 3A,C) and 96 complex points (Panels 3B,D) is shown in Figure 3. The poor spectral resolution of the 2D FT spectrum along ω1 with 96 increments (Panel D) is reversed by the covariance transform applied to the same raw data (Panel B) yielding a correlation spectrum with high spectral resolution along ω1.
Figure 3.
The expanded regions of covariance processed (A, B) and 2D FT processed (C, D) 1H-1H TOCSY NMR spectra of the model mixture of Figure 2. N1=1024 complex points were used for Panels A,C and N1=96 complex points for Panels B,D.
Implementation
The COLMAR covariance web server (http://spinportal.magnet.fsu.edu/covariance/covariance.html) uploads 2D NMR data sets in various formats, such as NMRPipe mixed time-frequency data F(t1,ω2) and 2D FT data F(ω1,ω2), Bruker and Varian time-domain data (whereby zero and first order phase correction parameters along ω2 must be provided) and returns the corresponding covariance spectrum. It has an option to remove the water line prior to covariance processing. Furthermore, it permits indirect covariance transform by application of Cindirect = (F·FT)1/2.21–23 The indirect covariance spectrum Cindirect has a greatly diminished residual water signal, while the spectral resolution is determined by the spectral resolution of F along ω1.24 Indirect covariance processing can also be fruitfully applied to heteronuclear spectra, such as 1H-13C HSQC-TOCSY, producing a 13C-13C TOCSY spectra with the proton detection sensitivity.21 The web server implementation of covariance NMR computes the matrix square-root by SVD. For the dataset of Figure 3, the processing times takes about 175 seconds for N1=1024 complex points, and 6 seconds for N1=96 complex points.
While the COLMAR covariance web server has been originally designed as an integral part of the TOCSY-based COLMAR pipeline as a front-end to DemixC and query (see following sections), it can be used equally well in a standalone mode as a covariance processing engine for a range of other types of 2D spectra, including NOESY, ROESY, and 2QF-COSY.
COLMAR DemixC
A 2D TOCSY spectrum contains a wealth of information about spin connectivities. This information needs to be transformed into fingerprints that can be uniquely assigned to individual components of the mixture. Implicit in the implementation of covariance NMR via SVD or matrix diagonalization is the representation of an NMR spectrum by the eigenvectors and eigenvalues of its covariance matrix (principal component analysis or PCA).16 In the absence of chemical shift degeneracy, each principal component of the TOCSY spectrum of a mixture is the 1D spectrum of a spin system belonging to one of the mixture components.12 In the presence of significant peak overlap of the different components, the orthogonality condition of the principal components is too restrictive and the PCA deconvolution of a TOCSY spectrum into individual spin systems may break down (by returning principal components that cannot be unambiguously assigned to individual spin systems).
Alternatively, given that TOCSY generally has positive peaks, linear algebraic non-negative matrix factorization (NMF)25 applied to covariance or 2D FT TOCSY spectra allows the deconvolution of TOCSY spectra of complex mixtures into the 1D spectra of each mixture component.26 Both PCA and NMF perform unsupervised clustering of cross-peaks into groups that belong to individual components.
Approach
A recently introduced clustering method, termed DemixC, has shown significant promise in the robust deconvolution of TOCSY spectra of mixtures.27, 28 The DemixC method uses covariance techniques to guide the clustering of 1D traces (1D cross sections) of the TOCSY spectrum by identifying those traces that best represent individual mixture components and that are least likely to be affected by peak overlaps.
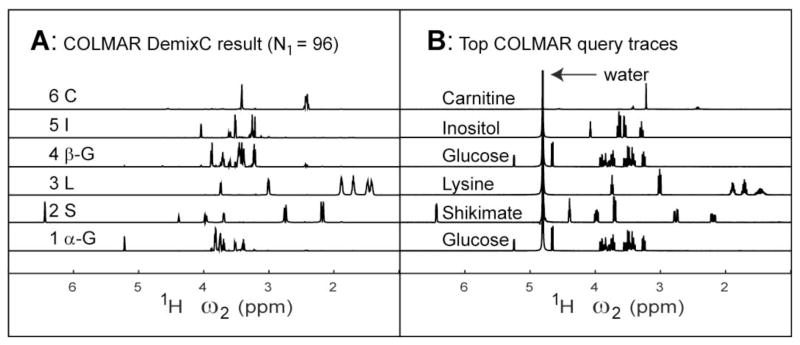
For each trace of the covariance matrix C an importance index is calculated as the sum of all elements of the corresponding row of C2, which is a measure of the cumulative overlap of this trace with all other traces of C. After trace clustering, which is based on trace similarity expressed by the mutual scalar product, for each cluster a representative trace is selected as the one with a minimal importance index. In this way, the likelihood is maximized that the selected traces reflect individual components free of spurious contributions from other spin systems. Figure 4A shows the application of DemixC to the covariance TCOSY spectrum of Figure 3 with N1=96 complex points. The spectra are rank ordered according to their importance index and labeled from 1 to 6 with 1 being the trace with the lowest importance index.
Figure 4.
(A) DemixC derived traces sorted according to importance index (with lowest index at the bottom). The traces are labeled with the first character of their compound names. Traces 1 and 4 correspond to α-glucose and β-glucose, respectively. (B) Top returns by COLMAR query using the BMRB database.
Implementation
The COLMAR DemixC web server (http://spinportal.magnet.fsu.edu/demixC/demixC.html) uploads a covariance TOCSY spectrum, such as the one provided by COLMAR covariance, and returns the DemixC traces. The DemixC web server lists default values for the importance index cutoff (0.01) and a trace similarity cutoff (0.4), which can be modified by the user. The importance index cutoff determines the minimal intensity of a TOCSY trace to be considered (the lower the cutoff, the larger the concentration range to be considered) and the similarity cutoff defines the minimal similarity of a pair of traces so that they can be assigned to the same compound (the higher the cutoff, the more restrictive is the assignment). For the dataset of Figure 4, online DemixC processing takes about 120 seconds.
DemixC can also be applied to 13C traces of a 2D 1H-13C HSQC-TOCSY, or the above-mentioned 13C-13C TOCSY spectrum derived by indirect covariance processing, yielding a unique set of 13C traces that are characteristic for the individual mixture components.29
COLMAR query
While the COLMAR DemixC traces represent highly informative fingerprints of the underlying metabolite components, determination of the metabolite identities is an important challenge.8, 30 We set out to utilize public-domain metabolomics NMR databases to assist the compound identification process by NMR, in particular the Biological Magnetic Resonance Data Bank (BMRB) (http://www.bmrb.wisc.edu)31 and the Human Metabolome Database (http://www.hmdb.ca)32 containing NMR spectra and peak lists of a rapidly growing number of compounds. For this purpose, algorithms are needed that screen the DemixC traces against these databases and return a score that reflects the level of agreement of a given match.
Approach
COLMAR query server uses three different algorithms to compute matching scores between chemical shift differences of the query trace and any given database entry.33 The forward algorithm uses forward assignment, i.e. each chemical shift of the query trace is assigned to the peak in the database peak list that is closest as measured by the frequency difference. The reverse assignment algorithm works identical to the forward algorithm except that the roles of the query trace and the database spectrum are exchanged. The weighted matching algorithm produces in its standard form unambiguous assignments: if the query peak list has N entries and the peak list of the database spectrum has M entries, the algorithm matches the smaller of the 2 peak lists with the larger one so that each peak from the smaller list is assigned to a peak from the larger list, such that no two peaks from the smaller list are assigned to the same peak of the larger list. Figure 4B shows the COLMAR query top returns for each of the 6 DemixC traces of Figure 4A. For all 6 queries, the top return corresponds to the correct compound. The traces of α-D-glucose and β-D-glucose in Figure 4A both match the spectrum of the isomeric mixture of D-glucose in the database.
Implementation
The COLMAR query web server (http://spinportal.magnet.fsu.edu/webquery/webquery.html) uploads either a chemical shift peak list of an unknown compound or a DemixC trace, such as the one provided by COLMAR DemixC, and returns the top scoring compounds of the selected database metabolites. In addition, the figures of the database spectra are provided with the query chemical shifts superimposed for a visual inspection of the quality of the match. The query web server lists default values for the number of top scoring compounds (default value 5) and a relative intensity threshold for peak picking (default value 0.01), which can be modified by the user. For the DemixC dataset of Figure 4, COLMAR query takes about 74 seconds.
Discussion and Conclusion
The emergence of metabolomics and metabonomics presents both new challenges and opportunities for experimental and computational NMR. Because covariance NMR allows spin correlations to be probed at spectral resolutions or sensitivities often not achievable via direct experimental measurements, it affords a substantial gain in the resolution obtainable within a fixed amount of measurement time, which is valuable for high-throughput applications in metabolomics studies using 2D spectroscopy. By developing the integrated web server approach COLMAR, we have demonstrated a strategy for high-throughput analysis and automation for the deconvolution of complex metabolite mixtures by multidimensional NMR. Together with the steadily growing NMR metabolomics databases, the COLMAR web server tools presented here are expected to substantially facilitate and speed-up the identification of metabolites for a wide range of biological mixtures.
The COLMAR web servers are intended to fill the growing need of new as well as more traditional NMR user groups. In particular, the availability of powerful yet easy-to-use web servers can greatly facilitate user operation by eliminating the need for individual software licensing, installation, and regular upgrading on the users’ local machines. Other advantages of web servers are their independence of local hardware, operating systems, libraries, and compilers. Remote web servers are already widely used for database searching (PDB34, BMRB35, DNA sequences, etc.). With modern computer power and network bandwidths, we anticipate that web-server based NMR data processing and analysis will become an attractive alternative to traditional desktop processing. The computer power of a modern (single processor) Linux machine reduces data transfer and covariance processing of a typical 2D NMR dataset to about 1 minute, which makes remote processing suitable for routine applications.
We have focused here on homonuclear NMR, but the concepts can be generalized to heteronuclear spectra, such as 1H-13C-HSQC-TOCSY, allowing for the identification of compounds in a mixture via both 1H and 13C 1D NMR traces.29 The COLMAR web server can be expanded in different directions, including the determination of quantitative compound concentrations and the simultaneous analysis of multiple TOCSY spectra for biomarker identification. Work along these lines is in progress in our lab.
Acknowledgments
This work was supported by the National Institutes of Health (grant R01 GM 066041 to R.B.). The NMR experiments were conducted at the National High Magnetic Field Laboratory (NHMFL) supported by cooperative agreement DMR 0654118 between the NSF and the State of Florida.
References
- 1.Nicholson JK, Wilson ID. Nature Reviews Drug Discovery. 2003;2:668. doi: 10.1038/nrd1157. [DOI] [PubMed] [Google Scholar]
- 2.Holmes E, Wilson ID, Nicholson JK. Cell. 2008;134:714. doi: 10.1016/j.cell.2008.08.026. [DOI] [PubMed] [Google Scholar]
- 3.Fiehn O. Plant Molecular Biology. 2002;48:155. [PubMed] [Google Scholar]
- 4.Kell DB. Curr Opin Microbiol. 2004;7:296. doi: 10.1016/j.mib.2004.04.012. [DOI] [PubMed] [Google Scholar]
- 5.Hodavance MS, Ralston SL, Pelczer I. Anal Bioanal Chem. 2007;387:533. doi: 10.1007/s00216-006-0979-z. [DOI] [PubMed] [Google Scholar]
- 6.Lenz EM, Wilson ID. Journal of Proteome Research. 2007;6:443. doi: 10.1021/pr0605217. [DOI] [PubMed] [Google Scholar]
- 7.Hyberts SG, Heffron GJ, Tarragona NG, Solanky K, Edmonds KA, Luithardt H, Fejzo J, Chorev M, Aktas H, Colson K, Falchuk KH, Halperin JA, Wagner G. Journal of the American Chemical Society. 2007;129:5108. doi: 10.1021/ja068541x. [DOI] [PMC free article] [PubMed] [Google Scholar]
- 8.Wishart DS. Trac-Trends in Analytical Chemistry. 2008;27:228. [Google Scholar]
- 9.Johnson CS. Progress in Nucl Magn Reson Spectrosc. 1999;34:203. [Google Scholar]
- 10.Xi YX, deRopp JS, Viant MR, Woodruff DL, Yu P. Metabolomics. 2006;2:221. [Google Scholar]
- 11.Sandusky P, Raftery D. Analytical Chemistry. 2005;77:7717. doi: 10.1021/ac0510890. [DOI] [PubMed] [Google Scholar]
- 12.Zhang F, Brüschweiler R. Chemphyschem. 2004;5:794. doi: 10.1002/cphc.200301073. [DOI] [PubMed] [Google Scholar]
- 13.Cloarec O, Dumas ME, Craig A, Barton RH, Trygg J, Hudson J, Blancher C, Gauguier D, Lindon JC, Holmes E, Nicholson J. Analytical Chemistry. 2005;77:1282. doi: 10.1021/ac048630x. [DOI] [PubMed] [Google Scholar]
- 14.Brüschweiler R, Zhang F. Journal of Chemical Physics. 2004;120:5253. doi: 10.1063/1.1647054. [DOI] [PubMed] [Google Scholar]
- 15.Brüschweiler R. Journal of Chemical Physics. 2004;121:409. doi: 10.1063/1.1755652. [DOI] [PubMed] [Google Scholar]
- 16.Trbovic N, Smirnov S, Zhang F, Brüschweiler R. J Magn Reson. 2004;171:277. doi: 10.1016/j.jmr.2004.08.007. [DOI] [PubMed] [Google Scholar]
- 17.Braunschweiler L, Ernst RR. Journal of Magnetic Resonance. 1983;53:521. [Google Scholar]
- 18.Bax A, Davis DG. Journal of Magnetic Resonance. 1985;65:355. [Google Scholar]
- 19.Ernst RR, Bodenhausen G, Wokaun A. Principles of Nuclear Magnetic Resonance in One and Two Dimensions. Clarendon Press; Oxford: 1987. [Google Scholar]
- 20.Chen Y, Zhang F, Bermel W, Brüschweiler R. Journal of the American Chemical Society. 2006;128:15564. doi: 10.1021/ja065522e. [DOI] [PubMed] [Google Scholar]
- 21.Zhang F, Brüschweiler R. Journal of the American Chemical Society. 2004;126:13180. doi: 10.1021/ja047241h. [DOI] [PubMed] [Google Scholar]
- 22.Blinov KA, Larin NI, Kvasha MP, Moser A, Williams AJ, Martin GE. Magn Reson Chem. 2005;43:999. doi: 10.1002/mrc.1674. [DOI] [PubMed] [Google Scholar]
- 23.Martin GE, Hilton BD, Blinov KA, Williams AJ. Magnetic Resonance in Chemistry. 2008;46:138. doi: 10.1002/mrc.2141. [DOI] [PubMed] [Google Scholar]
- 24.Chen Y, Zhang F, Bruschweiler R. Magnetic Resonance in Chemistry. 2007;45:925. doi: 10.1002/mrc.2068. [DOI] [PubMed] [Google Scholar]
- 25.Zhao Q, Stoyanova R, Du SY, Sajda P, Brown TR. Bioinformatics. 2006;22:2562. doi: 10.1093/bioinformatics/btl428. [DOI] [PubMed] [Google Scholar]
- 26.Snyder DA, Zhang F, Robinette SL, Bruschweiler-Li L, Brüschweiler R. Journal of Chemical Physics. 2008;128:052313. doi: 10.1063/1.2816782. [DOI] [PubMed] [Google Scholar]
- 27.Zhang F, Brüschweiler R. Angew Chem Int Ed. 2007;46:2639. doi: 10.1002/anie.200604599. [DOI] [PubMed] [Google Scholar]
- 28.Zhang F, Dossey AT, Zachariah C, Edison AS, Brüschweiler R. Anal Chem. 2007;79:7748. doi: 10.1021/ac0711586. [DOI] [PubMed] [Google Scholar]
- 29.Zhang F, Bruschweiler-Li L, Robinette SL, Brüschweiler R. Anal Chem. 2008;80:7549. doi: 10.1021/ac801116u. [DOI] [PMC free article] [PubMed] [Google Scholar]
- 30.Cui Q, Lewis IA, Hegeman AD, Anderson ME, Li J, Schulte CF, Westler WM, Eghbalnia HR, Sussman MR, Markley JL. Nat Biotechnol. 2008;26:162. doi: 10.1038/nbt0208-162. [DOI] [PubMed] [Google Scholar]
- 31.Lewis IA, Schommer SC, Hodis B, Robb KA, Tonelli M, Westler WM, Suissman MR, Markley JL. Anal Chem. 2007;79:9385. doi: 10.1021/ac071583z. [DOI] [PMC free article] [PubMed] [Google Scholar]
- 32.Wishart DS, Tzur D, Knox C, Eisner R, Guo AC, Young N, Cheng D, Jewell K, Arndt D, Sawhney S, Fung C, Nikolai L, Lewis M, Coutouly MA, Forsythe I, Tang P, Shrivastava S, Jeroncic K, Stothard P, Amegbey G, Block D, Hau DD, Wagner J, Miniaci J, Clements M, Gebremedhin M, Guo N, Zhang Y, Duggan GE, MacInnis GD, Weljie AM, Dowlatabadi R, Bamforth F, Clive D, Greiner R, Li L, Marrie T, Sykes BD, Vogel HJ, Querengesser L. Nucleic Acids Research. 2007;35:D521. doi: 10.1093/nar/gkl923. [DOI] [PMC free article] [PubMed] [Google Scholar]
- 33.Robinette SL, Zhang F, Bruschweiler-Li L, Brüschweiler R. Analytical Chemistry. 2008;80:3606. doi: 10.1021/ac702530t. [DOI] [PubMed] [Google Scholar]
- 34.Berman HM, Westbrook J, Feng Z, Gilliland G, Bhat TN, Weissig H, Shindyalov IN, Bourne PE. Nucl Acids Res. 2000;28:235. doi: 10.1093/nar/28.1.235. [DOI] [PMC free article] [PubMed] [Google Scholar]
- 35.Seavey BR, Farr EA, Westler WM, Markley JL. J Biolmol NMR. 1991;1:217. doi: 10.1007/BF01875516. [DOI] [PubMed] [Google Scholar]


