Figure 3.
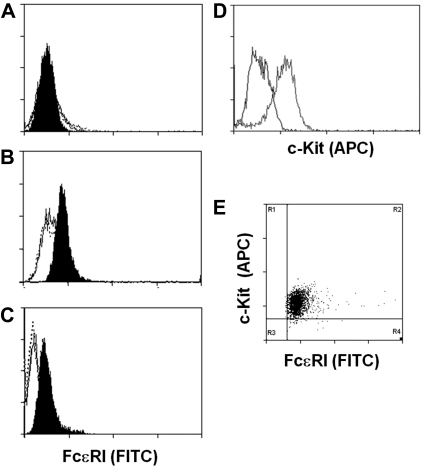
Expression of FcϵRI and c-Kit on ESMCs. FACS analysis of ESMCs. Staining of cells with anti-IgE antibody after exposure of cells with human IgE for 5 days (black), without IgE pretreatment (empty), and isotype control (empty dotted line). (A) ESMCs differentiated by coculture with OP9. (B) ESMCs differentiated by EB formation. (C) CBMCs. (D) Expression of c-Kit in ESMCs differentiated by EB formation. Isotype control (black), and anti–c-Kit antibody (gray). (E) Double staining of ESMCs by anti-IgE and anti–c-Kit antibody. Results shown are representative of 6 experiments.

