

Abstract
Gain modulation is an important feature of neural activity. Previous work has focused on the ability of background synaptic noise to modulate the slope (i.e., gain) of the frequency–current (f–I) relationship in neurons. To date, demonstrations of gain control that are independent of synaptic noise have been limited. We investigated the effects of increasing somatic conductance in the form of tonic inhibition on the initial and steady-state f–I relationship of CA1 pyramidal cells. We find that increasing membrane conductance reduces the gain of the steady-state f–I relationship through a graded increase in the magnitude of spike frequency adaptation. Increased adaptation arises through a conductance-induced depolarization of spike voltage threshold. Thus, by increasing the magnitude of spike frequency adaptation, added conductance can reduce the gain of the steady-state f–I relationship in the absence of random background membrane fluctuations.
Introduction
Gain modulation refers to a change in the scaling between the input and output of a system. It has been shown that gain modulation is an important aspect of brain function (Salinas and Thier, 2000; Salinas and Sejnowski, 2001). At the single-neuron level, gain modulation can manifest itself as a change in the slope of the spike frequency–current (f–I) relationship. Modeling and experimental results have shown that a decrease in gain (i.e., divisive gain control) can be implemented using membrane voltage fluctuations originating from synaptic activity (Doiron et al., 2001; Chance et al., 2002; Mitchell and Silver, 2003; Prescott and De Koninck, 2003; Shu et al., 2003). Additionally, conductance changes alone do not alter the slope of the f–I relationship (Gabbiani et al., 1994; Holt and Koch, 1997; Chance et al., 2002; Shu et al., 2003; Ulrich, 2003; Brizzi et al., 2004). Rather, the introduction of membrane voltage fluctuations associated with synaptic inputs reduces the gain of the f–I relationship by smoothing the nonlinear transition between the rest and spiking state (Anderson et al., 2000; Longtin, 2000; Doiron et al., 2001; Chance et al., 2002; Prescott and De Koninck, 2003; Higgs et al., 2006). Although in vitro work has emphasized the importance of synaptic noise in gain control, it is unclear whether this mechanism is implemented during in vivo activity. Recent work has shown that an increase in the size of membrane voltage fluctuations does not lead to an obligatory change in the gain of the single-neuron response (Cardin et al., 2008). It is only when the increase in membrane fluctuations occurs in combination with an increase in conductance and a depolarization in mean membrane voltage that a change in gain is observed (Cardin et al., 2008). This result suggests that mechanisms independent of synaptic-mediated noise may be important for gain control in neurons.
It has also been shown that gain control can be implemented in a noise-independent manner by reducing the influence of depolarizing dendritic feedback on somatic spike generation (Mehaffey et al., 2005). Additionally, increased somatic conductance can profoundly alter intrinsic neuronal properties, such as the spike voltage threshold and spike train oscillations (Prescott et al., 2006; Fernandez and White, 2008, 2009). Consequently, it is possible that, by changing intrinsic spiking dynamics, an increase in membrane conductance at the soma can scale the input–output function of neurons nonlinearly.
We investigated the ability for inhibitory conductance applied at the soma of CA1 pyramidal cells to modulate the gain of spike output. We find that increasing membrane conductance reduces the gain of the steady-state f–I relationship but has a weaker effect on the gain calculated from the initial spikes before spike frequency adaptation has developed. The reduction in gain with increased conductance is associated with a more depolarized spike voltage threshold and a depolarization of mean voltage during spike generation. The resulting depolarization leads to an increase in the magnitude of spike frequency adaptation, which causes a decrease in the gain of the steady-state f–I relationship.
Materials and Methods
Tissue preparation.
All experimental protocols were approved by the University of Utah Institutional Animal Care and Use Committee. Horizontal sections of hippocampus and entorhinal cortex were prepared from 21- to 31-d-old Long–Evans rats. All chemicals were obtained from Sigma unless otherwise noted. After anesthetization with isoflurane and decapitation, brains were removed and immersed in 0°C artificial CSF (ACSF) consisting of the following (in mm): 125 NaCl, 25 NaHCO3, 25 d-glucose, 2 KCl, 2 CaCl2, 1.25 NaH2PO4, and 1 MgCl2, buffered to pH 7.4 (95% O2/5% CO2). Horizontal slices were cut to a thickness of 400 μm (Vibratome 1000+; Vibratome). Slices were incubated in a 32°C bubbled ACSF for 30 min before being cooled to room temperature (20°C). After the incubation period, slices were moved to the stage of an infrared differential interference contrast-equipped microscope (Axioscope 2+; Zeiss). Slices were bathed in ACSF with 10 μm CNQX, 50 μm picrotoxin, and 30 μm AP-5 to block ionotropic synaptic activity. For application of linopirdine (10 μm) and XE991 [10,10-bis(4-pyridinylmethyl)-9(10H)-anthracenone] (5 μm), drugs were bath applied, and recordings were taken after a 10 min incubation period. All recordings were conducted between 32 and 34°C.
Electrophysiology.
Electrodes were drawn on a horizontal puller (P97; Sutter Instruments) and filled with an intracellular solution consisting of the following (in mm): 120 K-gluconate, 20 KCl, 10 HEPES, 7 diTrisPhCr, 4 Na2ATP, 2 MgCl2, 0.3 Tris-GTP, and 0.2 EGTA, buffered to pH 7.3 with KOH. Final electrode resistances were between 3 and 4 MΩ, with access values between 4 and 12 MΩ. Electrophysiological recordings were performed with a current-clamp amplifier (Axoclamp 2B; Molecular Devices), and data were acquired using custom software developed in Matlab (version 2007b; MathWorks) using the data acquisition toolbox.
For dynamic-clamp experiments, the current-clamp amplifier was driven by an analog signal from an 86× personal computer running Real-Time Application Interface Linux and an updated version of the Real-Time Linux Dynamic Clamp (Dorval et al., 2001) called Real-Time Experimental Interface (Bettencourt et al., 2008). Increases in conductance were introduced via dynamic clamp using the following equation:
 |
with Vmem representing pyramidal cell membrane voltage and Eleak representing the reversal voltage for the added conductance. For all experiments, Eleak was set to −65 mV. The magnitude of the leak conductance (gleak) added was set at 5, 10, or 15 nS.
For experiments implementing a noisy synaptic conductance stimulus, the conductance was generated using two independent conductances representing excitation and inhibition:
As in previous studies (Destexhe et al., 2001; Fellous et al., 2003), the terms ge(t) and gi(t) were implemented using an Ornstein–Uhlenbeck process and modeled using the following equations:
 |
In the equations, geμ and giμ represent the mean conductance for excitation and inhibition. De and Di represent the diffusion coefficients, and χe and χI are Gaussian white noise terms with unit SD. The terms τe and τi correspond to the time constant for excitation and inhibition, which were set to 2 and 8 ms, respectively. Conductance equations were solved numerically using the same method described by Destexhe et al. (2001).
The sample rate of the dynamic clamp was set to10 kHz. A measured junction potential of ∼10 mV was subtracted from all recordings and taken into account during dynamic-clamp experiments. Data were collected between 5 and 10 kHz and filtered at 3 kHz. Gain measurements from the f–I were taken within the linear range of the f–I relationship (usually below 25 Hz).
Simulations.
All simulations were solved in Matlab using a fourth-order Runge–Kutta solver at a time step of 0.01 ms. Bifurcation analyses were performed in XPPAUT version 5.86 (Ermentrout, 2002).
Equations for model were as follows:
 |
 |
 |
where τh = 200 ms. Additional model parameters were as follows: C = 1.5 μF/cm2, gNa+ = 6 mS/cm2, gleak = 0.03 mS/cm2, ENa+ = 50 mV, and Eleak = −65 mV. IE in the current balance equation refers to driving current. For spike repolarization, membrane voltage was reset to −65 mV subsequent to crossing 15 mV. The Na+ conductance activation (m) was modeled using only the steady-state function. Hence, the activation variable associated with Na+ conductance equilibrates instantaneously with membrane voltage. For the model incorporating a spike-dependent form of spike frequency adaptation, we removed the h variable and incorporated a new variable for adaptation (n). Equations for model were as follows:
 |
 |
where n was increased by an increment of 0.001 during a spike threshold crossing, and τn = 200 ms. Additional model parameters were as follows: gK+ = 6 mS/cm2, and EK+ = −80 mV. All other parameters were identical to the first model.
Analysis and statistics.
All analysis were performed in Matlab (version 2007b) using custom software and/or built-in functions. Spike times were determined using an analysis of the cell membrane derivative (dV/dt) and defining spike threshold as a fluctuation in dV/dt that was 5 SDs away from the mean dV/dt. The current protocol for input impedance measurements consisted of a Gaussian current input with a frequency cutoff of 100 Hz. Impedance [Z(f)] was calculated by taking the ratio of the Fourier transform of the membrane voltage response and current input stimulus:
 |
The frequency of spike firing was calculated from the mean interspike interval (ISI) value. For the initial frequency, the value was calculated from the first spike. Steady-state frequency was taken from the mean ISI value for the last third of the 4 s current pulse used to drive spike firing during f–I measurements. This corresponded to the steady-state region of the spike frequency versus time relationship. The spike rate of rise was defined as the maximum positive value of the dV/dt associated with the spike trajectory. Gain was calculated from a linear regression analysis of the linear portion of the f–I relationship. Mean spiking voltage was defined as the mean voltage value during spike firing. This value includes both the spike and the interspike voltage trajectory. Statistical significance was determined using either a one-way or two-way ANOVA. For repeated measures, statistical difference was determined using Tukey's honestly significant criteria. Means are presented with the SEM.
Results
To quantify the effects of increased membrane conductance on the spike output gain in CA1 pyramidal cells, we measured the f–I relationship using 4 s current steps in the presence of different levels of added conductance. A constant conductance with a reversal potential of −65 mV was added at the soma at a level of 5, 10, or 15 nS via dynamic clamp to simulate the effects of tonic inhibition originating from inhibitory interneuron activity. CA1 pyramidal cells receive a large amount of GABAA receptor-mediated inhibition at the soma and proximal dendrite via basket cell inputs (Freund and Buzsáki, 1996; Megías et al., 2001). Additionally, it has been shown that inhibitory synaptic activity can significantly reduce the input resistance of CA1 pyramidal cells in vivo (Kamondi et al., 1998). Thus, we used a tonic conductance applied at the soma as a first approximation for studying the effects of inhibition on CA1 pyramidal cell output.
For all f–I measurements, cells were held between −65 and −60 mV using small amounts of direct current before eliciting spike firing with the current step protocol. We adjusted the current step protocol to capture the linear range of the f–I relationship under each level of added conductance. In a minority of cells (∼21%), adding 10 nS or more of conductance prevented spike firing at steady state. Under these conditions, cells produced only a few initial spikes in response to large-amplitude square current inputs (>250 pA). We should note that the absence of steady-state spike firing with added conductance has been observed previously in CA1 pyramidal cells (Prescott et al., 2006). For the purposes of this study, however, CA1 pyramidal cells that could not sustain spike firing at steady state in response to our current protocol in the presence of added conductance were not included in the analysis. Generally, steady-state firing in CA1 pyramidal cells was attained within 1 s of the initial spike. To ensure that we measured steady-state firing rate at each current step accurately, we calculated steady-state firing by averaging the spike rate over last third of the 4 s current step.
Increased membrane conductance resulted in a decrease in the slope of the steady-state f–I relationship (i.e., a divisive change in gain) as determined using a linear fit to the data points (r > 0.95) (Fig. 1A,B). The gain was reduced significantly at each level of added conductance (n = 16, p < 0.001, one-way ANOVA, Tukey's test) (Fig. 1C). A linear fit to the normalized (relative to control) steady-state gain versus conductance relationship for individual cells indicated that increased levels of conductance decreased the gain in a graded and linear manner (r = 0.91 ± 0.02, n = 16). Accordingly, adding 5, 10, and 15 nS of conductance reduced the average normalized steady-state gain to 0.76 ± 0.05, 0.56 ± 0.03, and 0.40 ± 0.03, respectively (Fig. 1C). We also measured the gain at time points before the spike rate reached a steady-state value. Spike frequency measurements were taken at 100 and 250 ms after the initial current step and averaged for 10 subsequent spikes. At both 100 and 250 ms, the gain was significantly reduced by the added conductance (n = 16, p < 0.001, one-way ANOVA, Tukey's test) (Fig. 1C). The gain calculated at 100 ms, however, was reduced significantly less with 10 and 15 nS of added conductance relative to the steady-state values (p = 0.0198 for 10 nS and p = 0.0024 for 15 nS) (Fig. 1C). Nevertheless, significant changes in gain could be detected relatively early in the spike train before spike frequency had reached a steady-state value.
Figure 1.
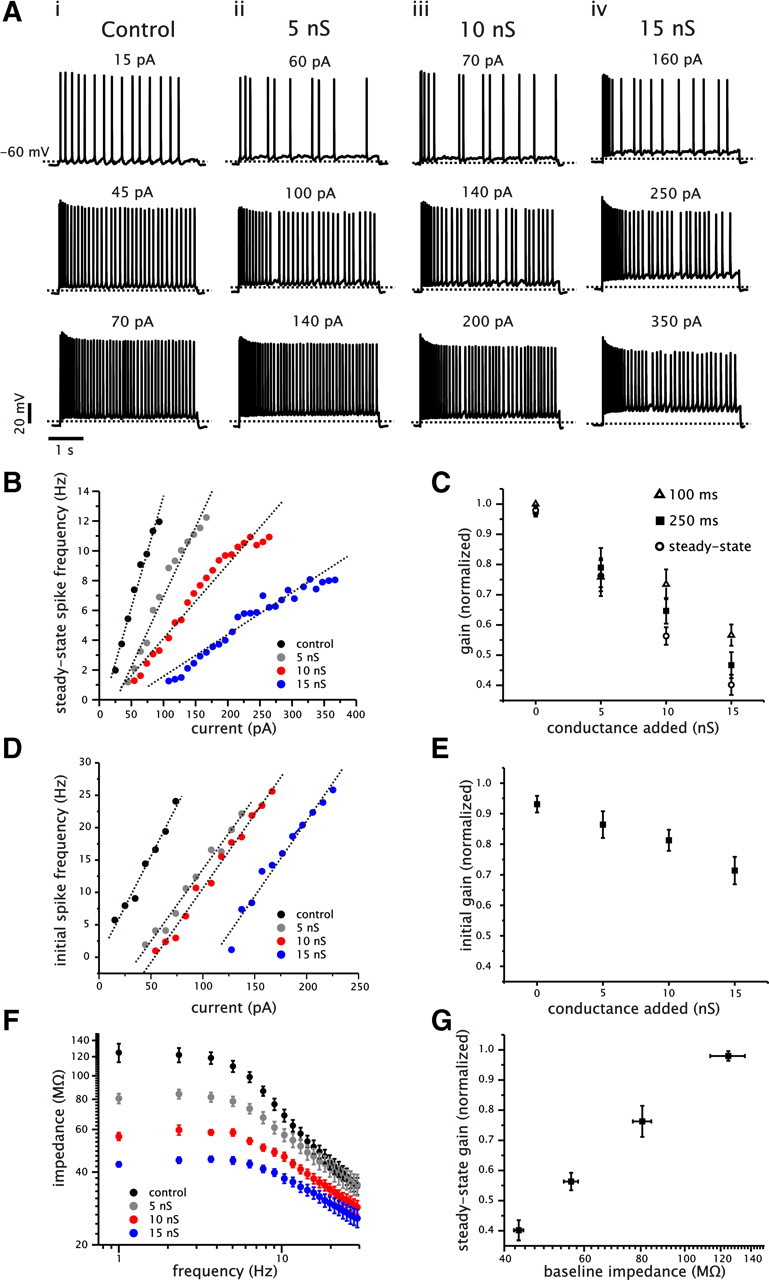
Increased somatic conductance reduces the gain of the steady-state f–I relationship of CA1 pyramidal cells. A, Examples of voltage traces from a single CA1 pyramidal cell with different levels of added conductance (i–vi: control, 5, 10, and 15 nS) in response to 4 s current steps. For each level of conductance, three levels of firing range are shown, which correspond approximately to the low, medium, and high spike frequency range of the f–I plot for each level of conductance. B, Plot of the steady-state f–I relationship for a single cell (same cell as shown in A) under different levels of added conductance. Data points for each conductance level were fit using a linear regression (dashed lines) to calculate the gain of the f–I relationship. C, Plot of average normalized gain as a function of added conductance for spike frequencies calculated at steady state (open circles), 100 ms (open triangles), and 250 ms (filled squares). For each level of added conductance, the gain was calculated as in B and then normalized to the control value. D, Plot of the initial (first spike) f–I relationship for a single cell (same cell as shown in A) under different levels of added conductance. E, Plot of average normalized initial gain calculated for each level of added conductance. As before, the gain was normalized to the control value. F, Plot of input impedance for CA1 pyramidal cells under control conditions and in the presence of 5, 10, and 15 nS of added conductance. G, Plot of normalized steady-state gain as a function of baseline input impedance.
In contrast to the steady-state f–I relationship, the effect of added conductance on gain measured from the first spike frequency values (initial gain) were more modest, with changes of 0.86 ± 0.03, 0.81 ± 0.04, and 0.71 ± 0.04 with 5, 10, and 15 nS of conductance, respectively (n = 16, p = 0.0013, one-way ANOVA). Increased conductance was only able to reduce the initial gain significantly at a level of 15 nS of added conductance (n = 16, Tukey's test) (Fig. 1E). We also noted an increase in the degree of saturation in the f–I relationship with added conductance. In the majority of cells (13 of 16 cells), we observed that 10 or 15 nS of added conductance lead to a lower maximum sustainable firing rate than under control conditions.
To verify the effects of added conductance on membrane resistance, we measured the resulting changes in input impedance in the subthreshold region (approximately −80 mV). We used a Gaussian current input that generated small membrane voltage fluctuations (5 mV peak-to-peak) and calculated input impedance (Z) as the ratio of the Fourier transform of the voltage response and current input. As expected, the addition of conductance decreased the baseline input impedance (defined here at 1 Hz) from 125 ± 11 MΩ in control to 80 ± 3.8, 56 ± 2.0, and 43 ± 1.0 MΩ with 5, 10, and 15 nS of conductance, respectively (n = 16) (Fig. 1F). Thus, changes in membrane resistance were associated with significant changes in steady-state gain (Fig. 1G).
Increased conductance delivered via noisy stimuli reduces gain in CA1 pyramidal cells
Past work has established that neurons in vivo are continuously bombarded with synaptic activity that generates noisy fluctuations in membrane voltage (Softky and Koch, 1993; Anderson et al., 2000; Destexhe et al., 2001, 2003). Additionally, noise has been implicated in previous mechanisms of gain control (Doiron et al., 2001; Chance et al., 2002; Mitchell and Silver, 2003; Prescott and De Koninck, 2003). Thus, it is important to consider the effects of membrane fluctuations on the ability of conductance to reduce the gain. To assess whether the changes in gain observed with constant conductance could be achieved under noisy conditions, we measured the steady-state f–I relationship in the presence of a noisy stimulus that incorporated realistic levels of excitatory and inhibitory synaptic conductance (Atallah and Scanziani, 2009). Noisy excitatory and inhibitory synaptic inputs were implemented using an Ornstein–Uhlenbeck process (see Materials and Methods). We set the mean conductance for excitation and inhibition at 2 and 8 nS, respectively. The amplitude of the noise in each conductance process was set so that peak-to-peak membrane voltage fluctuation were 5–10 mV (Fig. 2A). The reversal potentials for excitation and inhibition were set to 0 and −65 mV, respectively. The effect of membrane fluctuations in the absence of an increase in conductance was tested by setting the mean value of the excitatory and inhibitory conductance (geμ and giμ) in the Ornstein–Uhlenbeck process to 0. Conversely, the effect of conductance without noise was implemented by adding two separate tonic conductances with reversals of 0 and −65 mV at a magnitude of 2 and 8 nS. As before, cells were held between −65 and −60 mV before eliciting current steps.
Figure 2.

Increased membrane conductance introduced via a noisy process decreases the gain of CA1 pyramidal cells. A, Examples of voltage traces from a single CA1 pyramidal cell stimulated with a noisy input generated via an Ornstein–Uhlenbeck process. Left column shows examples of traces generated when the mean excitatory and inhibitory conductance were set to 0. In the right column, traces were generated with a tonic excitatory and inhibitory conductance of 2 and 8 nS, respectively (total of 10 nS). B, Plot of the steady-state f–I relationship for a single cell stimulated using an Ornstein–Uhlenbeck process with or without a conductance component (same cell as shown in A). Data points for each conductance level were fit using a linear regression (dashed lines) to calculate the gain of the f–I relationship. C, Plot of average normalized steady-state gain as a function of stimulus condition. For each condition, the gain was calculated using a linear regression analysis and then normalized to the control value.
For each cell, we compared the gain under control conditions and with membrane fluctuations induced with or without the conductance component. As shown in Figure 2, added conductance continued to decrease the gain in the presence of membrane voltage fluctuations (Fig. 2A,B). The normalized gain relative to control decreased to 0.70 ± 0.05 when conductance was added via simulated synaptic inputs (p = 0.007, n = 10). Moreover, the gain under tonic conductance and conductance added via simulated synaptic inputs was not significantly different (p = 0.09, n = 10). These data indicate that changes in conductance implemented via noisy processes can reduce the gain of CA1 pyramidal cells to levels comparable with that observed under constant inhibitory conductance.
Surprisingly, we did not observe a significant reduction in gain when membrane fluctuations were introduced in the absence of added conductance despite a leftward shift in the f–I relationship. This result differs from previous studies that have found that the introduction of membrane fluctuations leads to a significant reduction in gain by selectively increasing the firing probability at voltage and current values near spike threshold (Chance et al., 2002; Shu et al., 2003). A more recent study, however, has shown that the ability for membrane fluctuations to influence the gain depends on intrinsic biophysical properties such as the spike afterhyperpolarization and spike frequency adaptation (Higgs et al., 2006). These authors concluded that noise can increase spike generation at high firing rates by reducing the cumulative activation of the adaptation process. By increasing the spike rate at both high and low firing rates, noise can produce a leftward additive shift in the f–I relationship.
Increasing membrane conductance increases the magnitude of spike frequency adaptation
To begin to investigate the mechanism through which increased membrane conductance reduced the gain of the steady-state response, we measured some basic characteristics of neuronal excitability as a function of the conductance added. In previous experiments, we noticed an increase in the amount of spike frequency adaptation as the level of added conductance was increased (Fig. 1A). Given the ability for spike frequency adaptation to reduce the gain in neurons (Spain, 1994; Ermentrout, 1998; Benda and Herz, 2003; Prescott and Sejnowski, 2008), we predicted that the observed reduction in gain could be explained by an increase in the magnitude of spike frequency adaptation with increased conductance. This hypothesis was also supported by the fact that changes in gain were essentially absent in the initial spike frequency value before adaptation was observed.
The magnitude of spike frequency adaptation was quantified by taking the ratio of the mean steady-state ISI to the first ISI value (a higher number indicates an increase in the magnitude of adaptation). For each level of conductance, we measured the adaptation ratio when cells fired at a steady-state rate of ∼5 Hz. A comparison of the adaptation ratio showed that adding conductance increased the adaptation ratio significantly relative to control (n = 15, p < 0.001, one-way ANOVA) (Fig. 3A,B). The adaptation magnitude increased to 1.39 ± 0.13, 2.39 ± 0.39, and 2.96 ± 0.37 under 5, 10, and 15 nS of added conductance. By increasing the magnitude of spike frequency adaptation in a graded manner, increased membrane conductance reduced the slope of the steady-state f–I relationship of CA1 pyramidal cells proportional to the amount of conductance added.
Figure 3.

Increasing membrane conductance increases the magnitude of spike frequency adaptation in CA1 pyramidal cells. A, Example of voltage traces from a single CA1 cell generated in response to 4 s square current steps under control conditions and with 5, 10, and 15 nS of added conductance. Panels show the initial membrane voltage response to the current step (i) and steady-state response (ii). B, Plot of the adaptation ratio as a function of added conductance. Adaptation ratio was measured when cells fired at an approximate steady-state firing rate of 5 Hz and was normalized to control values for each cell.
Increasing membrane conductance causes a depolarizing shift in the spiking voltage of CA1 pyramidal cells
We followed by investigating the biophysical mechanism responsible for the increase in spike frequency adaptation. Previous modeling work in CA1 pyramidal cells has shown that a high conductance state can lead to a depolarizing shift in spike voltage threshold and a consequent increase in the activation level of slow K+ currents during spike generation (Prescott et al., 2006). This effect could account for the increase in spike frequency adaptation with increased membrane conductance.
We started by measuring the effect of added conductance on the minimum amount of current input required to elicit spike firing (i.e., rheobase). We quantified a change in rheobase by measuring the difference in rheobase at each level of added conductance relative to control (Fig. 4B). The addition of conductance had a significant impact on rheobase, with the value increasing by 20 ± 5.0, 46 ± 6.8, and 67 ± 12.8 pA under 5, 10, and 15 nS of added conductance, respectively (n = 16, p < 0.001, one-way ANOVA) (Fig. 4B). A change in rheobase is expected because of the decrease in membrane resistance associated with added conductance and the corresponding increase in current required to elicit a voltage fluctuation of sufficient magnitude to cross the spike voltage threshold. We were surprised, however, by the large increase in rheobase given that cells were held very close to the voltage threshold for spike firing observed under control conditions (between −60 and −55 mV). As noted previously, however, increased conductance can also increase the voltage threshold for spike firing. Hence, the increase in rheobase could result from a combination of a reduction in membrane resistance and a depolarization of the voltage required for generating spikes.
Figure 4.
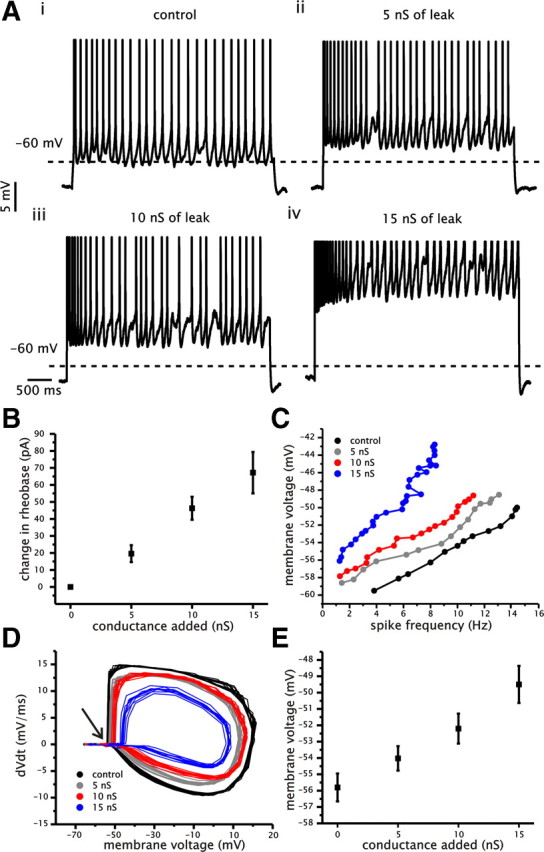
Increased membrane conductance increases spike voltage threshold and mean voltage during spike generation. A, Examples of voltage traces from a single CA1 pyramidal cell with different levels of added conductance (i–vi: control, 5, 10, and 15 nS) in response to a 4 s current step. Current steps were modified to maintain an approximate steady-state firing rate of 5 Hz. Dashed lines indicate the −60 mV level. B, Plot of average change in rheobase relative to control for each level of added conductance. C, Example plot of mean membrane voltage as a function of spike firing frequency under control and for 5, 10, and 15 nS of added conductance. D, Plot of the voltage derivative (dV/dt) as a function of membrane voltage under control and for 5, 10, and 15 nS of added conductance during steady-state spike firing at an approximate frequency of 5 Hz. Arrow indicates region of rapid increase in the membrane voltage trace associated with spike generation. E, Plot of average membrane voltage during spike firing (averaged for each cell across entire f–I range) as a function of the level of added conductance.
A comparison of the mean membrane voltage during spike firing indicated a depolarization of spiking voltage with increased membrane conductance (Fig. 4A,C). Furthermore, a plot of the membrane derivative (dV/dt) as a function of membrane voltage revealed that the point of inflection (Fig. 4D, arrow), corresponding to the initial depolarization associated with spike generation, occurred at a progressively more depolarized voltage with the addition of conductance (Fig. 4D). To quantify the effect of conductance on spiking voltage, we averaged the mean membrane voltage data points (average of the connected data points shown in Fig. 4C) associated with each conductance level for individual cells across the range of the f–I relationships (Fig. 4E). This analysis indicated that the average membrane voltage during spiking was significantly more depolarized with increased levels of membrane conductance (n = 15, p < 0.001, one-way ANOVA) (Fig. 4E). This effect occurred despite the fact that the steady-state f–I relationship under control conditions had higher spike frequency values than with added conductance (Fig. 4C). Similar to the changes in gain observed in the steady-state f–I relationship, the addition of conductance changed the mean spiking voltage in a graded and linear manner (r = 0.97 ± 0.01, n = 15). Hence, achieving a given steady-state spike firing frequency with increased conductance required a more depolarized mean membrane voltage than under control conditions. We should note that the range of membrane voltage values measured under different levels of conductance is within the range of values that have been reported in vivo (Kamondi et al., 1998; Isomura et al., 2006). The increase in spike voltage threshold can be explained by the shunting effect of increased membrane conductance on the ability for Na+ current to influence membrane voltage. This is similar to the way leak can shunt an external direct current input. Consequently, to activate sufficient Na+ conductance for spike initiation requires increased depolarization.
We hypothesized that the increase in the magnitude of spike frequency adaptation with conductance was related to an increase in adaptation evident with strong depolarization under control conditions. We evaluated the magnitude of adaptation under control conditions over a range of membrane voltages similar to the changes in mean spiking voltage induced by added conductance (∼10 mV). As a result, we measured the adaptation ratio over a region that included the nonlinear portion of the steady-state f–I relationship. In the absence of added conductance, we found that the adaptation ratio increased as a function of mean membrane voltage (p = 0.0024, n = 9) (Fig. 5A,B). As shown in Figure 5B, the variability in the adaption ratio increased at the more depolarized membrane voltages. This was caused by the variability in the frequency and voltage at which saturation in the steady-state f–I relationship was first observed.
Figure 5.

The magnitude of spike frequency adaptation in CA1 pyramidal cells increases as function of mean membrane voltage depolarization. A, Example plot of f–I relationships calculated from the initial (black circles) and steady-state (gray circles) spike firing frequency. Inset shows plot of adaptation ratio (steady-state ISI divided by initial ISI) as a function of mean membrane voltage. B, Plot of average adaptation ratio as a function of mean membrane voltage under control conditions (no added conductance).
Thus, the steady-state f–I relationship displayed a larger degree of saturation than the initial f–I relationship (Fig. 5A). As a consequence, as cells were depolarized with larger direct current input and made to generate spikes more often, the adaptation ratio increased. Thus, consistent with our original hypothesis, the magnitude of spike frequency adaptation in CA1 cells is voltage dependent and can account for the increase in adaptation observed with increased conductance and depolarization of mean spiking voltage for a given spike frequency rate. This result is also consistent with the potential ability of a more depolarized spiking voltage to increase the activation levels of voltage-dependent mechanisms that have been suggested to contribute to spike frequency adaptation in CA1 pyramidal cells (e.g., K+ conductance activation or Na+ conductance inactivation).
Evaluating the role of M-current in spike frequency adaptation and gain control
Previous work has implicated a slow activating and voltage-sensitive K+ current (M-current, IM) in spike frequency adaptation in CA1 pyramidal cells (Madison and Nicoll, 1984; Aiken et al., 1995; Peters et al., 2005; Otto et al., 2006). In fact, it has been suggested through modeling that the increase in spiking voltage associated with a high conductance state can activate a greater amount of IM (Prescott et al., 2006, 2008). Therefore, the reduction in gain and increase in spike frequency adaptation could be a result of increased IM activation.
To test whether the increase in membrane conductance reduced the steady-state gain through increased IM activation, we bath applied the IM blocker linopirdine at a concentration of 10 μm (Aiken et al., 1995). We predicted that a decrease in the magnitude of spike frequency adaptation with IM blocked would reduce the ability for added conductance and a depolarization in the spiking voltage to divisively scale the steady-state f–I relationship.
First, we established whether linopirdine significantly changed spike frequency adaptation under control conditions (Fig. 6A,B). In a subset of CA1 pyramidal cells (3 of 10), application of linopirdine resulted in strong oscillatory bursting behavior, which prevented an analysis of the time course of spike frequency adaptation (data not shown). These cells were not included in the analysis. In the remaining cells, spike frequency adaptation was measured for the first 15 ISI values during steps that induced similar initial spike frequency rates in control and with bath-applied linopirdine (∼15 Hz). We controlled for the initial firing rate because the magnitude of spike frequency adaptation can depend critically on the initial spike rate (Benda and Herz, 2003). We found that the time course of spike frequency adaptation was significantly altered between control and 10 μm linopirdine application (n = 7, p < 0.001, two-way ANOVA) (Fig. 6B). The frequency of the last ISI value, however, was not significantly different between the two conditions (p = 0.13). Hence, 10 μm linopirdine changed the time course of spike frequency adaptation but did not affect the degree of adaptation at steady state.
Figure 6.
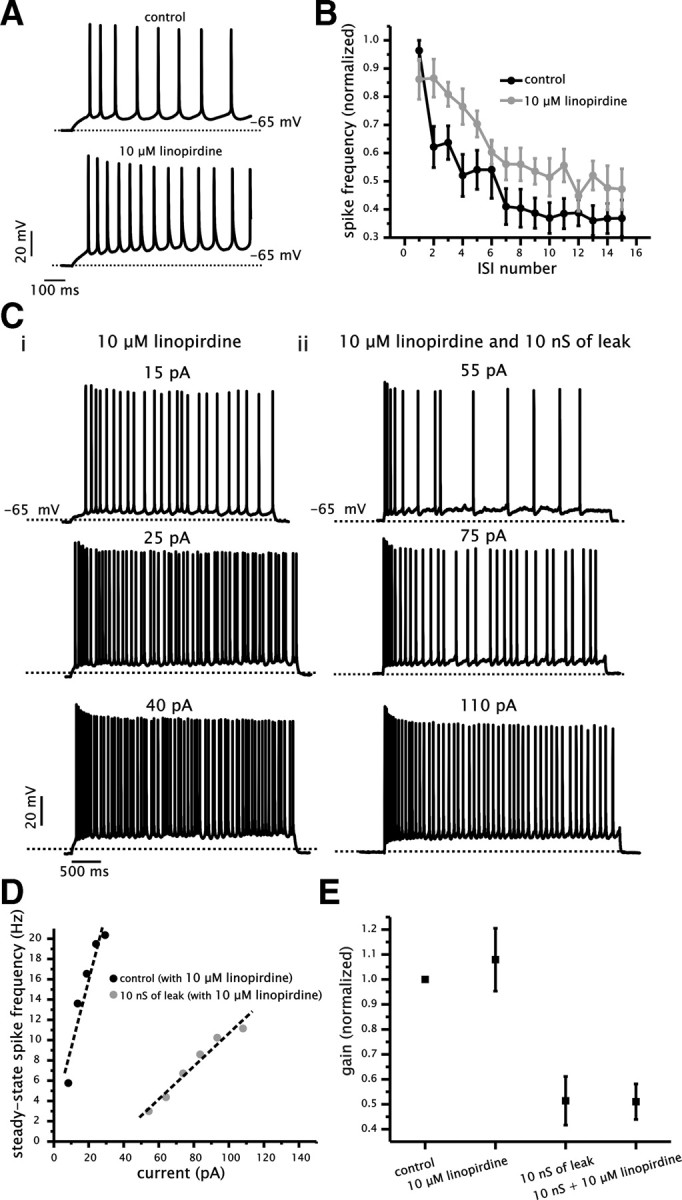
Block of IM with linopirdine does not affect the ability of added conductance to reduce the gain of the f–I relationship. A, Example of voltage traces generated in response to square current steps under control (top) and with 10 μm bath-applied linopirdine (bottom). B, Plot of normalized spike frequency as a function of ISI number for control (black circles) and with linopirdine (gray circles). C, Example of voltage traces generated in response to 4 s square current steps in the presence of linopirdine with or without added conductance (10 nS). D, Plot of the steady-state f–I relationship for a single cell in the presence of linopirdine with (black circles) and without (gray circles) added conductance (10 nS). E, Plot of normalized gain for control and 10 μm bath-applied linopirdine with or without 10 nS of added conductance. For each cell, gain measurements were normalized to the control value.
We proceeded to test whether the presence of 10 μm bath-applied linopirdine reduced the ability for added conductance to alter the gain of the steady-state f–I relationship. For these sets of experiments, we added only a single level of conductance (10 nS). As before, gain was calculated using a linear fit to the f–I relationship and normalized for individual cells relative to control. The presence of linopirdine did not alter the ability of 10 nS of conductance to reduce the gain of the steady-state f–I relationship (Fig. 6A,D). Added conductance reduced the gain under both control and 10 μm linopirdine (n = 6, p = 0.0014, one-way ANOVA, Tukey's test) (Fig. 6D,E), with values of 0.51 ± 0.1 and 0.51 ± 0.07, respectively, which were not significantly different (p = 0.96). Furthermore, the adaptation ratio, as measured in Figure 5, continued to increase with added conductance in the presence of linopirdine (3.6 ± 1.1, p = 0.02, n = 6).
We also tested the effects of 5 μm bath-applied XE991, a different IM blocker (Wang et al., 1998). All measurements were taken using the same methodology as with linopirdine. We started by assessing the effect of XE991 on spike frequency adaptation without the addition of an artificial conductance (supplemental Fig. S1, available at www.jneurosci.org as supplemental material). Unlike linopirdine, the bath application of 5 μm XE991 had no significant effect on spike frequency adaptation when the initial spike rates under control and with XE991 were matched (∼15 Hz) (n = 8, p = 0.18, two-way ANOVA) (supplemental Fig. S1A, available at www.jneurosci.org as supplemental material). We followed by testing the effect of XE991 on the ability for added leak conductance (10 nS) to change the gain of the f–I relationship. As with linopirdine, the addition of conductance in the presence of XE991 continued to reduce the gain of the f–I relationship (n = 10, p < 0.001, one-way ANOVA, Tukey's test) (supplemental Fig. S1C,D, available at www.jneurosci.org as supplemental material) by an amount similar to that observed under control conditions (p = 0.19).
In summary, we have shown that IM has a potential contribution to spike frequency adaptation in CA1 pyramidal cells. The overall impact of established IM blockers on adaptation, however, was relatively small. More importantly for the purposes of this study, neither linopirdine nor XE991 affected the ability of increased membrane conductance to reduce the gain. These data suggest that additional mechanisms are playing a significant role in setting spike frequency adaptation and the ability for increased membrane conductance to modulate the steady-state gain of CA1 pyramidal cells.
Role of cumulative Na+ current inactivation in spike frequency adaptation and gain control
As an alternative to an increase in IM activation, we considered the hypothesis that a depolarization in spiking voltage was increasing spike frequency adaptation through an increase in cumulative Na+ conductance inactivation. This mechanism is consistent with studies indicating a strong cumulative inactivation process for Na+ conductance in CA1 pyramidal cells (Colbert et al., 1997; Jung et al., 1997; Mickus et al., 1999). Furthermore, previous work has illustrated that cumulative Na+ conductance inactivation plays a significant role in spike frequency adaptation in other neuron types (Fleidervish et al., 1996; Melnick et al., 2004).
To quantify a potential loss of Na+ current during spike firing, we measured the rate of rise associated with the depolarizing upstroke of single spikes in the presence of different levels of conductance. The rate of rise associated with spikes has been shown previously to be an accurate method for assessing the relative availability of Na+ current during spike firing (Fleidervish et al., 1996; Melnick et al., 2004). We started by establishing whether cumulative inactivation of Na+ current was present under control conditions during current steps evoking spike frequency adaptation (initial and steady-state firing rate of ∼15 and 5 Hz, respectively). This measurement revealed that the spike rate of rise decreased significantly during spike frequency adaptation (n = 15, p < 0.001, one-way ANOVA) (Fig. 7B). Thus, spike frequency adaptation was associated with a significant cumulative reduction in the availability of Na+ conductance underlying spike generation.
Figure 7.
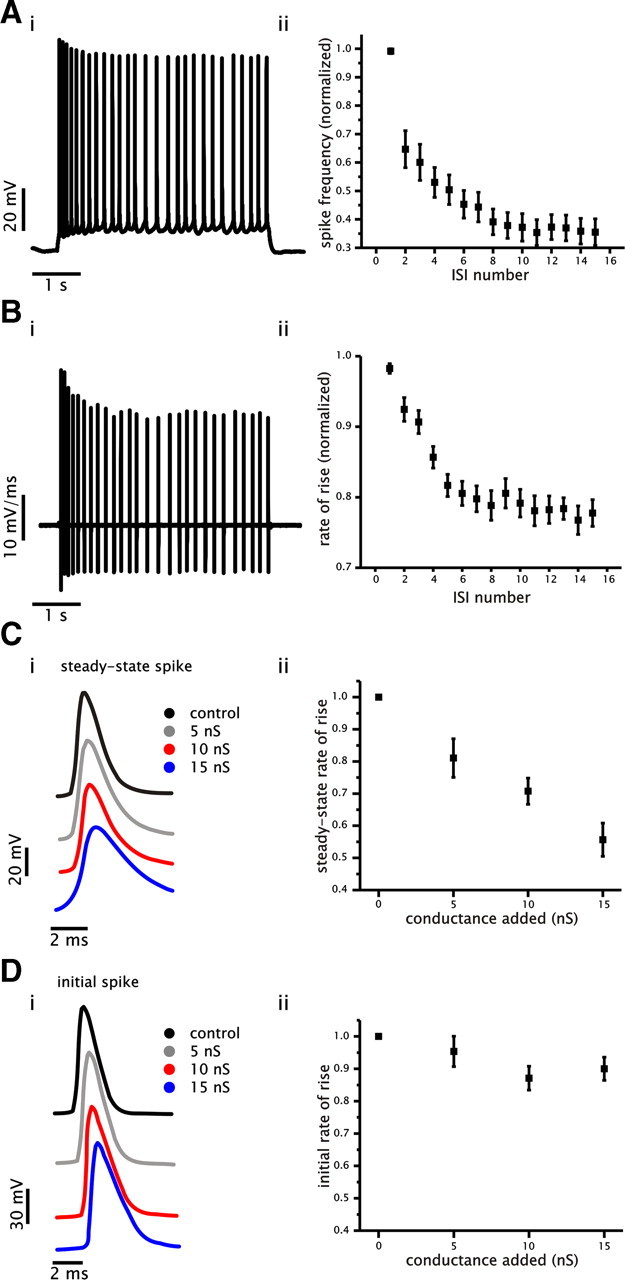
Spike frequency adaptation and changes in gain by added conductance correlate with decreased Na+ conductance availability. A, Example of a voltage trace showing spike frequency adaptation that was generated in response to a 4 s current step under control conditions (i). Plot of average normalized spike frequency as a function of ISI number (ii). B, Example of a membrane voltage derivative trace generated in response to a 4 s current step (same cell as shown in Ai). Plot of average normalized spike rate of rise for spikes generated at steady state as a function of ISI number under control conditions (ii). C, Examples of spike voltage trajectories generated at an approximate steady-state firing frequency of 5 Hz under control and with 5, 10, and 15 nS of added conductance (i). Plot of average normalized rate of rise for steady-state spikes as a function of added conductance (ii). D, Examples of spike voltage trajectories taken from the initial spike under control and with 5, 10, and 15 nS of added conductance (i). Plot of average normalized rate of rise for initial spikes as a function of added conductance (ii).
Next, we measured the rate of rise of spikes at a steady firing rate under control and with 5, 10, and 15 nS of added conductance. We hypothesized that an increase in Na+ inactivation at steady state with increased levels of added conductance would be reflected in a progressive decrease in the rate of rise of spikes at steady state. For each level of conductance, the rate of rise was measured from spikes elicited at a steady-state firing rate of ∼5 Hz. As shown in Figure 7C, steady-state spikes were associated with progressively slower rates of rise with increased levels of conductance (n = 15, p < 0.001, one-way ANOVA) (Fig. 7C) despite being generated at the same frequency. In contrast, the rate of rise of the initial spikes was not significantly affected (n = 15, p = 0.07, one-way ANOVA) (Fig. 7D). These data suggest that added conductance can reduce the availability of Na+ current at steady state, which can then increase the magnitude of adaptation and reduce the steady-state gain.
A conductance-based model can account for changes in spiking voltage, spike frequency adaptation, and gain
To test whether cumulative Na+ conductance inactivation could account for changes in gain of the steady-state f–I relationship with added conductance, we built a simple phenomenological conductance-based model. In particular, we wanted to test the hypothesis than an increase in membrane conductance could increase spike voltage threshold and interact with the inactivation of Na+ conductance to produce a decrease in gain of the steady-state f–I relationship. The model incorporates two dynamic variables, which include membrane voltage (V) and a slow inactivation of Na+ conductance (h). For simplicity, we reset the voltage variable to −65 mV to simulate spike repolarization subsequent to the voltage reaching a predefined value (15 mV). The inactivation of Na+ conductance was modeled using a single-order process with a fixed time constant (200 ms). For the voltage dependence of inactivation, we used values similar to previous models using Na+ inactivation to generate spike frequency adaptation and consistent with recordings from cortical neurons (Fleidervish et al., 1996). To simulate increased membrane conductance, the maximum leak conductance (gleak) in the model was increased from 0.03 to 0.13 mS/cm2. Other model parameters were set to match membrane time constant, voltage threshold, and the qualitative relationship between the initial and steady-state f–I curves. Similar to the experiments, we drove the model with square current steps under different levels of leak conductance and calculated the gain from the initial and steady-state spike firing frequency.
We first established the effects of increasing leak conductance on the voltage threshold for spike firing (Fig. 8B). To determine voltage threshold accurately, we used a bifurcation analysis (see Materials and Methods). This analysis tracks the voltage at which the stable fixed point, corresponding to the resting membrane voltage, loses stability and a stable firing solution is formed. Increasing the leak conductance in the model from 0.03 to 0.13 mS/cm2 results in a depolarizing shift of the voltage threshold for spike firing by an amount comparable with what was observed experimentally (Fig. 8B). Additionally, like CA1 pyramidal cells, the steady-state f–I relationships of the model show a greater degree of saturation than the initial f–I curves (Fig. 8C). Thus, like the cell, the model shows an increase in the adaptation ratio with increased depolarization.
Figure 8.
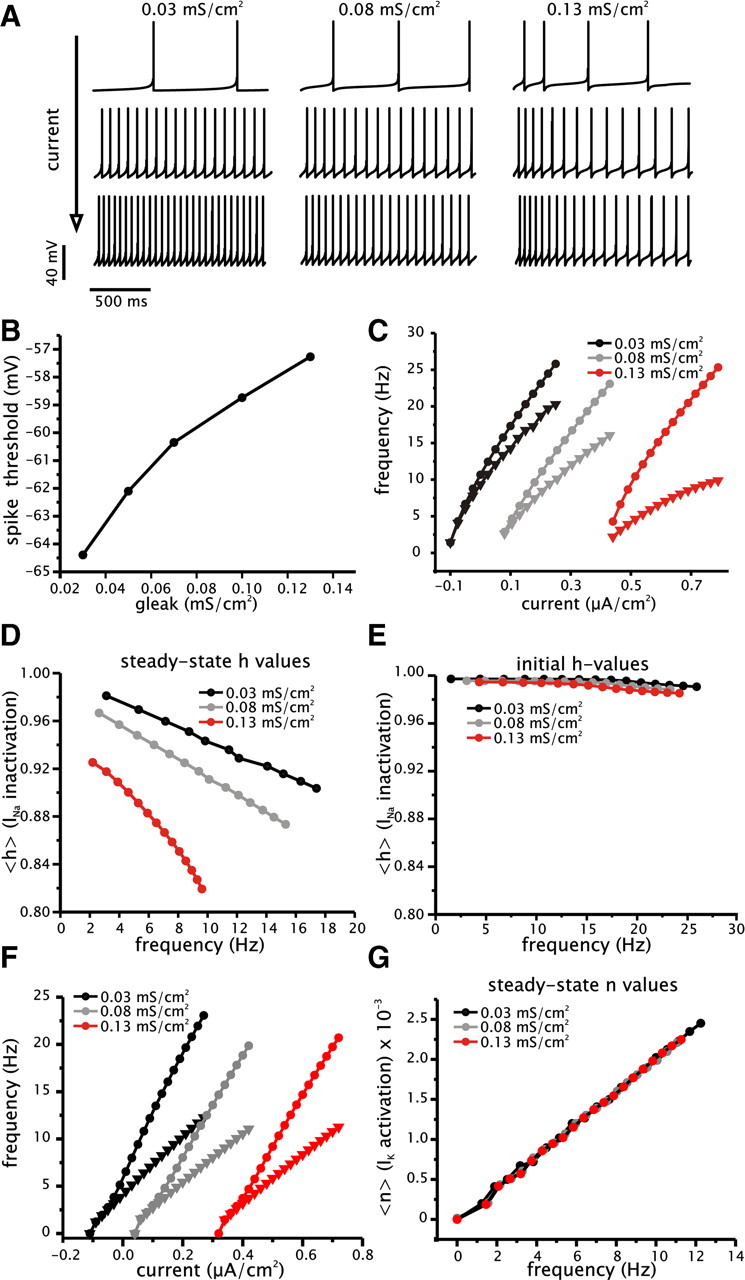
Effects of increased conductance on spike frequency adaptation and steady-state gain can be reproduced in a simple conductance-based model. A, Examples of membrane voltage traces from model under three different levels of leak conductance (0.03, 0.08, and 0.13 mS/cm2) generated with increasing levels of driving current. B, Plot of spike voltage threshold as a function of leak conductance (gleak). Spike threshold was determined using a bifurcation analysis and defined as the membrane voltage value corresponding to the elimination of the stable fixed point (resting membrane voltage) and formation of a stable limit cycle (spike firing solution). C, Initial (circles) and steady-state (triangles) f–I relationships for model under three different levels of leak conductance (0.03, 0.08, and 0.13 mS/cm2). Note that the steady-state f–I relationships shows a greater degree of saturation than the initial f–I relationships. D, E, Plots of the mean availability of Na+ conductance (h) as a function of steady-state (D) and initial (E) firing frequency. Plots were generated for three different levels of leak conductance (0.03, 0.08, and 0.13 mS/cm2). F, Initial (circles) and steady-state (triangles) f–I relationships for model incorporating spike-dependent adaptation under three different levels of leak conductance (0.03, 0.08, and 0.13 mS/cm2). Note that the steady-state f–I relationships, unlike the previous model, do not show saturation and are a linear function of driving current. G, Plots of the mean availability of the spike-dependent K+ conductance (n) as a function of steady-state firing frequency. Plots were generated for three different levels of leak conductance (0.03, 0.08, and 0.13 mS/cm2).
To determine the amount of Na+ conductance available, we plotted the mean value of h at steady state as a function of the steady-state firing rate for three different levels of leak conductance (Fig. 8D). As with the pyramidal cells, Na+ conductance availability decreases with increased firing rate and increased leak conductance. Conversely, the value of h averaged over the first interspike interval does not change appreciably as a function of initial spike frequency and added leak conductance (Fig. 8E). Steady-state gain values for the model with 0.03, 0.08, and 0.13 mS/cm2 of leak conductance are 52, 38, and 22 Hz·cm2/μA, respectively. Thus, the loss of Na+ conductance at steady state with increased leak conductance results in an increase in the magnitude of spike frequency adaptation and a decrease in the gain of the steady-state f–I relationship. The gain measured from the initial interspike interval, however, remains relatively constant under different levels of leak conductance attributable a lack of cumulative Na+ inactivation early in the spike train (Fig. 8C,E). Like the cell, the model also shows a greater amount of saturation in the steady-state f–I relationship with increased conductance. The maximum sustainable firing frequency decreases with increased membrane conductance. This results from increased inactivation of Na+ current associated with added conductance and depolarization of spiking voltage.
As an alternative, and a form of comparison with the previous model, we constructed a model incorporating a spike-dependent form of spike frequency adaptation. This mechanism is consistent with neurons that express Ca2+-activated K+ currents, which activate primarily during a spike event, but not during the subthreshold voltage trajectory leading to the spike (Prescott and Sejnowski, 2008). Thus, the spike-dependent current will slow firing rate attributable to a spike-dependent accumulation. Because the adaptation process is strictly spike dependent, we hypothesized that changes in membrane voltage, induced by increased conductance, would not increase the activation level of the adaptation variable. As shown in Figure 8F, the steady-state f–I relationship in this model does not change as a function of added conductance despite the fact that increased conductance continues to increase spike voltage threshold. Steady-state gain in this model with 0.03, 0.08, and 0.13 mS/cm2 of leak conductance is 31, 27, and 27 Hz·cm2/μA, respectively. Furthermore, both the initial and steady-state f–I relationships are linear, and thus the magnitude of adaptation does not increase as a function of firing rate or membrane voltage. This occurs because the mean level of the spike-activated variable responsible for adaptation (n) does not increase as a function of added conductance and depolarization of spike threshold (Fig. 8G). As a result, the gain in this model is not reduced by increased membrane conductance. Hence, the decrease in gain with conductance depends critically on the ability for the magnitude of adaptation to increase with depolarization.
In summary, the simulation results show that cumulative inactivation of Na+ conductance is sufficient to lead to the changes in steady-state gain observed experimentally. The reduction in the spike rate of rise and modeling results, along with the inability for IM blockers to appreciably alter spike frequency adaptation, suggest that an increase in Na+ conductance inactivation accompanying the depolarization in spiking voltage is responsible for the decrease in the steady-state gain with increased membrane conductance.
Discussion
In the current study, we demonstrate that the gain of the steady-state f–I relationship can be reduced with an increase in inhibitory conductance at the soma. Notably, the reduction in gain can be implemented without incorporating random membrane voltage fluctuations. Moreover, the change in gain with added conductance is graded and can be implemented with physiological changes in membrane resistance (Kamondi et al., 1998; Destexhe et al., 2003; Cardin et al., 2008).
Requirements for implementation of gain control with somatic changes in conductance
The mechanism of gain control described in this study requires the neuron to express a loss of excitability with increased depolarization of mean spiking voltage. In CA1 pyramidal cells, the loss of excitability with depolarization manifests in the form of spike frequency adaptation. Specifically, the magnitude of spike frequency adaptation increases with depolarization and added conductance. Although spike frequency adaptation has been observed experimentally in numerous neuron types, its magnitude as a function of depolarization has not been characterized. It is difficult to predict whether the specific properties of spike frequency adaptation observed in CA1 pyramidal cells are present in other neurons. Our modeling results suggest that this form of adaptation is more likely to arise under conditions in which the slowing of the firing rate is mediated by a voltage-dependent, as opposed to a spike-dependent, process.
An additional requirement in our mechanism is that increased membrane conductance results in a depolarization of spike voltage threshold. Outside of the experimental evidence for this effect provided here and in other studies (Prescott et al., 2006; Fernandez and White, 2008), simple nonlinear models of spike generation predict it to be a general property of the threshold phenomenon in neurons (Prescott et al., 2006, 2008; Prescott and Sejnowski, 2008). Furthermore, dynamically distinct spike generating mechanisms generate a depolarizing shift in threshold with added conductance (Prescott et al., 2006, 2008; Prescott and Sejnowski, 2008). In biophysical terms, increased conductance shunts the Na+ current in the same manner that leak can shunt an external direct current input. As a result, to activate sufficient Na+ conductance to sustain the positive feedback associated with spike initiation requires increased depolarization. For these reasons, the ability of added conductance to depolarize the spiking voltage of neurons should be ubiquitous and independent of spike frequency adaptation or gain.
Changes in gain also required measuring spike rate from the steady-state firing frequency. Conductance-induced reductions in gain evolved in time and were clearly evident (but not maximal) at 250 ms (Fig. 1C). Other proposed mechanisms of gain control also take significant time to appear. For example, methods of gain control that involve synaptic depression require time for depression to occur (Rothman et al., 2009). Even in methods that use membrane voltage fluctuations to control gain, the resulting spike times are highly variable and must be averaged over a time window to observe the change in gain at the single-neuron level (Doiron et al., 2001; Chance et al., 2002; Mitchell and Silver, 2003; Prescott and De Koninck, 2003).
A potential weakness in our mechanism is that steady-state firing rates might not be expressed under in vivo conditions. This critique assumes that in vivo activity is characterized by periods of hyperpolarization and quiescence interspersed with depolarization that leads to brief epochs of firing that limit the expression of a steady-state firing rate. An alternative is that neurons in vivo exhibit sustained firing that is modulated by inputs. Under these conditions, the neuron could spend a large portion of its time at a pseudo-steady state with firing rate modulated by modest membrane fluctuations that are insufficient to fully reset the firing mechanism and spike frequency adaptation, as we saw for responses to pseudorandom stimuli in Figure 2. Although examples of in vivo intracellular membrane voltage recordings from CA1 pyramidal cells are limited, one study suggests that these cells sustain periods of low-frequency firing with an absence of extended periods of strong hyperpolarization that can fully reset the firing mechanism (Isomura et al., 2006). Even in cells that exhibit pronounced up and down states, the up states last long enough to allow spike-rate adaptation (Haider et al., 2006).
Comparison with previous results on gain control
Contrary to the results presented here, previous in vitro work has indicated that conductance added at the soma via dynamic clamp and introduced without a concurrent stochastic component results in a pure subtractive change in the f–I relationship, with no significant effect on the slope (Chance et al., 2002; Mitchell and Silver, 2003; Ulrich, 2003; Brizzi et al., 2004). These data have come from pyramidal cells of the somatosensory cortex, cerebellar granule cells, and spinal motoneurons. The inability for conductance to reduce gain in these cells could be a result of a relative weak expression of spike frequency adaptation or the expression of a different form of adaptation (e.g., spike-dependent mechanism).
In contrast, results from in vivo recordings from rat cortex indicate that an inhibitory conductance implemented with dynamic clamp without noise can divisively scale the output of principle neurons showing spike frequency adaptation (Graham and Schramm, 2009). This is further supported by in vivo recordings of cat cortical neurons showing that, under noisy conditions, the gain of the neuron changes only when the membrane resistance decreases (Cardin et al., 2008). Gain control in vivo could be independent of synaptic noise and incorporate principles outlined in the current study.
A recent experimental study has indicated that divisive gain control can be implemented in cerebellar granule cells using a combination of constant inhibitory conductance coupled with excitation through synapses expressing short-term depression (Rothman et al., 2009). This confirms previous modeling results implementing gain control with depressing synapses (Abbott et al., 1997). The effect comes about through the frequency-dependent loss of excitatory drive conferred by short-term depression. Similar to the loss of excitability provided by an increased spiking voltage and spike frequency adaptation, short-term depression produces a loss of excitability that increases with increased inhibition. This mechanism differs from ours, however, by producing a reduction in gain through a decrease in the driving input rather than a change in intrinsic membrane dynamics with increased conductance. Gain control using short-term depression can be implemented with either current- or conductance-based inhibition (Rothman et al., 2009).
Mechanism of spike frequency adaptation in CA1 pyramidal cells
Biophysical studies of CA1 pyramidal cells using transgenic mice and/or pharmacology have emphasized a role for IM in spike frequency adaptation (Madison and Nicoll, 1984; Aiken et al., 1995; Peters et al., 2005; Otto et al., 2006). The reduction of IM using Kv7 knock-out mice, linopirdine, or XE991 indicates that IM contributes significantly to the overall excitability of CA1 pyramidal cells (Aiken et al., 1995; Yue and Yaari, 2004; Gu et al., 2005; Peters et al., 2005; Otto et al., 2006). The specific role of IM in spike frequency adaptation is less well established. Differing from the results shown in our study, previous experimental data has indicated that IM plays a role in spike frequency adaptation (Aiken et al., 1995; Gu et al., 2005; Peters et al., 2005; Otto et al., 2006). In most studies, however, the initial, steady-state, or mean firing frequency were not controlled after a reduction of IM. This suggests that the attributed role for IM in spike frequency adaptation can be mediated indirectly through changes in resting membrane voltage and/or membrane input resistance. In support, block of IM has been shown to significantly increase membrane input resistance (Gu et al., 2005). Some of these studies have also limited their analysis of spike frequency adaptation to the first 50 ms of activity (Gu et al., 2005). Moreover, a large fraction (>50%) of the adaptation magnitude remained after the elimination of IM (Aiken et al., 1995; Gu et al., 2005; Peters et al., 2005; Otto et al., 2006).
Similarly, blocking Ca2+-activated K+ currents leaves a large fraction of spike frequency adaptation unaffected (Madison and Nicoll, 1984). Furthermore, the effects of blocking Ca2+-activated K+ currents on spike frequency adaptation have only been realized during spike frequency rates significantly higher (∼150 Hz) than those used in the current study (Madison and Nicoll, 1984; Gu et al., 2007).
Our data indicate an important role for cumulative Na+ inactivation in establishing the adaptation process at low firing frequencies. In the current study, spike frequency adaptation was always associated with a decrease in the spike rate of rise. Consistent with a role of Na+ inactivation in adaptation, previous work has reliably shown a drop in spike height amplitude during the adaptation process in CA1 pyramidal cells (Aiken et al., 1995; Peters et al., 2005; Otto et al., 2006). Moreover, the ability for Na+ channels in CA1 pyramidal cells to undergo slow and cumulative inactivation is well documented (Colbert et al., 1997; Jung et al., 1997; Mickus et al., 1999). Finally, the amount of cumulative Na+ conductance inactivation increases with modest depolarization from rest (Mickus et al., 1999), which are within the range of voltage values that have been recorded in vivo during spike activity (Isomura et al., 2006).
Footnotes
This work was supported with grants from the Canadian Institutes of Health Research (F.R.F.) and the National Institutes of Health (J.A.W.). We thank members of the White Laboratory for useful discussions and comments on this manuscript.
References
- Abbott LF, Varela JA, Sen K, Nelson SB. Synaptic depression and cortical gain control. Science. 1997;275:220–224. doi: 10.1126/science.275.5297.221. [DOI] [PubMed] [Google Scholar]
- Aiken SP, Lampe BJ, Murphy PA, Brown BS. Reduction of spike frequency adaptation and blockade of M-current in rat CA1 pyramidal neurones by linopirdine (DuP 996), a neurotransmitter release enhancer. Br J Pharmacol. 1995;115:1163–1168. doi: 10.1111/j.1476-5381.1995.tb15019.x. [DOI] [PMC free article] [PubMed] [Google Scholar]
- Anderson JS, Lampl I, Gillespie DC, Ferster D. The contribution of noise to contrast invariance of orientation tuning in cat visual cortex. Science. 2000;290:1968–1972. doi: 10.1126/science.290.5498.1968. [DOI] [PubMed] [Google Scholar]
- Atallah BV, Scanziani M. Instantaneous modulation of gamma oscillation frequency by balancing excitation with inhibition. Neuron. 2009;62:566–577. doi: 10.1016/j.neuron.2009.04.027. [DOI] [PMC free article] [PubMed] [Google Scholar]
- Benda J, Herz AV. A universal model for spike-frequency adaptation. Neural Comput. 2003;15:2523–2564. doi: 10.1162/089976603322385063. [DOI] [PubMed] [Google Scholar]
- Bettencourt JC, Lillis KP, Stupin LR, White JA. Effects of imperfect dynamic clamp: computational and experimental results. J Neurosci Methods. 2008;169:282–289. doi: 10.1016/j.jneumeth.2007.10.009. [DOI] [PMC free article] [PubMed] [Google Scholar]
- Brizzi L, Meunier C, Zytnicki D, Donnet M, Hansel D, D'Incamps BL, Van Vreeswijk C. How shunting inhibition affects the discharge of lumbar motoneurones: a dynamic clamp study in anaesthetized cats. J Physiol. 2004;558:671–683. doi: 10.1113/jphysiol.2003.059964. [DOI] [PMC free article] [PubMed] [Google Scholar]
- Cardin JA, Palmer LA, Contreras D. Cellular mechanisms underlying stimulus-dependent gain modulation in primary visual cortex neurons in vivo. Neuron. 2008;59:150–160. doi: 10.1016/j.neuron.2008.05.002. [DOI] [PMC free article] [PubMed] [Google Scholar]
- Chance FS, Abbott LF, Reyes AD. Gain modulation from background synaptic input. Neuron. 2002;35:773–782. doi: 10.1016/s0896-6273(02)00820-6. [DOI] [PubMed] [Google Scholar]
- Colbert CM, Magee JC, Hoffman DA, Johnston D. Slow recovery from inactivation of Na+ channels underlies the activity-dependent attenuation of dendritic action potentials in hippocampal CA1 pyramidal neurons. J Neurosci. 1997;17:6512–6521. doi: 10.1523/JNEUROSCI.17-17-06512.1997. [DOI] [PMC free article] [PubMed] [Google Scholar]
- Destexhe A, Rudolph M, Fellous JM, Sejnowski TJ. Fluctuating synaptic conductances recreate in vivo-like activity in neocortical neurons. Neuroscience. 2001;107:13–24. doi: 10.1016/s0306-4522(01)00344-x. [DOI] [PMC free article] [PubMed] [Google Scholar]
- Destexhe A, Rudolph M, Paré D. The high-conductance state of neocortical neurons in vivo. Nat Rev Neurosci. 2003;4:739–751. doi: 10.1038/nrn1198. [DOI] [PubMed] [Google Scholar]
- Doiron B, Longtin A, Berman N, Maler L. Subtractive and divisive inhibition: effect of voltage-dependent inhibitory conductances and noise. Neural Comput. 2001;13:227–248. doi: 10.1162/089976601300014691. [DOI] [PubMed] [Google Scholar]
- Dorval AD, Christini DJ, White JA. Real-Time linux dynamic clamp: a fast and flexible way to construct virtual ion channels in living cells. Ann Biomed Eng. 2001;29:897–907. doi: 10.1114/1.1408929. [DOI] [PubMed] [Google Scholar]
- Ermentrout B. Linearization of F–I curves by adaptation. Neural Comput. 1998;10:1721–1729. doi: 10.1162/089976698300017106. [DOI] [PubMed] [Google Scholar]
- Ermentrout B. Philadelphia: Society for Industrial and Applied Mathematics; 2002. Simulating, analyzing, and animating dynamical systems: a guide to XPPAUT for researchers and students. [Google Scholar]
- Fellous JM, Rudolph M, Destexhe A, Sejnowski TJ. Synaptic background noise controls the input/output characteristics of single cells in an in vitro model of in vivo activity. Neuroscience. 2003;122:811–829. doi: 10.1016/j.neuroscience.2003.08.027. [DOI] [PMC free article] [PubMed] [Google Scholar]
- Fernandez FR, White JA. Artificial synaptic conductances reduce subthreshold oscillations and periodic firing in stellate cells of the entorhinal cortex. J Neurosci. 2008;28:3790–3803. doi: 10.1523/JNEUROSCI.5658-07.2008. [DOI] [PMC free article] [PubMed] [Google Scholar]
- Fernandez FR, White JA. Reduction of spike afterdepolarization by increased leak conductance alters interspike interval variability. J Neurosci. 2009;29:973–986. doi: 10.1523/JNEUROSCI.4195-08.2009. [DOI] [PMC free article] [PubMed] [Google Scholar]
- Fleidervish IA, Friedman A, Gutnick MJ. Slow inactivation of Na+ current and slow cumulative spike adaptation in mouse and guinea-pig neocortical neurones in slices. J Physiol. 1996;493:83–97. doi: 10.1113/jphysiol.1996.sp021366. [DOI] [PMC free article] [PubMed] [Google Scholar]
- Freund TF, Buzsáki G. Interneurons of the hippocampus. Hippocampus. 1996;6:347–470. doi: 10.1002/(SICI)1098-1063(1996)6:4<347::AID-HIPO1>3.0.CO;2-I. [DOI] [PubMed] [Google Scholar]
- Gabbiani F, Midtgaard J, Knöpfel T. Synaptic integration in a model of cerebellar granule cells. J Neurophysiol. 1994;72:999–1009. doi: 10.1152/jn.1994.72.2.999. [DOI] [PubMed] [Google Scholar]
- Graham LJ, Schramm A. In vivo dynamic-clamp manipulations of extrinsic and intrinsic conductances: functional roles of shunting inhibition and IBK in rat and cat cortex. In: Destexhe A, Bal T, editors. Dynamic-clamp: from principles to applications. New York: Springer; 2009. pp. 141–163. [Google Scholar]
- Gu N, Vervaeke K, Hu H, Storm JF. Kv7/KCNQ/M and HCN/h, but not KCa2/SK channels, contribute to the somatic medium after-hyperpolarization and excitability control in CA1 hippocampal pyramidal cells. J Physiol. 2005;566:689–715. doi: 10.1113/jphysiol.2005.086835. [DOI] [PMC free article] [PubMed] [Google Scholar]
- Gu N, Vervaeke K, Storm JF. BK potassium channels facilitate high-frequency firing and cause early spike frequency adaptation in rat CA1 hippocampal pyramidal cells. J Physiol. 2007;580:859–882. doi: 10.1113/jphysiol.2006.126367. [DOI] [PMC free article] [PubMed] [Google Scholar]
- Haider B, Duque A, Hasenstaub AR, McCormick DA. Neocortical network activity in vivo is generated through a dynamic balance of excitation and inhibition. J Neurosci. 2006;26:4535–4545. doi: 10.1523/JNEUROSCI.5297-05.2006. [DOI] [PMC free article] [PubMed] [Google Scholar]
- Higgs MH, Slee SJ, Spain WJ. Diversity of gain modulation by noise in neocortical neurons: regulation by the slow afterhyperpolarization conductance. J Neurosci. 2006;26:8787–8799. doi: 10.1523/JNEUROSCI.1792-06.2006. [DOI] [PMC free article] [PubMed] [Google Scholar]
- Holt GR, Koch C. Shunting inhibition does not have a divisive effect on firing rates. Neural Comput. 1997;9:1001–1013. doi: 10.1162/neco.1997.9.5.1001. [DOI] [PubMed] [Google Scholar]
- Isomura Y, Sirota A, Ozen S, Montgomery S, Mizuseki K, Henze DA, Buzsáki G. Integration and segregation of activity in entorhinal-hippocampal subregions by neocortical slow oscillations. Neuron. 2006;52:871–882. doi: 10.1016/j.neuron.2006.10.023. [DOI] [PubMed] [Google Scholar]
- Jung HY, Mickus T, Spruston N. Prolonged sodium channel inactivation contributes to dendritic action potential attenuation in hippocampal pyramidal neurons. J Neurosci. 1997;17:6639–6646. doi: 10.1523/JNEUROSCI.17-17-06639.1997. [DOI] [PMC free article] [PubMed] [Google Scholar]
- Kamondi A, Acsády L, Wang XJ, Buzsáki G. Theta oscillations in somata and dendrites of hippocampal pyramidal cells in vivo: activity-dependent phase-precession of action potentials. Hippocampus. 1998;8:244–261. doi: 10.1002/(SICI)1098-1063(1998)8:3<244::AID-HIPO7>3.0.CO;2-J. [DOI] [PubMed] [Google Scholar]
- Longtin A. Effect of noise on the tuning properties of excitable systems. Chaos Solitons Fractals. 2000;11:1835–1848. [Google Scholar]
- Madison DV, Nicoll RA. Control of the repetitive discharge of rat CA 1 pyramidal neurones in vitro. J Physiol. 1984;354:319–331. doi: 10.1113/jphysiol.1984.sp015378. [DOI] [PMC free article] [PubMed] [Google Scholar]
- Megías M, Emri Z, Freund TF, Gulyás AI. Total number and distribution of inhibitory and excitatory synapses on hippocampal CA1 pyramidal cells. Neuroscience. 2001;102:527–540. doi: 10.1016/s0306-4522(00)00496-6. [DOI] [PubMed] [Google Scholar]
- Mehaffey WH, Doiron B, Maler L, Turner RW. Deterministic multiplicative gain control with active dendrites. J Neurosci. 2005;25:9968–9977. doi: 10.1523/JNEUROSCI.2682-05.2005. [DOI] [PMC free article] [PubMed] [Google Scholar]
- Melnick IV, Santos SF, Safronov BV. Mechanism of spike frequency adaptation in substantia gelatinosa neurones of rat. J Physiol. 2004;559:383–395. doi: 10.1113/jphysiol.2004.066415. [DOI] [PMC free article] [PubMed] [Google Scholar]
- Mickus T, Jung H, Spruston N. Properties of slow, cumulative sodium channel inactivation in rat hippocampal CA1 pyramidal neurons. Biophys J. 1999;76:846–860. doi: 10.1016/S0006-3495(99)77248-6. [DOI] [PMC free article] [PubMed] [Google Scholar]
- Mitchell SJ, Silver RA. Shunting inhibition modulates neuronal gain during synaptic excitation. Neuron. 2003;38:433–445. doi: 10.1016/s0896-6273(03)00200-9. [DOI] [PubMed] [Google Scholar]
- Otto JF, Yang Y, Frankel WN, White HS, Wilcox KS. A spontaneous mutation involving Kcnq2 (Kv7.2) reduces M-current density and spike frequency adaptation in mouse CA1 neurons. J Neurosci. 2006;26:2053–2059. doi: 10.1523/JNEUROSCI.1575-05.2006. [DOI] [PMC free article] [PubMed] [Google Scholar]
- Peters HC, Hu H, Pongs O, Storm JF, Isbrandt D. Conditional transgenic suppression of M channels in mouse brain reveals functions in neuronal excitability, resonance and behavior. Nat Neurosci. 2005;8:51–60. doi: 10.1038/nn1375. [DOI] [PubMed] [Google Scholar]
- Prescott SA, De Koninck Y. Gain control of firing rate by shunting inhibition: roles of synaptic noise and dendritic saturation. Proc Natl Acad Sci U S A. 2003;100:2076–2081. doi: 10.1073/pnas.0337591100. [DOI] [PMC free article] [PubMed] [Google Scholar]
- Prescott SA, Sejnowski TJ. Spike-rate coding and spike-time coding are affected oppositely by different adaptation mechanisms. J Neurosci. 2008;28:13649–13661. doi: 10.1523/JNEUROSCI.1792-08.2008. [DOI] [PMC free article] [PubMed] [Google Scholar]
- Prescott SA, Ratté S, De Koninck Y, Sejnowski TJ. Nonlinear interaction between shunting and adaptation controls a switch between integration and coincidence detection in pyramidal neurons. J Neurosci. 2006;26:9084–9097. doi: 10.1523/JNEUROSCI.1388-06.2006. [DOI] [PMC free article] [PubMed] [Google Scholar]
- Prescott SA, Ratté S, De Koninck Y, Sejnowski TJ. Pyramidal neurons switch from integrators in vitro to resonators under in vivo-like conditions. J Neurophysiol. 2008;100:3030–3042. doi: 10.1152/jn.90634.2008. [DOI] [PMC free article] [PubMed] [Google Scholar]
- Rothman JS, Cathala L, Steuber V, Silver RA. Synaptic depression enables neuronal gain control. Nature. 2009;457:1015–1018. doi: 10.1038/nature07604. [DOI] [PMC free article] [PubMed] [Google Scholar]
- Salinas E, Sejnowski TJ. Gain modulation in the central nervous system: where behavior, neurophysiology, and computation meet. Neuroscientist. 2001;7:430–440. doi: 10.1177/107385840100700512. [DOI] [PMC free article] [PubMed] [Google Scholar]
- Salinas E, Thier P. Gain modulation: a major computational principle of the central nervous system. Neuron. 2000;27:15–21. doi: 10.1016/s0896-6273(00)00004-0. [DOI] [PubMed] [Google Scholar]
- Shu Y, Hasenstaub A, Badoual M, Bal T, McCormick DA. Barrages of synaptic activity control the gain and sensitivity of cortical neurons. J Neurosci. 2003;23:10388–10401. doi: 10.1523/JNEUROSCI.23-32-10388.2003. [DOI] [PMC free article] [PubMed] [Google Scholar]
- Softky WR, Koch C. The highly irregular firing of cortical cells is inconsistent with temporal integration of random EPSPs. J Neurosci. 1993;13:334–350. doi: 10.1523/JNEUROSCI.13-01-00334.1993. [DOI] [PMC free article] [PubMed] [Google Scholar]
- Spain WJ. Serotonin has different effects on two classes of Betz cells from the cat. J Neurophysiol. 1994;72:1925–1937. doi: 10.1152/jn.1994.72.4.1925. [DOI] [PubMed] [Google Scholar]
- Ulrich D. Differential arithmetic of shunting inhibition for voltage and spike rate in neocortical pyramidal cells. Eur J Neurosci. 2003;18:2159–2165. doi: 10.1046/j.1460-9568.2003.02942.x. [DOI] [PubMed] [Google Scholar]
- Wang HS, Pan Z, Shi W, Brown BS, Wymore RS, Cohen IS, Dixon JE, McKinnon D. KCNQ2 and KCNQ3 potassium channel subunits: molecular correlates of the M-channel. Science. 1998;282:1890–1893. doi: 10.1126/science.282.5395.1890. [DOI] [PubMed] [Google Scholar]
- Yue C, Yaari Y. KCNQ/M channels control spike afterdepolarization and burst generation in hippocampal neurons. J Neurosci. 2004;24:4614–4624. doi: 10.1523/JNEUROSCI.0765-04.2004. [DOI] [PMC free article] [PubMed] [Google Scholar]