

Microscale chemical separation plays a prominent role in biotechnology and chemical analysis. In microscale separation, much effort is spent to separate individual analyte species of a complex mixture into distinct bands. After the detection of each band, however, the separated components often cannot be easily preserved for additional analysis or manipulation owing to molecular diffusion. This challenge is especially acute in high-resolution separation techniques, such as in capillary electrophoresis (CE) and microscale high-performance liquid chromatography (micro-HPLC), because of the extremely small volumes and narrow bands involved. This paper describes a new concept based on the use of droplets to compartmentalize the separated bands, thus preventing the dilution and loss of the separated components and facilitating their downstream manipulation and analysis.
In high-resolution microscale separation such as CE, sample volumes are often in the nanoliter[1, 2] or even femtoliter range[3-5], where the number of theoretical plates often range up to the millions[6]. In such systems, it has been extremely difficult to maintain the contents of the separated peaks after their detection. Experimental advances, however, have been made to address this issue[6-9]. Zare and co-workers, for example, employed elastomeric valving and sub-nanoliter chambers to capture separated bands for single-molecule studies[7, 8], while Zaleweski et al. used electrokinetic flow switching to collect separated CE fractions[9]. By integrating electroosmotic flow (EOF) induced droplet generation with chemical separation, we describe the use of droplets to spatially confine the components separated by CE. Although this paper focuses on CE separation, we believe this concept can be applied broadly to other high-resolution techniques in microscale chemical separation.
Droplets have emerged in the past few years as a platform for a wide range of applications; some use monodisperse droplets generated using microfluidics[10-13] and others use emulsion systems[14, 15]. Fig. 1a schematically illustrates the concept of spatially confining the separated bands into droplets. Fig. 1b shows the particular fluidic design we used to compartmentalize CE-separated bands (see supporting material for experimental details). This chip consisted of three regions: (1) a sample injection region, (2) a CE separation channel, and (3) a droplet formation region. The cross section of the sample-injection channel was 3 × 3μm and the CE channel was 10 × 10μm. The droplet formation region was comprised of two oil channels (50 × 50μm) that flanked the CE channel and an exit channel that was 50μm tall by 100μm wide (Fig. 1c). EOF in the CE channel was initiated by applying a high voltage to the platinum (Pt) electrode and by grounding the indium tin oxide (ITO) electrode on the floor of the microchannel. In the absence of applied voltage, the aqueous-oil interface was balanced and no droplet formation occurred.
Figure 1.

Droplet compartmentalization of capillary electrophoresis (CE) separation. (a) Schematic depicting the general methodology for compartmentalizing the separated bands in droplets. (b) Schematic showing the fluidic design we used to integrate CE with droplet compartmentalization. The locations of the confocal detection spots are depicted as three blue laser foci. (c) Image showing details of the droplet formation region. Oil channels: 50 × 50μm; exit channel: 50 × 100μm; CE channel (sample): 10 × 10μm. (d) An electropherogram recorded before the indium tin oxide (ITO) electrode (separation buffer: 20 mM borate at pH 9; applied field: 350 V/cm). Here, the D and L glutamate could not be separated in free-solution. As a result, droplets that compartmentalized the D/L glutamate peak were removed from the chip at the exit reservoir, then injected into a fused silica capillary (10μm i.d.) for separation by micellar-electrokinetic chromatography (separation buffer: 20 mM borate, 30 mM SDS, and 20 mM β-cyclodextran; applied field: 250 V/cm). (e) An electropherogram recorded after ITO electrode. (f) An electropherogram recorded after droplet generation. FITC: fluorescein isothiocyanate; Phe: FITC-phenylalanine; Gly: FITC-glycine; D/L-Glu: FITC-labeled D and L glutamate. The immiscible phase was AR20 silicone oil.
To characterize the effect of droplet formation on CE separation, we monitored the separated bands at three locations during three separate injections (Fig. 1b) Fig. 1d is the electropherogram recorded at the first detection spot before the ITO electrode, which shows all amino acids were separated by CE except for D and L glutamate. To further resolve the D/L glutamate peak, we transferred the contents of the droplets containing D/L glutamate into a fused silica capillary for a second dimension separation using micellar electrokinetic chromatography (MEKC). The inset in Fig. 1d shows the D and L glutamate peaks after this second-dimension MEKC separation. The L glutamate peak was more intense than the D peak because we intentionally introduced more dye-tagged L glutamate into the sample to allow us to identify the two peaks based on their relative intensities.
Fig. 1e shows the electropherogram recorded at the second detection spot after the ITO electrode. Upon enlargement of one of the peaks (inset), a series of small peaks or oscillations can be seen to be superimposed on the main peak. The frequency of oscillation was identical to the frequency of droplet generation. We will discuss the origin of this oscillation in the next section. Fig. 1f shows the peaks detected by the third detection spot placed after the droplet-generation region. Expansion of the D/L glutamate peak (inset) reveals the presence of many individual peaks; each peak here is a droplet.
Our device employed a modified flow-focusing design, in which droplet generation was driven by EOF (Fig. 1b & 1c). For our EOF-induced droplet generation, we can estimate the maximum absolute pressure (ΔPmax) generated by EOF in our CE channel[16]: ΔPmax = 32ε0εrζUw-2. Here ε0 is the electrical permittivity of vacuum, εr is the relative permittivity of the medium, ζ is the zeta potential of the PDMS channel wall, U is the applied voltage, and w is the width of the channel. Using literature values of 8.85×10⁻¹² C2N-1m-2 for ε0, 80 for εr, and -50 mV for ζ, and using the values of U (1 kV) and w (10 μm) from our experiments, we estimate a ΔPmax of ~ 1.6 psi[16]. This value is consistent with the hydrodynamic pressure needed to produce droplets in the frequency range of kHz in a standard flow-focusing device[17].
To understand our observed frequency oscillations we imaged the droplet-formation process using a fast camera (Fig. 2a-2d). From this series of images, it is evident the aqueous/oil interface always advanced in the CE channel during droplet formation and never retracted beyond its initial position at the start of the droplet-formation cycle (Fig. 2a & 2d). We also noticed the flow rate of the aqueous phase was inhomogeneous. While the flow rate was fast during droplet formation (Fig. 2b), it was slow during the initial advance of the interface within the CE channel (Fig. 2a) and also during necking of the droplet (Fig. 2c). From Fig. 2a-2d, we estimate the average EOF mobility in our CE channel was ~ 5.9 × 10⁻⁴ cm2 / V·s, which is similar to other values reported in the literature for oxidized PDMS channels[4]. When the interface was confined within the CE channel (we term this the bounded interface), we estimate the average EOF mobility to be ~ 2.7 × 10⁻⁴ cm2 / V·s, which is almost three times slower than when the interface entered the large exit oil channel (unbounded interface) during droplet formation (EOF ~ 7.3 × 10⁻⁴ cm2 / V·s). We thus hypothesized that this slow-fast motion of the aqueous phase in the CE channel was responsible for the oscillations: when the flow was slow there was more photobleaching of the dye in the laser probe volume, which led to a lower detected fluorescence, but when the flow was fast, photobleaching was minimized resulting in a larger detected signal.
Figure 2.
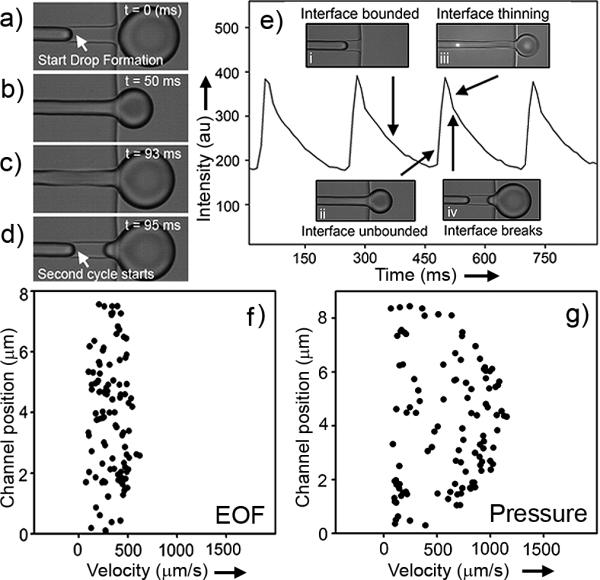
Dynamics of electroosmotic flow (EOF) induced droplet generation. (a-d) is a sequence of images showing EOF induced droplet formation (applied field: 350 V/cm). (e) Simultaneous confocal detection (the bright spot in the upper right inset (panel iii) marks the location of the laser focus) of fluorescence from the separation channel and imaging of droplet formation. Here, the entire separation channel was filled with a homogeneous concentration of fluorescein (1 μM fluorescein in 20 mM borate, pH 9). (f & g) Mapping of the flow profile during droplet formation using particle velocimetry. The flow profiles obtained in (f) and (g) were averaged over 10 cycles of droplet formation. The immiscible oil phase was AR20 silicone oil for all experiments.
To test this hypothesis, we simultaneously detected the fluorescence signal from the CE channel and imaged the droplet-formation process (Fig. 2e). Here, we parked the laser spot for fluorescence detection just upstream of droplet formation; the bright spot in the upper-right inset (panel iii) is the laser focus. In this experiment, the entire CE channel was filled with fluorescein. Under uniform EOF, we saw a constant fluorescence signal. In the presence of variable flow rate and photobleaching, however, the detected fluorescence changed. Fig. 2e correlates this change in detected fluorescence signal with the different stages of droplet formation. When the interface was bounded in the CE channel (inset panel i), the flow rate was slow and thus the detected signal was low due to photobleaching. The detected fluorescence rapidly increased as the interface became unbounded and as the droplet grew in size (inset panel ii). During necking (inset panel iii) and droplet break-off (inset panel iv) as marked by the inflection point in the detected signal, flow again slowed resulting in a decrease in the recorded fluorescence. This cycle repeats itself with the formation of each droplet; Fig. 2e shows the signal trace from 4 cycles of droplet generation.
The change in flow velocity between the two regimes (bounded versus unbounded interface) was caused by a decrease in pressure at the interface as the droplet was formed, as governed by the Young-Laplace equation[18]: ΔPlap = 4γ / d. Here ΔPlap is the Laplace pressure, γ is the interfacial tension, and d is the diameter of the droplet. As the droplet formed, the increase in diameter caused a continual decrease in pressure at the interface[18], which led to an increase in flow rate, eventually resulting in necking and finally droplet break-off.
Because the growing droplet is entrained by the flowing immiscible oil phase, we were concerned the plug flow profile of EOF would be perturbed within the CE channel. Therefore, we used particle velocimetry to map the flow profile in our CE channel during EOF-driven droplet formation. Fig. 2f shows our result, clearly indicating the plug flow in the CE channel was unaffected by droplet generation. As a control, we also applied hydrodynamic pressure to the CE channel, which resulted in a parabolic flow profile as anticipated (Fig. 2g). Therefore, we conclude droplet formation does not affect the plug flow profile of CE. Although the EOF velocity is not homogeneous during droplet formation, the electrophoresis component of CE is homogeneous and constant. As a result, the separation efficiency of CE is not affected by the presence of downstream droplet generation.
The frequency and size of the droplets formed depended both on the strength of the applied electric field and the flow rate of the continuous immiscible phase (Fig. 3a & b). At a given continuous-phase flow rate, higher voltages increased the EOF rate and thus increased both the rate and volume at which the droplets were generated. For a given applied field strength and thus EOF rate, increasing the continuous-phase flow rate increased the frequency of droplet generation but decreased the volume of the droplet formed. This behaviour is expected because at a given EOF rate, the volume of each droplet must decrease to support the higher frequency of droplet formation. Besides applied voltage and continuous-phase flow rate, we noticed droplet formation could be tuned over a wide range using different immiscible fluids. For example, under identical operating conditions, the frequency and volume at which droplets were formed were 10 Hz and 0.3 nL in AR20 silicone oil (Fig. 3c), but changed to 0.3 Hz and 1 nL when FC40 Fluorinert was used (Fig. 3d). Therefore, the size and frequency of droplet formation can be adjusted such that a separated peak is confined in one droplet or in many droplets.
Figure 3.

Tuning the frequency and size of droplet formation. (a & b) Plots showing the dependence of the frequency of droplet generation (a) and droplet volume (b) on the applied field strength and flow rate of the immiscible oil phase. The aqueous phase was 20 mM borate buffer (pH 9) and the immiscible phase was AR20. (c & d) EOF-induced droplet formation in AR 20 silicone oil (c) and in FC40 Fluorinert (d). The aqueous phase in both c and d was 20 mM borate buffer (pH 9), and the applied field strength was ~350 V/cm and the oil flow rate was 1.0 μL/min in both experiments.
Depending on the particular application, the droplet-confined peaks might need to be further analyzed on-chip or removed off-chip for additional separation (Fig. 1d) or assay. For further on-chip analysis, the droplets would need to be docked and stored in a spatially defined manner after chemical separation. Fig. 4a shows one scheme, in which the droplets were sequentially trapped in a series of docking sites along a serpentine channel after CE. Fig. 4b outlines the operation of the serpentine droplet-docking channel[19, 20]; here, the order by which the droplets left the CE channel is encoded in their docking positions, with the first droplet leaving the CE channel being docked first. Fig. 4c shows a series of droplets docked in this manner. To illustrate the use of droplet-docking for trapping a desired band in the CE channel, we used a cylindrically focused UV laser pulse (3ns at 355nm) to uncage a sharp band (~2μm wide) of caged fluorescein, similar to established procedures used in optically gated injection [21]. This band was then transported down the CE channel by EOF, encapsulated in a droplet, then docked in the serpentine channel (Fig. 4d-4f).
Figure 4.

Droplet docking. (a) Schematic showing the chip design used to integrate capillary electrophoresis (CE) separation with droplet compartmentalization and docking. (b) Fluidic circuit diagram used for droplet docking. The small constriction that prevented the docked droplet from passing through was 15μm long × 10μm wide × 10μm tall, while the rest of the channel was 75μm wide × 50μm tall. (c) An image showing docked droplets after they were generated by electroosmotic flow at the junction of the CE and oil channels. (d) Schematic depicting the UV uncaging of caged fluorescein in the CE channel to create a narrow band of fluorescein. (e & f) Bright field (e) and fluorescence (f) image showing the uncaged band of fluorescein was captured in a droplet and docked in the array.
High-resolution and high-sensitivity techniques in microscale chemical separation, such as CE and micro-HPLC, are playing an increasingly important role in biotechnology and cellular analysis. The concept presented in this paper offers an approach to overcome molecular diffusion by confining the separated bands in a series of droplets, which can be further manipulated and studied on-chip or removed off-chip for analysis. We anticipate this approach to open new possibilities in the analysis of the complex cellular components separated by CE and other high-resolution chromatographic techniques.
Supplementary Material
Acknowledgments
We gratefully acknowledge support of this work by the National Institutes of Health. (EB005197)
References
- 1.Olson DL, Peck TL, Webb AG, Magin RL, Sweedler JV. Science. 1995;270:1967. [Google Scholar]
- 2.Monnig CA, Kennedy RT. Anal. Chem. 1994;66:R280. doi: 10.1021/ac00084a013. [DOI] [PubMed] [Google Scholar]
- 3.Schiro PG, Kuyper CL, Chiu DT. Electrophoresis. 2007;28:2430. doi: 10.1002/elps.200600730. [DOI] [PubMed] [Google Scholar]
- 4.Edgar JS, Pabbati CP, Lorenz RM, He MY, Fiorini GS, Chiu DT. Anal. Chem. 2006;78:6948. doi: 10.1021/ac0613131. [DOI] [PMC free article] [PubMed] [Google Scholar]
- 5.Roman GT, Wang M, Shultz KN, Jennings C, Kennedy RT. Anal. Chem. 2008;80:8231. doi: 10.1021/ac801317t. [DOI] [PMC free article] [PubMed] [Google Scholar]
- 6.Kraly J, Fazal MA, Schoenherr RM, Bonn R, Harwood MM, Turner E, Jones M, Dovichi NJ. Anal. Chem. 2006;78:4097. doi: 10.1021/ac060704c. [DOI] [PubMed] [Google Scholar]
- 7.Kim S, Huang B, Zare RN. Lab Chip. 2007;7:1663. doi: 10.1039/b713103h. [DOI] [PubMed] [Google Scholar]
- 8.Huang B, Wu HK, Bhaya D, Grossman A, Granier S, Kobilka BK, Zare RN. Science. 2007;315:81. doi: 10.1126/science.1133992. [DOI] [PubMed] [Google Scholar]
- 9.Zalewski DR, Schlautmann S, Schasfoort RBM, Gardeniers H. Lab Chip. 2008;8:801. doi: 10.1039/b717785b. [DOI] [PubMed] [Google Scholar]
- 10.Song H, Chen DL, Ismagilov RF. Angew. Chem. Int. Edit. 2006;45:7336. doi: 10.1002/anie.200601554. [DOI] [PMC free article] [PubMed] [Google Scholar]
- 11.Huebner A, Sharma S, Srisa-Art M, Hollfelder F, Edel JB, Demello AJ. Lab Chip. 2008;8:1244. doi: 10.1039/b806405a. [DOI] [PubMed] [Google Scholar]
- 12.Fuerstman MJ, Garstecki P, Whitesides GM. Science. 2007;315:828. doi: 10.1126/science.1134514. [DOI] [PubMed] [Google Scholar]
- 13.Utada AS, Lorenceau E, Link DR, Kaplan PD, Stone HA, Weitz DA. Science. 2005;308:537. doi: 10.1126/science.1109164. [DOI] [PubMed] [Google Scholar]
- 14.Kuo JS, Spicar-Mihalic P, Rodriguez I, Chiu DT. Langmuir. 2003;19:250. [Google Scholar]
- 15.Margulies M, Egholm M, Altman WE, Attiya S, Bader JS, et al. Nature. 2005;437:376. doi: 10.1038/nature03959. [DOI] [PMC free article] [PubMed] [Google Scholar]
- 16.Lazar IM, Karger BL. Anal. Chem. 2002;74:6259. doi: 10.1021/ac0203950. [DOI] [PubMed] [Google Scholar]
- 17.Ward T, Faivre M, Abkarian M, Stone HA. Electrophoresis. 2005;26:3716. doi: 10.1002/elps.200500173. [DOI] [PubMed] [Google Scholar]
- 18.Kobayashi I, Mukataka S, Nakajima M. Langmuir. 2004;20:9868. doi: 10.1021/la0487489. [DOI] [PubMed] [Google Scholar]
- 19.Tan WH, Takeuchi S. Proc Natl Acad Sci USA. 2007;104:1146. doi: 10.1073/pnas.0606625104. [DOI] [PMC free article] [PubMed] [Google Scholar]
- 20.Shi W, Qin J, Ye N, Lin B. Lab Chip. 2008;8:1432. doi: 10.1039/b808753a. [DOI] [PubMed] [Google Scholar]
- 21.Paul PH, Garguilo MG, Rakestraw DJ. Anal. Chem. 1998;70:2459. doi: 10.1021/ac9709662. [DOI] [PubMed] [Google Scholar]
Associated Data
This section collects any data citations, data availability statements, or supplementary materials included in this article.