Abstract
Objective: To determine whether tight control of blood pressure prevents macrovascular and microvascular complications in patients with type 2 diabetes.
Design: Randomised controlled trial comparing tight control of blood pressure aiming at a blood pressure of <150/85 mm Hg (with the use of an angiotensin converting enzyme inhibitor captopril or a β blocker atenolol as main treatment) with less tight control aiming at a blood pressure of <180/105 mm Hg.
Setting: 20 hospital based clinics in England, Scotland, and Northern Ireland.
Subjects: 1148 hypertensive patients with type 2 diabetes (mean age 56, mean blood pressure at entry 160/94 mm Hg); 758 patients were allocated to tight control of blood pressure and 390 patients to less tight control with a median follow up of 8.4 years.
Main outcome measures: Predefined clinical end points, fatal and non-fatal, related to diabetes, deaths related to diabetes, and all cause mortality. Surrogate measures of microvascular disease included urinary albumin excretion and retinal photography.
Results: Mean blood pressure during follow up was significantly reduced in the group assigned tight blood pressure control (144/82 mm Hg) compared with the group assigned to less tight control (154/87 mm Hg) (P<0.0001). Reductions in risk in the group assigned to tight control compared with that assigned to less tight control were 24% in diabetes related end points (95% confidence interval 8% to 38%) (P=0.0046), 32% in deaths related to diabetes (6% to 51%) (P=0.019), 44% in strokes (11% to 65%) (P=0.013), and 37% in microvascular end points (11% to 56%) (P=0.0092), predominantly owing to a reduced risk of retinal photocoagulation. There was a non-significant reduction in all cause mortality. After nine years of follow up the group assigned to tight blood pressure control also had a 34% reduction in risk in the proportion of patients with deterioration of retinopathy by two steps (99% confidence interval 11% to 50%) (P=0.0004) and a 47% reduced risk (7% to 70%) (P=0.004) of deterioration in visual acuity by three lines of the early treatment of diabetic retinopathy study (ETDRS) chart. After nine years of follow up 29% of patients in the group assigned to tight control required three or more treatments to lower blood pressure to achieve target blood pressures.
Conclusion: Tight blood pressure control in patients with hypertension and type 2 diabetes achieves a clinically important reduction in the risk of deaths related to diabetes, complications related to diabetes, progression of diabetic retinopathy, and deterioration in visual acuity.
Key messages
This study showed that tight control of blood pressure based on captopril or atenolol as first agents and aiming for both a systolic blood pressure <150 mm Hg and diastolic pressure <85 mm Hg achieved a mean 144/82 mm Hg compared with 154/87 mm Hg in a control group
29% of patients in the tight control group required three or more hypotensive treatments
Tight control of blood pressure reduced the risk of any non-fatal or fatal diabetic complications and of death related to diabetes; deterioration in visual acuity was also reduced
Reducing blood pressure needs to have high priority in caring for patients with type 2 diabetes
Introduction
Type 2 diabetes and hypertension are commonly associated conditions, both of which carry an increased risk of cardiovascular and renal disease.1–6 The prevalence of hypertension in type 2 diabetes is higher than that in the general population, especially in younger patients.7–9 At the age of 45 around 40% of patients with type 2 diabetes are hypertensive, the proportion increasing to 60% by the age of 75.7–9 Hypertension increases the already high risk of cardiovascular disease associated with type 2 diabetes2,3,6,10 and is also a risk factor for the development of microalbuminuria11,12 and retinopathy.13
In the general population treatment to lower blood pressure reduces the incidence of stroke and myocardial infarction,14,15 particularly in elderly people.16,17 In patients with type 1 diabetes who have microalbuminuria or overt nephropathy strict control of blood pressure reduces urinary albumin excretion and deterioration in renal function.18,19 Lowering blood pressure also decreases albuminuria in type 2 diabetes,20 but whether it also reduces the risk of end stage renal disease or of cardiac disease is not known.
We report results from the hypertension in diabetes study, a multicentre, randomised, controlled trial (embedded within the UK prospective diabetes study) designed to determine whether tight blood pressure control (aiming for a blood pressure of <150/85 mm Hg) reduces morbidity and mortality in hypertensive patients with type 2 diabetes.21
Subjects and methods
We studied hypertensive patients with type 2 diabetes who had been recruited to the UK prospective diabetes study.22,23 General practitioners were asked to refer patients aged 25-65 with newly diagnosed diabetes to 23 participating centres. A total of 5102 were recruited as they met the study’s entry criterion (fasting plasma glucose concentration >6 mmol/l on two mornings), were willing to join, and did not meet the exclusion criteria for the study. Exclusion criteria were ketonuria >3 mmol/l; a history of myocardial infarction in the previous year; current angina or heart failure; more than one major vascular episode; serum creatinine concentration >175 μmol/l; retinopathy requiring laser treatment; malignant hypertension; an uncorrected endocrine abnormality; an occupation which would preclude insulin treatment (such as heavy goods vehicle driver); a severe concurrent illness likely to limit life or require extensive systemic treatment; or inadequate understanding or unwillingness to enter the study.22,23 The patients were treated by diet alone for 3 months.24 Patients who remained hyperglycaemic (fasting plasma glucose 6.1-15.0 mmol/l) without diabetic symptoms were randomly allocated conventional blood glucose control, primarily by diet, or intensive control (aiming for a fasting plasma glucose concentration <6.0 mmol/l) with additional sulphonylurea, insulin, or metformin treatment. Details of the protocol are published.22,23
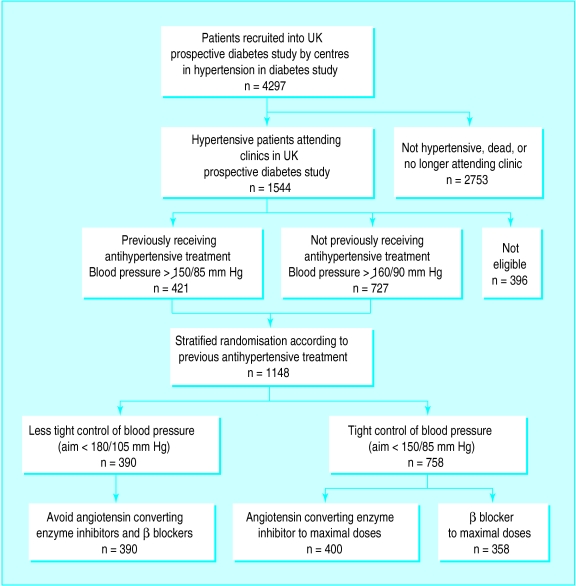
Of the 4297 patients recruited to the 20 centres participating in the hypertension in diabetes study, 243 had either died or were lost to follow up before the start of the hypertension study in 1987 (fig 1). Of the remaining 4054 patients, 1544 (38%) had hypertension, defined in 727 patients as a systolic blood pressure ⩾160 mm Hg and/or a diastolic blood pressure ⩾90 mm Hg or in 421 patients receiving antihypertensive treatment as a systolic pressure of ⩾150 mm Hg and/or a diastolic pressure ⩾85 mm Hg (fig 1). Patients were enrolled on the basis of the mean of three blood pressure measurements taken at consecutive clinic visits. The exclusion criteria were a clinical requirement for strict blood pressure control (previous stroke, accelerated hypertension, cardiac failure, or renal failure) or β blockade (myocardial infarction in the previous year or current angina); severe vascular disease (more than one major vascular episode); a severe concurrent illness or contraindications to β blockers (asthma, intermittent claudication, foot ulcers, or amputations); pregnancy; or unwillingness to join the study. Of the 1544 hypertensive patients, 252 were excluded and 144 patients did not enter the study. A total of 1148 patients (637 men (55%)) with a mean age of 56.4 (SD 8.1) years entered the hypertension in diabetes study between 1987 and 1991.21 Table 1 shows their characteristics at randomisation to blood pressure control policy.
Figure 1.
Selection and random allocation of patients to treatment in hypertension in diabetes study
Table 1.
Characteristics of patients allocated to tight and less tight control of blood pressure. Values are numbers (percentages) of patients unless stated otherwise
| Tight (n=758) | Less tight (n=390) | |
|---|---|---|
| Mean (SD) age (years) | 56.4 (8.1) | 56.5 (8.1) |
| Male sex | 410 (54) | 227 (58) |
| Ethnic group: | ||
| White | 651 (86) | 344 (88) |
| Afro-Caribbean | 62 (8) | 25 (6) |
| Asian Indian | 39 (5) | 17 (4) |
| Other | 6 (1) | 4 (1) |
| Mean (SD) body mass index (kg/m2) | 29.8 (5.5) | 29.3 (5.5) |
| Median (interquartile range) fasting plasma glucose (mmol/l) | 7.4 (6.1 to 9.2) | 7.4 (6.2 to 9.8) |
| Mean (SD) haemoglobin A1c (%) | 6.9 (1.7) | 6.8 (1.5) |
| Mean (SD) blood pressure (mm Hg): | ||
| Systolic | 159 (20) | 160 (18) |
| Diastolic | 94 (10) | 94 (9) |
| Receiving antihypertensive treatment | 286 (36) | 145 (37) |
| Smoking: | ||
| No of patients | 746 | 379 |
| Non-smoker | 281 (38) | 142 (38) |
| Ex-smoker | 294 (39) | 152 (40) |
| Current smoker | 171 (23) | 85 (22) |
| Urinary albumin (mg/l)*: | ||
| ⩾50 | 114 (18) | 53 (16) |
| ⩾300 | 18 (3) | 13 (4) |
| Retinopathy: | ||
| No of patients | 617 | 312 |
| 20 20 or worse | 143 (23) | 89 (29) |
| 35 35 or worse | 45 (7) | 32 (10) |
| Mean (SD) cholesterol (mmol/l): | ||
| Total | 5.5 (1.1) | 5.6 (1.1) |
| HDL | 1.10 (0.27) | 1.10 (0.28) |
| LDL | 3.6 (1.1) | 3.6 (1.1) |
| Geometric mean (1SD interval) triglyceride (mmol/l) | 1.6 (0.9 to 2.6) | 1.6 (0.9 to 2.8) |
| Median duration (interquartile range) of diabetes (years) | 2.7 (1.0 to 4.2) | 2.5 (1.0 to 4.4) |
| Treatment for diabetes: | ||
| Diet | 175 (29) | 89 (29) |
| Sulphonylurea | 200 (34) | 103 (34) |
| Metformin | 41 (8) | 23 (7) |
| Combined oral hypoglycaemic agents | 28 (5) | 16 (5) |
| Insulin | 144 (23) | 70 (24) |
| Other | 6 (1) | 1 (1) |
HDL=high density lipoprotein.
LDL=low density lipoprotein.
Corrected to urinary creatinine concentration of 8 mmol/l.
Treatment protocol
Randomisation stratified for those with or without previous treatment for hypertension was performed by the coordinating centre. In all 758 patients were allocated tight control of blood pressure, aiming for a blood pressure <150/85 mm Hg (400 patients were given an angiotensin converting enzyme inhibitor (captopril) and 358 a β blocker (atenolol) as the main treatment); 390 patients were allocated a less tight control of blood pressure, aiming for a blood pressure <180/105 mm Hg but avoiding treatment with angiotensin converting enzyme inhibitors or β blockers (fig 1). Sealed opaque envelopes were used and checked as described for the UK prospective diabetes study.23 The original blood pressure target of 200/105 mm Hg in the group assigned to less tight control was reduced in 1992 by the steering committee of the hypertension in diabetes study after publication of the results of studies in elderly, non-diabetic subjects during 1991-2.16,25,26 Randomisation produced balanced numbers of patients allocated to the various glucose and blood pressure treatment combinations for the UK prospective diabetes study and hypertension in diabetes study.
Captopril was usually started at a dose of 25 mg twice daily, increasing to 50 mg twice daily, and atenolol at a daily dose of 50 mg, increasing to 100 mg if required. Other agents were added if the control criteria were not met in the group assigned to tight control despite maximum allocated treatment or in the group assigned to less tight control without drug treatment. The suggested sequence was frusemide 20 mg daily (maximum 40 mg twice daily), slow release nifedipine 10 mg (maximum 40 mg) twice daily, methyldopa 250 mg (maximum 500 mg) twice daily, and prazosin 1 mg (maximum 5 mg) thrice daily.
Clinic visits
Patients visited study clinics every 3-4 months. At each visit plasma glucose concentration, blood pressure, and body weight were measured, and treatments to control blood pressure and blood glucose concentration were noted and adjusted if target values were not met. If treatments and target blood pressures were not in accord with the protocol, the coordinating centre sent letters about affected patients to the clinical centres requesting appropriate action. A central record of all apparent protocol deviations was maintained. Symptoms including any drug side effects and clinical events were noted. Physicians recorded hypoglycaemic episodes as minor if the patient was able to treat the symptoms unaided and as major if third party or medical intervention was necessary.
Blood pressure measurements
Blood pressure (diastolic phase 5) while the patient was sitting and had rested for at least five minutes was measured by a trained nurse with a Copal UA-251 or a Takeda UA-751 electronic auscultatory blood pressure reading machine (Andrew Stephens, Brighouse, West Yorkshire) or with a Hawksley random zero sphygmomanometer (Hawksley, Lancing, Sussex) in patients with atrial fibrillation. The first reading was discarded and the mean of the next three consecutive readings with a coefficient of variation below 15% was used in the study, with additional readings if required. Monthly quality assurance measurements have shown the mean difference between Takeda and Hawksley machines to be 1 (4) mm Hg or less.
Clinical examination
At entry to the UK prospective diabetes study and subsequently every three years all patients had a clinical examination which included retinal colour photography, ophthalmoscopy, measurement of visual acuity, assessment of peripheral and autonomic neuropathy, chest radiography, electrocardiography, and measurement of brachial and posterior tibial blood pressure using Doppler techniques. Annual direct ophthalmoscopy was also carried out. Every year a fasting blood sample was taken to measure glycated haemoglobin (haemoglobin A1c), plasma creatinine concentration, and concentrations of urea, immunoreactive insulin, and insulin antibodies; random urine samples were taken for measurement of albumin concentration.
Visual acuity was measured with Snellen charts until 1989, after which ETDRS (early treatment of diabetic retinopathy study) charts22 were used to assess best corrected vision, with current refraction or through a pinhole. Retinal colour photographs of four standard 30° fields per eye (nasal, disc, macula, and temporal to macular fields) were taken plus stereophotographs of the macula. Repeat photography was arranged if the quality of the photograph was unsatisfactory. Retinal photographs were assessed at a central grading centre by two independent assessors for the presence or absence of diabetic retinopathy. Any fields with retinopathy were graded by two further senior independent assessors using a modified ETDRS final scale.22 Neuropathy was assessed clinically by knee and ankle reflexes, and by biothesiometer (Biomedical Instruments, Newbury, Ohio) readings taken from the lateral malleoli and the end of the big toe.22 A 12 lead electrocardiogram was recorded and given a Minnesota code,22 and a chest x ray film was taken for measurement of cardiac diameter.
Biochemistry
Biochemical methods have been reported previously.23,27 Urinary albumin concentration was measured by an immunoturbidimetric method with a normal reference range of 1.4 mg/l to 36.5 mg/l.27 Microalbuminuria has been defined as a urinary albumin concentration of ⩾50 mg/l28 and clinical grade proteinuria as a urinary albumin concentration of ⩾300 mg/l.
Clinical end points
Twenty one clinical end points were predefined in the study protocol.22 All available clinical information was gathered for possible end points—for example, copies of admission notes, operation records, death certificates, and necropsy reports. Copies of these, without reference to the patient’s allocated or actual treatment, were formally presented to two independent physicians who allocated an appropriate code from the ninth revision of the international classification of diseases (ICD-9) if the criteria for any particular clinical end point had been met. Any disagreement between the two assessors was discussed and the evidence reviewed. If agreement was not possible the information was submitted to a panel of two further independent assessors for final arbitration. The closing date for the study was 30 September 1997.
End points were aggregated for the main analyses. The three predefined primary outcome analyses were the time to the occurrence of (a) a first clinical end point related to diabetes (sudden death, death from hyperglycaemia or hypoglycaemia, fatal or non-fatal myocardial infarction, angina, heart failure, stroke, renal failure, amputation (of at least one digit), vitreous haemorrhage, retinal photocoagulation, blindness in one eye or cataract extraction); (b) death related to diabetes (death due to myocardial infarction, sudden death, stroke, peripheral vascular disease, renal disease, hyperglycaemia or hypoglycaemia); (c) death from all causes.
Secondary outcome analyses of four additional aggregates of clinical end points were used to assess the effect of treatments on different types of vascular disease. These were myocardial infarction (fatal or non-fatal myocardial infarction or sudden death), stroke (fatal or non-fatal stroke), amputation or death from peripheral vascular disease, and microvascular complications (retinopathy requiring photocoagulation, vitreous haemorrhage, and fatal or non-fatal renal failure).
Since a patient could in sequence have different end points, he or she could be included in more than one end point category.
Surrogate end points—
Details of subclinical, surrogate variables have been published.23
Statistical analysis
Analysis was on an intention to treat basis, comparing patients allocated to tight and less tight blood pressure control. Patients allocated to tight control with angiotensin converting enzyme inhibitors or β blockers were pooled in this paper for analysis. They are compared in the accompanying paper.29 Life table analyses were performed with log rank tests, and hazard ratios were obtained from Cox’s proportional hazards models and used to estimate relative risks. Survival function estimates were calculated using the product limit (Kaplan-Meier) method. In the text relative risks are quoted as risk reductions and significance tests were two sided. For aggregate end points 95% confidence intervals are quoted, whereas for single end points 99% confidence intervals are quoted to allow for potential type 1 errors. Similarly, 99% confidence intervals were used to assess surrogate end points that were measured at triennial visits. Mean (SD), geometric mean (1 SD interval), or median (interquartile range) values are quoted for the biometric and biochemical variables, with values from Wilcoxon, t, or χ2 tests for comparisons. Risk reductions for surrogate end points were derived from frequency tables. The overall values for blood pressure during a period were assessed for each patient as the mean during that period and for each allocation as the mean of patients with data in the allocation. Control of blood pressure was assessed in patients allocated to the two groups who had data at nine years of follow up.
Hypoglycaemia was determined from the number of patients allocated to a treatment and continuing with it who had one or more minor or major hypoglycaemic episodes each year. Urinary albumin concentration was measured in mg/l. Change in diabetic retinopathy was defined as a change of two steps (one step in both eyes or two or more steps in one eye) with a scale from the worse eye to the better eye that included retinal photocoagulation or vitreous haemorrhage as the most serious grade. Visual loss was defined as the best vision in either eye, deteriorating by three lines on an ETDRS chart.
Both the UK prospective diabetes study and hypertension in diabetes study received ethical approval from the appropriate committee in each centre and conformed with the guidelines of the Declarations of Helsinki (1975 and 1983). All patients gave informed consent.
Data monitoring and ethics committee
The data monitoring and ethics committee examined the end points every six months to consider halting or modifying the study according to predetermined guidelines. These included a difference of three or more standard deviations by log rank test in the rate of deaths related to diabetes or deaths related to diabetes and major illness between the group assigned to tight control and that assigned to less tight control or between the group given captopril and that given atenolol.22 One of the stopping criteria was attained immediately before the scheduled end of the study.
Results
Follow up
The median follow up to death, the last known date at which vital status was known, or to the end of the trial was 8.4 years. The vital status was known at the end of the trial in all patients except 14 (1%) who had emigrated and a further 33 patients (3%) who could not be contacted in the last year of the study for assessment of clinical end points.
Control of blood pressure
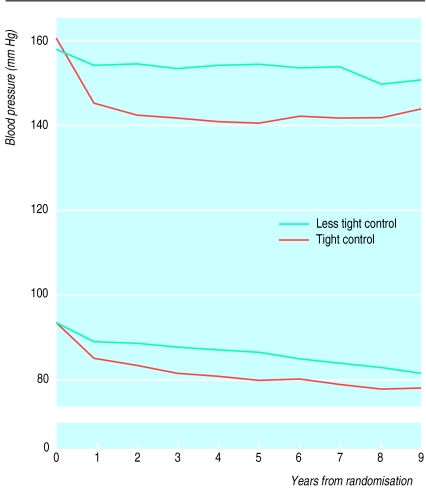
The mean (SD) blood pressure in the two groups was similar at randomisation (table 1). Mean blood pressure in patients over nine years of follow up was 144 (14)/82 (7) mm Hg in the 297 patients under tight control and 154 (16)/87 (7) mm Hg in the 156 assigned to less tight control (P<0.0001 in both cases) (fig 2). The mean differences in systolic and diastolic pressures were 10 (95% confidence interval 9 to 12) mm Hg and 5 (4 to 6) mm Hg respectively. Cross sectional blood pressure in patients with data at each year were similar to the data in patients with nine years of follow up. At nine years the proportion of patients with both a systolic blood pressure of <150 mm Hg and a diastolic blood pressure of <85 mm Hg was 56% in the group assigned to tight control and 37% in the group assigned to less tight control. The proportion of patients who had a mean blood pressure of <180/105 mm Hg was 96% and 91% respectively.
Figure 2.
Mean systolic and diastolic blood pressures over nine years in 297 patients in group assigned to tight control of blood pressure and 156 in group assigned to less tight control
Compliance with allocated treatment
In the group assigned to tight control of blood pressure patients took their allocated treatment for 77% of the total person years and did not take antihypertensive treatments for 6% of the total person years. In the other group patients did not take any antihypertensive treatments for 43% of the total person years; they took an angiotensin converting enzyme inhibitor for 11% of the total person years and a β blocker for 9%.
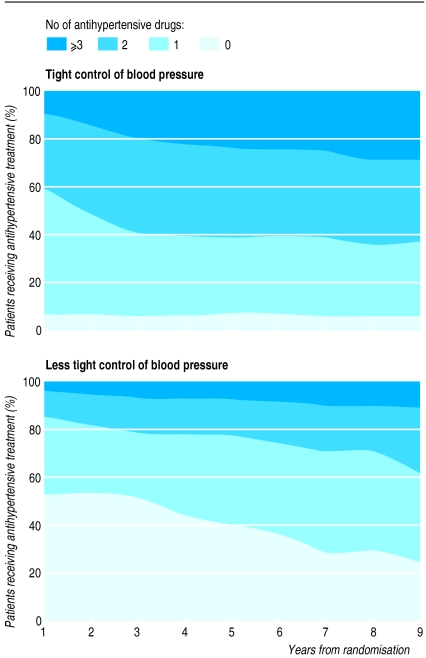
Figure 3 shows the increasing number of antihypertensive agents required to maintain blood pressure lower than target levels. At nine years 29% of those assigned to tight blood pressure control required three or more agents in comparison with 11% of patients in the other group. The proportion of patients taking nifedipine was 32% in the group assigned to less tight blood pressure control and 31% and 40% in the group assigned to tight blood pressure control taking captopril and atenolol respectively.
Figure 3.
Proportion of patients over nine years who required no drugs, one drug, two drugs, or three or more drugs for treating hypertension to attain target blood pressure
Control of blood glucose
Haemoglobin A1c in the groups assigned to tight and less tight blood pressure control over 1-4 years was 7.2% and 7.2% respectively and over 5-8 years 8.3% and 8.2% respectively.
Aggregate clinical end points
Any clinical end point related to diabetes
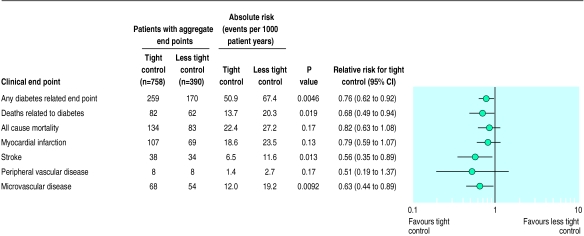
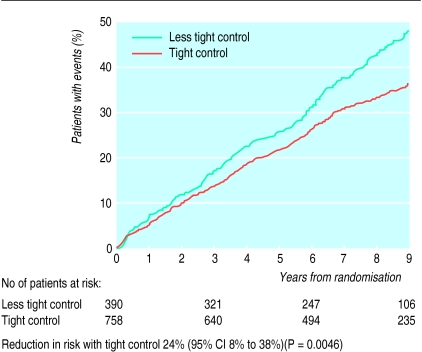
Patients allocated to tight compared with less tight control of blood pressure had a 24% reduction in risk of developing any end point related to diabetes, (P=0.0046) (figs 4 and 5).
Figure 4.
Numbers of patients who attained one or more clinical end points in aggregates representing specific types of clinical complications, with relative risks comparing tight control of blood pressure with less tight control
Figure 5.
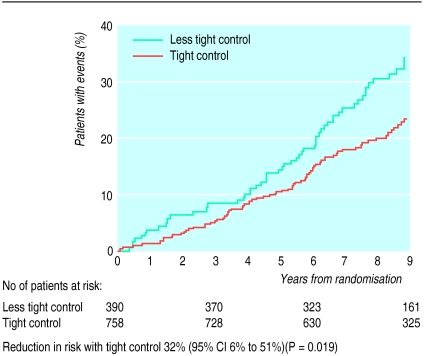
Kaplan-Meier plots of proportions of patients with any clinical end point, fatal or non-fatal, related to diabetes
Deaths related to diabetes and all cause mortality
Patients in the group assigned to tight blood pressure control compared with those in the other group had a 32% reduction in risk of mortality from diseases substantially increased by diabetes (P=0.019), two thirds of which were cardiovascular diseases. The reduction in all cause mortality was not significant (fig 4). The trend to protection against microvascular disease and death related to diabetes became evident within the first three years of allocation to tight control (figs 4–7).
Figure 7.
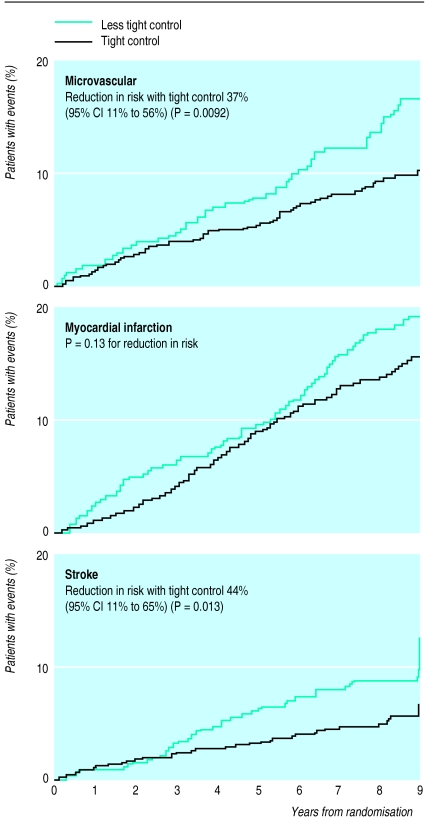
Kaplan-Meier plots of proportions of patients who developed microvascular end points (mostly retinal photocoagulation), fatal or non-fatal myocardial infarction or sudden death, and fatal or non-fatal strokes
Myocardial infarction, stroke and peripheral vascular disease
The group assigned to tight blood pressure control had a non-significant reduction in risk of 21% in the aggregate end point for myocardial infarction (table 2 and fig 7). This group also had a 44% reduction in risk of stroke, fatal and non-fatal, compared with the group assigned to less tight blood pressure control (P=0.013). Amputations were not significantly reduced, with a trend to reductions in risk of 49%. One patient in each group died of peripheral vascular disease.
Table 2.
Comparison of results of hypertension in diabetes study with those of systolic hypertension in elderly programme29
| Hypertension in diabetes study | Systolic hypertension in elderly programme | |
|---|---|---|
| No of subjects | 1148 | 583 |
| Mean (SD) age (years) | 56 (8) | 70 (6) |
| Proportion of men (%) | 55 | 50 |
| Blood pressure on entry (mm Hg) | 160/94 | 170/76 |
| Proportion receiving antihypertensive drugs (%) | 36 | 42 |
| Diabetes entry criterion | Fasting plasma glucose >6 mmol/l on 2 occasions | Known diabetes or fasting plasma glucose ⩾7.8 mmol/l |
| Hypoglycaemic treatment | Diet, oral hypoglycaemic agents, insulin | Diet, oral hypoglycaemic agents |
| Duration of trial (years) | 9 | 5 |
| Intervention in active group | Captopril or atenolol | Chlorthalidone with or without atenolol or reserpine |
| Blood pressure (mm Hg): | ||
| Tight control group | 144/82 | 145/71 |
| Less tight control group | 154/87 | 155/69 |
| Difference | 10/5 | 10/2 |
| Outcome (relative risk (95% CI)): | ||
| Death related to diabetes | 0.68 (0.49 to 0.94) | Not reported |
| Myocardial infarction, fatal or non-fatal, and sudden death | 0.79 (0.59 to 1.07) | 0.46 (0.24 to 0.88) |
| Stroke, fatal or non-fatal | 0.56 (0.35 to 0.89) | 0.78 (0.45 to 1.34) |
| Microvascular disease | 0.64 (0.44 to 0.91) | Not assessed |
When all macrovascular diseases were combined, including myocardial infarction, sudden death, stroke, and peripheral vascular disease, the group assigned to tight blood pressure control had a 34% reduction in risk compared with the group assigned to less tight control (P=0.019).
Microvascular disease
The group assigned to tight blood pressure control had a 37% reduction in risk of microvascular disease compared with the less tight group (P=0.0092) (figs 4 and 7).
Numbers needed to treat
The number of patients who needed to be treated over 10 years to prevent one patient developing any complication was 6.1 (95% confidence interval 2.6 to 9.5) and to prevent death from a cause related to diabetes 15.0 (12.1 to 17.9).
Single clinical end points
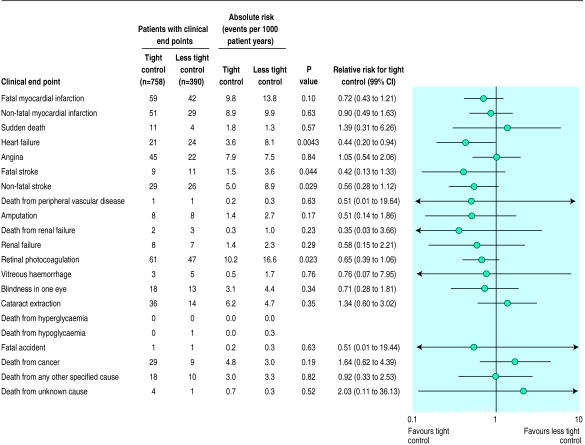
There was a 56% reduction in risk of heart failure (P=0.0043) (fig 8) in the tight control group compared with the less tight control group. There was a 35% reduction in risk of retinal photocoagulation (P=0.023) (fig 8). The trend for reduced risk of fatal and non-fatal renal failure was non-significant (fig 8). There was no significant difference in the incidence of death from accidents, cancer, other specified causes or unknown causes.
Figure 8.
Numbers of patients who attained individual end points, with relative risks comparing tight control of blood pressure with less tight control
Analyses of surrogate end points
Retinopathy and visual acuity—
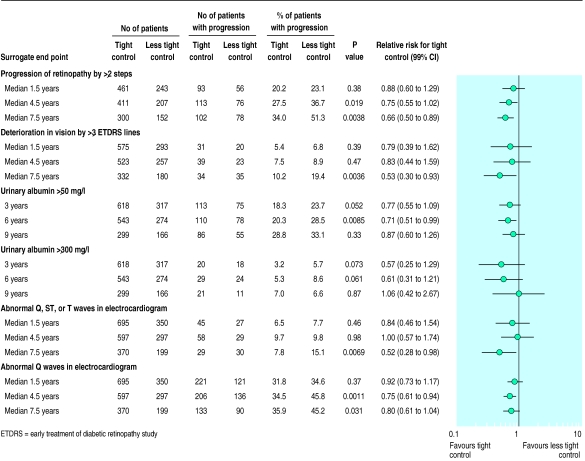
From median 4.5 years of follow up a smaller proportion of patients in the group assigned to tight blood pressure control showed deterioration in retinopathy from baseline by two or more steps (fig 9), with a 34% reduction in risk by median 7.5 years (P=0.004). This was partly because fewer patients required retinal photocoagulation, but the risk was still significantly reduced when retinal photocoagulation was excluded (data not shown). At nine years of follow up the group assigned to tight blood pressure control had a 47% reduction in risk of a decrease in vision by three or more lines in both eyes measured with an ETDRS chart (P=0.004) (fig 9). There was no significant difference in the proportion of patients with impaired vision preventing driving (visual acuity < 6/12 Snellen or ETDRS chart>0.3), although the trend was for a 28% reduction in risk in the group assigned to tight control (32/371, 8.6%) compared with the group assigned to less tight control (24/201,11.9%) (P=0.20).
Figure 9.
Numbers of patients who attained surrogate end points, with relative risks comparing tight control of blood pressure with less tight control
Microalbuminuria and proteinuria—
By six years a smaller proportion of patients in the group under tight blood pressure control had a urinary albumin concentration of ⩾50 mg/l, a 29% reduction in risk (P=0.009), with a non-significant 39% reduction in risk for proteinuria ⩾300 mg/l (P=0.061) (fig 9). The reduction in risk for both a urinary albumin concentration of ⩾50 mg/l and proteinuria at nine years of follow up was not significant. There was no significant difference in plasma creatinine concentration or in the proportion of patients who had a twofold increase in plasma creatinine concentration between the two groups.
Neuropathy—The surrogate indices of neuropathy and autonomic neuropathy were not significantly different between the two groups.
ECG abnormality—By median 7.5 years the tight control group had a lower proportion of Q wave ECG abnormalities than the less tight control group, 29/370 and 30/199 (7.8% and 15.1%, P=0.007) respectively, a 48% risk reduction. ST and T wave abnormalities were also reduced in the tight control group (fig 9). There was no difference between the allocations for other surrogate indices of macrovascular disease.
There was no significant difference between the groups in the proportion of patients who developed surrogate indices for macrovascular disease.
Side effects
Hypoglycaemia—
There was no significant difference in the cumulative incidence of hypoglycaemia in the groups assigned to tight and less tight blood pressure control, with 6.1% and 4.4% respectively having a major hypoglycaemic attack. The cause of death in one patient in the group assigned to less tight control of blood pressure was attibuted to hypoglycaemia.
Weight gain—
Mean weight gain was similar in the two groups (1.3 kg in the group assigned to less tight control and 2.0 kg in the tight control; P=0.13).
Discussion
This paper reports that patients with hypertension and type 2 diabetes assigned to tight control of blood pressure achieved a significant reduction in risk of 24% for any end points related to diabetes, 32% for death related to diabetes, 44% for stroke, and 37% for microvascular disease. In addition there was a 56% reduction in risk of heart failure. The mean blood pressure over nine years was 144/82mm Hg on tight control compared with a less tight control mean of 154/87mm Hg. In comparison, intensive blood glucose control in the UK prospective diabetes study decreased the risk of any diabetes related end point by 12% (P=0.029) and microvascular disease by 25% (P=0.0099).23
Comparison of cardiovascular results with other studies
—The risk reduction for strokes is similar to results from a meta-analysis of clinical trials of improved blood pressure control in the general population, which showed risk reductions of 42% for strokes and 12% for myocardial infarction.14 The reduction in cardiovascular end points is in accord with the results of the Systolic Hypertension in the Elderly Program for the 568 patients with non-insulin treated type 2 diabetes whose mean age was 70 and mean blood pressure 170/76mm Hg at baseline (table 2).30 The Hypertension Optimal Treatment study showed a reduction in cardiovascular mortality for 1501 diabetic patients randomly allocated a target diastolic blood pressure of ⩽80mm Hg,31 although the blood pressures acheived have not been published. Intensive blood pressure control in the diabetic subgroup of the Hypertension Detection and Follw-up Program showed no effect on all cause mortality.32
Retinopathy
—The was a 34% reduction in the rate of progression of retinopathy by two or more steps using the modified ETDRS final scale. The 47% reduction in the deterioration of visual acuity by three lines using the ETDRS chart (equivalent to a change from 6/6 to 6/12 or 6/9 to 6/18 on the Snellen chart) suggests that tight blood pressure control also prevented the development of diabetic maculopathy, which is the main cause of visual impairment in type 2 diabetes.33 In the UK prospective diabetes study diabetic maculopathy occurred in 78% of patients requiring retinal photocoagulation. As diabetic maculopathy responds less well to laser retinal photocoagulation than proliferative retinopathy,34,35 reducing the risk of maculopathy by tight blood pressure control might provide a major clinical benefit in reducing the risk of blindness. To our knowledge this is the first report in patients with type 2 diabetes to show that tight blood pressure control reduces the risk of clinical complications from diabetic eye disease.
Renal disease
—The proportion of patients in the group assigned to tight blood pressure control who had a urinary albumin concentration of >50 mg/l at six years of follow up was only significantly lower than in the group assigned to less tight control at six years follow-up. Good control of blood pressure in patients with renal failure prevents progression of established renal failure in type 1 diabetes.18,19,36 Ravid et al also showed in 49 normotensive subjects with type 2 diabetes and microalbuminuria (mean 143 mg/24 h (range 30-290)) that improved blood pressure control with enalapril prevented an increase in urine albumin excretion and gave a slower decline in renal function.37 Previous epidemiological studies have shown an association between hypertension and albuminuria in patients with type 2 diabetes who do not have renal failure.11,12
High blood pressure in type 2 diabetes
—Hypertension remains underrecognised and undertreated in the diabetic as well as in the general population. In the 1995 health survey for England 40% of the general population with hypertension (World Health Organisation criteria: >160 mm Hg systolic, >95 mm Hg diastolic) were not treated and one third of the treated subjects still had a blood pressure greater than 160/95 mm Hg. The mean blood pressure in the group assigned to less tight control of blood pressure in the hypertension in diabetes study over nine years of follow up from a mean age of 56 at recruitment was 154/87 mm Hg. In the second national health and nutrition survey of 1976-80 in the United States 28% of hypertensive diabetic patients had blood pressures of ⩾160 mm Hg or ⩾95 mm Hg.9
In this study the mean blood pressure in the group assigned to tight blood pressure control was 144/82 mm Hg which is lower than the blood pressures often achieved in hypertensive subjects with or without diabetes. Advisory groups have recommended that the goals for blood pressure in diabetic patients should be <140/90 mm Hg,38–40 <140/85 mm Hg,41 or <130/85 mm Hg.42,43 These recommendations are based on studies in the general population14 and in patients with type 1 diabetes with microalbuminuria or established nephropathy.18,19 Guidelines were formulated on the assumption that data relating to hypertensive non-diabetic subjects and relatively young patients with type 1 diabetes also applied to those with type 2 diabetes. The prevention of both macrovascular and microvascular disease observed in this study provides evidence for the necessity of tight blood pressure control in type 2 diabetes. The recommendations for the less strict “fair” or “acceptable” blood pressure control targets by some of the advisory groups of ⩽160/95 mm Hg,38 <160/90 mm Hg,40,41 or <150/90 mm Hg39 need to be reviewed in the light of the results of our study.
Conclusion
Hypertension is common in patients with type 2 diabetes, with a prevalence of 40-60% over the age range of 45 to 75. This study, embedded within the UK prospective diabetes study, shows that treatment with an angiotensin converting enzyme inhibitor or β blocker aiming for a blood pressure of <150/85 mm Hg substantially reduces the risk of death and complications due to diabetes. The management of blood pressure should have a high priority in the treatment of type 2 diabetes.
Figure 6.
Kaplan-Meier plots of proportions of patients who die of disease related to diabetes (myocardial infarction, sudden death, stroke, peripheral vascular disease, and renal failure)
Acknowledgments
We appreciate the cooperation of the patients and many NHS and non-NHS staff at the centres. We thank Philip Bassett for editorial assistance, and Caroline Wood, Kathy Waring, and Lorraine Mallia for typing the manuscripts.
Footnotes
Members of the study group are given at the end of the paper.
Funding: The UK prospective diabetes study and the hypertension in diabetes study was funded by grants from the Medical Research Council, British Diabetic Association, Department of Health, the United States National Eye Institute and the United States National Institute of Diabetes, Digestive and Kidney Disease in the National Institutes of Health, the British Heart Foundation, the Charles Wolfson Charitable Trust, the Clothworkers’ Foundation, the Health Promotion Research Trust, the Alan and Babette Sainsbury Trust, the Oxford University Medical Research Fund Committee, and pharmaceutical companies, including Novo-Nordisk, Bayer, Bristol-Myers Squibb, Hoechst, Lilly, Lipha, and Farmitalia Carlo Erba. GlaxoWellcome, SmithKline Beecham, Pfizer, Zeneca, Pharmacia and Upjohn, and Roche provided grants for health economics and epidemiological studies. Boehringer Mannheim, Becton Dickinson, Owen Mumford, Securicor, Kodak, and Cortecs Diagnostics gave additional help.
Conflict of interest: None.
References
- 1.Garcia MJ, McNamara PM, Gordon T, Kannell WB. Morbidity and mortality in diabetics in the Framingham population. Sixteen year follow-up. Diabetes. 1974;23:105–111. doi: 10.2337/diab.23.2.105. [DOI] [PubMed] [Google Scholar]
- 2.Stamler J, Vaccaro O, Neaton JD, Wentworth D. Diabetes, other risk factors, and 12 year cardiovascular mortality for men screened in the multiple risk factor intervention trial. Diabetes Care. 1993;16:434–444. doi: 10.2337/diacare.16.2.434. [DOI] [PubMed] [Google Scholar]
- 3.Manson JAE, Colditz GA, Stampfer MJ, Willett WC, Krolewski AS, Rosner B, et al. A prospective study of maturity-onset diabetes mellitus and risk of coronary heart disease and stroke in women. Arch Intern Med. 1991;151:1141–1147. [PubMed] [Google Scholar]
- 4.Perneger TV, Brancati FL, Whelton PK, Klag MJ. End-stage renal disease attributable to diabetes mellitus. Ann Intern Med. 1994;121:912–918. doi: 10.7326/0003-4819-121-12-199412150-00002. [DOI] [PubMed] [Google Scholar]
- 5.Klag MJ, Whelton PK, Randall BL, Neaton JD, Brancati FL, Ford CE, et al. Blood pressure and end stage renal disease in men. N Engl J Med. 1996;334:13–18. doi: 10.1056/NEJM199601043340103. [DOI] [PubMed] [Google Scholar]
- 6.United Kingdom Prospective Diabetes Study Group. UK Prospective Diabetes Study 23: risk factors for coronary artery disease in non-insulin dependent diabetes. BMJ. 1998;316:823–828. doi: 10.1136/bmj.316.7134.823. [DOI] [PMC free article] [PubMed] [Google Scholar]
- 7.Hypertension in Diabetes Study Group. HDS 1: Prevalence of hypertension in newly presenting type 2 diabetic patients and the association with risk factors for cardio-vascular and diabetic complications. J Hypertens. 1993;11:309–317. doi: 10.1097/00004872-199303000-00012. [DOI] [PubMed] [Google Scholar]
- 8.Prescott-Clarke P, Primatesta P, editors. Health survey for England 1995. London: HMSO; 1997. [Google Scholar]
- 9.Harris MI, Cowie CC, Stern MP, Boyko EJ, Reiber GE, Bennett PH, editors. Diabetes in America. 2nd ed. Washington, DC: National Institutes of Health, National Institute of Diabetes and Digestive and Kidney Diseases; 1995. [Google Scholar]
- 10.Hypertension in Diabetes Study Group. HDS 2: Increased risk of cardio-vascular complications in hypertensive type 2 diabetic patients. J Hypertens. 1993;11:319–325. doi: 10.1097/00004872-199303000-00013. [DOI] [PubMed] [Google Scholar]
- 11.United Kingdom Prospective Diabetes Study Group. UK Prospective Diabetes Study X: urinary albumin excretion over 3 years in diet-treated type 2 (non-insulin-dependent) diabetic patients, and association with hypertension, hyperglycaemia and hypertriglyceridaemia. Diabetologia. 1993;36:1021–1029. [PubMed] [Google Scholar]
- 12.Nelson RG, Bennett PH, Beck GJ, Tan M, Knowler WC, Mitch WE, et al. Development and progression of renal disease in Pima Indians with non-insulin-dependent diabetes mellitus. N Engl J Med. 1996;335:1636–1642. doi: 10.1056/NEJM199611283352203. [DOI] [PubMed] [Google Scholar]
- 13.United Kingdom Prospective Diabetes Study Group. UK Prospective Diabetes Study 30: diabetic retinopathy at diagnosis of type 2 diabetes and associated risk factors. Arch Ophthalmol. 1998;116:297–303. doi: 10.1001/archopht.116.3.297. [DOI] [PubMed] [Google Scholar]
- 14.Collins R, MacMahon S. Blood pressure, antihypertensive drug treatment and the risks of stroke and of coronary heart disease. Br Med Bull. 1994;50:272–298. doi: 10.1093/oxfordjournals.bmb.a072892. [DOI] [PubMed] [Google Scholar]
- 15.Collins R, Peto R, MacMahon S, Herbert P, Fiebach NH, Eberlein KA, et al. Blood pressure, stroke, and coronary heart disease. Part 2. Short-term reductions in blood pressure: overview of randomised drug trials in their epidemiological context. Lancet. 1990;335:827–838. doi: 10.1016/0140-6736(90)90944-z. [DOI] [PubMed] [Google Scholar]
- 16.Medical Research Council Working Party. MRC trial of treatment of hypertension in older adults: principal results. BMJ. 1992;304:405–412. doi: 10.1136/bmj.304.6824.405. [DOI] [PMC free article] [PubMed] [Google Scholar]
- 17.Sanderson S. Hypertension in the elderly: pressure to treat? Health Trends. 1996;28(4):117–121. [Google Scholar]
- 18.Parving HH, Andersen M, Smidt UH, Hommel E, Mathiesen ER, Svendsen PA. Effect of antihypertensive treatment on kidney function in diabetic nephropathy. BMJ. 1987;294:1443–1447. doi: 10.1136/bmj.294.6585.1443. [DOI] [PMC free article] [PubMed] [Google Scholar]
- 19.Mogensen C, Keane W, Bennett P, Jerums G, Parving H, Passa P, et al. Prevention of diabetic renal disease with special reference to microalbuminuria. Lancet. 1995;346:1080–1084. doi: 10.1016/s0140-6736(95)91747-0. [DOI] [PubMed] [Google Scholar]
- 20.Mogensen CE. Systemic blood pressure and glomerular leakage with particular reference to diabetes and hypertension. J Intern Med. 1994;235:297–316. doi: 10.1111/j.1365-2796.1994.tb01080.x. [DOI] [PubMed] [Google Scholar]
- 21.Hypertension in Diabetes Study Group. HDS 3: Prospective study of therapy in type 2 diabetic patients—efficacy of ACE inhibitor and β-blocker. Diabet Med. 1994;11:773–782. [PubMed] [Google Scholar]
- 22.United Kingdom Prospective Diabetes Study Group. UK prospective diabetes study VIII: study design, progress and performance. Diabetologia. 1991;34:877–890. [PubMed] [Google Scholar]
- 23.United Kingdom Prospective Diabetes Study Group. UK prospective diabetes study 33: intensive blood glucose control with sulphonylureas or insulin compared with conventional treatment and risk of complications in patients with type 2 diabetes Lancet 1998;352:837-53. [PubMed]
- 24.British Diabetic Association. Dietary recommendations for diabetics for the 1980s. Hum Nutr Appl Nutr. 1982;36:378–394. [PubMed] [Google Scholar]
- 25.Systolic Hypertension in the Elderly Program Cooperative Research Group. Prevention of stroke by antihypertensive drug treatment in older persons with isolated systolic hypertension. Final results of the systolic hypertension in the elderly program (SHEP) JAMA. 1991;265:3255–3264. [PubMed] [Google Scholar]
- 26.Dahlof B, Lindholm L, Hansson L, Scheriten B, Ekbom T, Wester PO. Morbidity and mortality in the Swedish trial in old patients with hypertension (STOP-Hypertension) Lancet. 1991;338:1281–1285. doi: 10.1016/0140-6736(91)92589-t. [DOI] [PubMed] [Google Scholar]
- 27.United Kingdom Prospective Diabetes Study Group. UK Prospective Diabetes Study XI: biochemical risk factors in type 2 diabetic patients at diagnosis compared witn age-matched normal subjects. Diabet Med. 1994;11:534–544. [PubMed] [Google Scholar]
- 28.Manley SE, Burton ME, Fisher KE, Cull CA, Tumer RC. Decreases in albumin/creatinine and N-acetylglucosaminidase/creatinine ratios in urine samples stored at −20°C. Clin Chem. 1992;38:2294–2299. [PubMed] [Google Scholar]
- 29.UK Prospective Diabetes Study Group. Efficacy of atenolol and captopril in reducing risk of macrovascular and microvascular complications in type 2 diabetes: UKPDS 39. BMJ. 1998;317:713–720. [PMC free article] [PubMed] [Google Scholar]
- 30.Curb JD, Pressel SL, Cutler JA, Savage P, Applegate WB, Black H, et al. Effect of diuretic-based antihypertensive treatment on cardiovascular disease risk in older diabetic patients with isolated systolic hypertension. Systolic Hypertension in the Elderly Program Cooperative Research Group. JAMA. 1996;276:1886–1892. [PubMed] [Google Scholar]
- 31.Hansson L, Zanchetti A, Carruthers SG, Dahlf B, Elmfeldt D, Julius S, et al. Effect of intensive blood-pressure lowering and low-dose aspirin in patients with hypertension: principal results of the hypertension optimal treatment (HOT) randomised trial. Lancet. 1998;351:1755–1762. doi: 10.1016/s0140-6736(98)04311-6. [DOI] [PubMed] [Google Scholar]
- 32.Hypertension Detection and Follow-up Program Cooperative Group. Mortality findings for stepped-care and referred-care participants in the Hypertension Detection and Follow-up Program, stratified by other risk factors. Prev Med. 1985;14:312–335. doi: 10.1016/0091-7435(85)90059-3. [DOI] [PubMed] [Google Scholar]
- 33.Klein R, Moss SE, Klein BE, Davis MD, DeMets DL. The Wisconsin Epidemiologic Study of Diabetic Retinopathy. XI. The incidence of macular edema. Ophthalmology. 1989;96:1501–1510. doi: 10.1016/s0161-6420(89)32699-6. [DOI] [PubMed] [Google Scholar]
- 34.Davies EG, Petty RG, Kohner EM. Long term effectiveness of photocoagulation for diabetic maculopathy. Eye. 1989;3:764–767. doi: 10.1038/eye.1989.119. [DOI] [PubMed] [Google Scholar]
- 35.British Multicentre Group. Photocoagulation for proliferative diabetic retinopathy: a randomised controlled clinical trial using the xenon-arc. Diabetologia. 1984;26:109–115. doi: 10.1007/BF00281116. [DOI] [PubMed] [Google Scholar]
- 36.Parving HH, Hommel E, Smidt UM. Protection of kidney function and decrease in albuminuria by captopril in insulin dependent diabetics with nephropathy. BMJ. 1987;297:1086–1091. doi: 10.1136/bmj.297.6656.1086. [DOI] [PMC free article] [PubMed] [Google Scholar]
- 37.Ravid M, Savin H, Jutrin I, Bental T, Lang R, Lishner M. Long-term effect of ACE inhibition on development of nephropathy in diabetes mellitus type II. Kidney Int. 1994;45(suppl):S161–S164. [PubMed] [Google Scholar]
- 38.Alberti KGMM, Gries FA, Jervell J, Krans HM. A desktop guide for the management of non-insulin-dependent diabetes mellitus (NIDDM): an update. Diabetic Med. 1994;11:899–909. doi: 10.1111/j.1464-5491.1994.tb00376.x. [DOI] [PubMed] [Google Scholar]
- 39.Canadian Diabetes Advisory Board. Clinical practice guidelines. Can Med Assoc J. 1992;147:697–712. [PMC free article] [PubMed] [Google Scholar]
- 40.Bauduceau B, Chatellier G, Cordonnier D, Marre M, Mimran A, Monnier L, et al. Hypertension arterielle et diabète. Membres des conseils d’administration et scientifiques de l’ALFEDIAM. Diabetes Metab. 1996;22:64–76. [PubMed] [Google Scholar]
- 41.RR Associates. Blood pressure and diabetes: everyone’s concern. London: British Diabetic Association; 1994. [Google Scholar]
- 42.American Diabetes Association. Standards of medical care for patients with diabetes mellitus. Diabetes Care. 1998;21(suppl):S23–S31. doi: 10.2337/diacare.17.6.616. [DOI] [PubMed] [Google Scholar]
- 43.Joint National Committee on Prevention, Detection, Evaluation and Treatment of High Blood Pressure. Sixth report. Arch Intern Med. 1997;157:2413–2446. doi: 10.1001/archinte.157.21.2413. [DOI] [PubMed] [Google Scholar]


