

Abstract
Among the known antimalarial drugs, chloroquine (CQ) and other 4-aminoquinolines have shown high potency and good bioavailability, yet complications associated with drug resistance necessitate the discovery of effective new antimalarial agents. ADMETa prediction studies were employed to evaluate a library of new molecules based on the 4-aminoquinolone-related structure of CQ. Extensive in vitro screening and in vivo pharmacokinetic studies in mice helped to identify two lead molecules, 18 and 4, with promising in vitro therapeutic efficacy, improved ADMET properties, low risk for drug-drug interactions, and desirable pharmacokinetic profiles. Both 18 and 4 are highly potent antimalarial compounds, with IC50 values = 5.6 nM and 17.3 nM, respectively, against the W2 (CQ-resistant) strain of Plasmodium falciparum (IC50 for CQ = 382 nM). When tested in mice, these compounds were found to have biological half-lives and plasma exposure values similar to or higher than those of CQ; they are therefore desirable candidates to pursue in future clinical trials.
Keywords: ADMET studies, antimalarial, 4-aminoquinolines, pharmacokinetics, toxicology
Introduction
Two primary reasons for the clinical failure of drug candidates are poor pharmacokinetic (PK) properties and poor toxicity profiles. Therefore, evaluation of critical physicochemical and pharmacological properties in the early stages of drug discovery is essential to accelerate the conversion of hits into qualified development candidates.1 Both in silico and in vitro studies are often employed to assess PK parameters, such as absorption, distribution, metabolism, elimination, and toxicology properties (ADMET), in parallel with structure-activity relationship (SAR) studies to select potential candidates early in the drug discovery process.2
Malaria, a devastating infectious disease caused by the protozoa Plasmodium falciparum, affects about 200–500 million people worldwide annually, causing mortality in almost 1% of them.3 Increasing problems associated with drug resistance warrant the discovery of effective new antimalarial agents. Although numerous small molecules demonstrating potent antimalarial activity in vitro are regularly being discovered, most of these compounds fail to reach the clinic because of poor PK and toxicity profiles. Therefore, development of suitable antimalarial agents demands that a number of ADMET considerations be evaluated, including metabolic stability, potential interactions with cytochrome P450 (CYP) enzymes, absorption across the intestinal barrier, and potential for mutagenicity.
Previously we reported on research to develop potent antimalarial compounds effective against drug-resistant strains of P. falciparum by varying the chemical substitutions around the heterocyclic ring and the basic amine side chain of the popular antimalarial drug chloroquine (CQ).4, 5 In the current study, we screened a panel of these novel antimalarial compounds for improved leads based on the evaluated ADMET properties.
Results and Discussion
Chemical Structures and Efficacy
a) Structures
A series of 4-aminoquinoline antimalarial compounds were chosen to represent the structural diversity for the series and cover a range of potencies for in vitro antimalarial activity (Figure 1). The panel includes a small number of CQ analogs with altered substitutions on the quinoline ring, although the majority of the compounds in the panel contain substitutions of the alkyl groups attached to the basic nitrogen position on the aminoalkyl side chain. The SAR for this series has revealed that structural modifications at the basic nitrogen position are important for activity against CQ-resistant strains of P. falciparum, and that a range of chemical substitutions are tolerated at this position. Therefore, it is critical to determine how the structural variations at these positions affect the ADMET properties for compounds within this series.
Figure 1.
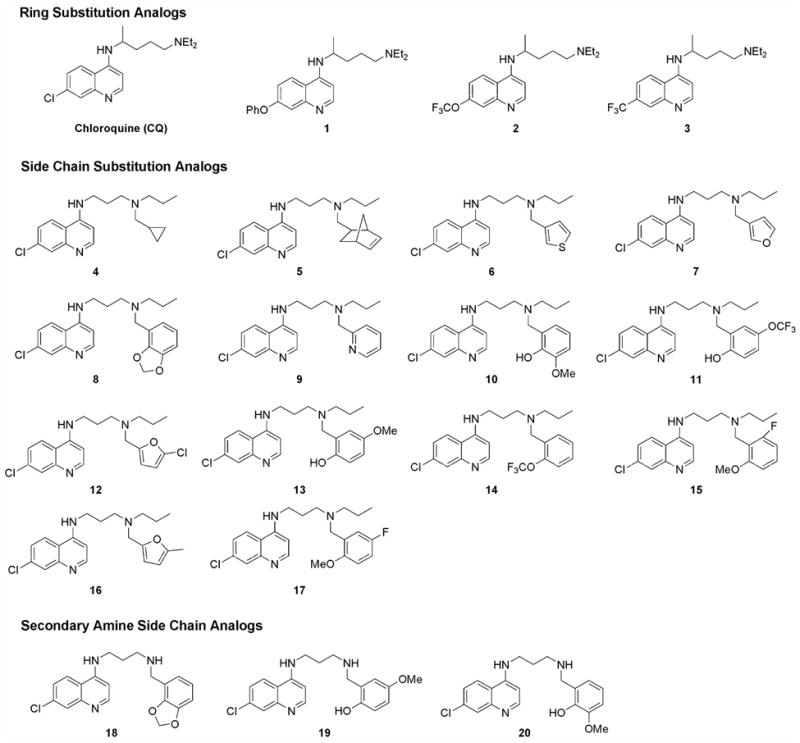
Structures of 4-aminoquinolines compounds used to profile the ADMET properties for the series.
The calculated physical properties of the compounds in this panel reveal that all of them are compliant with the Lipinski “Rule of 5” criteria6 (Table 1). Individual compounds in the panel differ significantly in their predicted permeability (ClogD), solubility, and hydrogen bonding properties, although all these characteristics are well within the acceptable “drug-like” ranges. Therefore, the results of this informative in silico analysis do not suggest that any of the compounds should be eliminated from this purely computational assessment.
Table 1.
Calculated physical properties of antimalarial compound panel.
| Compound Name | MW (g/mol) | ClogD (pH 7) | Calc. Sol.a (mM, pH 7) | H-bond Don. | H-bond Acc. | No.Lipinski Violations |
|---|---|---|---|---|---|---|
| CQ | 319.9 | 1.7 | 29 | 1 | 3 | 0 |
| 1 | 377.5 | 2.9 | 4.8 | 1 | 4 | 0 |
| 2 | 369.4 | 2.7 | 1.6 | 1 | 4 | 0 |
| 3 | 353.4 | 2.4 | 2.0 | 1 | 3 | 0 |
| 4 | 367.9 | 4.2 | 0.10 | 1 | 3 | 0 |
| 5 | 422 | 5.5 | 0.0027 | 1 | 4 | 0 |
| 6 | 412 | 3.7 | 0.17 | 1 | 4 | 0 |
| 7 | 462.8 | 4.8 | 0.042 | 2 | 4 | 0 |
| 8 | 411.9 | 4.2 | 0.037 | 1 | 5 | 0 |
| 9 | 368.9 | 3.6 | 0.15 | 1 | 4 | 0 |
| 10 | 413.9 | 3.3 | 0.30 | 2 | 5 | 0 |
| 11 | 467.9 | 4.7 | 0.0064 | 2 | 5 | 0 |
| 12 | 392.3 | 4.5 | 0.030 | 1 | 4 | 0 |
| 13 | 413.9 | 3.5 | 0.24 | 2 | 5 | 0 |
| 14 | 451.9 | 5.4 | 0.0024 | 1 | 4 | 0 |
| 15 | 415.9 | 4.7 | 0.024 | 1 | 4 | 0 |
| 16 | 371.9 | 4.2 | 0.076 | 1 | 4 | 0 |
| 17 | 415.9 | 4.5 | 0.029 | 1 | 4 | 0 |
| 18 | 369.8 | 2.1 | 0.91 | 2 | 5 | 0 |
| 19 | 371.9 | 1.4 | 4.9 | 3 | 5 | 0 |
| 20 | 371.9 | 1.3 | 6.4 | 3 | 5 | 0 |
| Overall Range | 319–468 | 1.3–5.5 | 0.0024–29 | 1–3 | 3–5 | 0 |
All calculations were performed using Advanced Chemistry Development Labs (ACD/Labs) physiochemical property prediction software. Calc. Sol = calculated solubility.
b) In Vitro Efficacy
The synthesized compounds were tested for their ability to inhibit growth of one drug-sensitive strain of P.falciparum (3D7) and one drug-resistant strain (W2). The potencies of the compounds, as indicated by their IC50 values, are summarized in Table 1. The compounds were all highly active against the 3D7 strain, with potency values in the low nanomolar range. Most were equally potent against the W2 strain at the IC50 level (Table 2).
Table 2.
Antimalarial potency of the test articles measured by (a) efficacy against the drug-resistant (W2) and drug-sensitive (3D7) strains of P. falciparum, and (b) RBC partitioning efficiency of the compounds (concentration in blood versus plasma, B/P ratio).
| Compound Name | Region of Modification | In Vitro Efficacy 3D7 IC50, nM | In Vitro Efficacy W2 IC50, nM | RBC Partitioning | |
|---|---|---|---|---|---|
| B/P, 1 μM | B/P, 10 μM | ||||
| CQ | 17 | 382 | 3.76 | 4.08 | |
| 1 | Heterocycle ring | 115 | 267 | 4.80 | 21.31 |
| 2 | Heterocycle ring | 62 | 287 | 6.12 | 6.79 |
| 3 | Heterocycle ring | 51 | 290 | 4.94 | 5.45 |
| 4 | 3°Amine Side Chain | 14.5 | 17.3 | 2.58 | 3.67 |
| 5 | 3°Amine Side Chain | 20.9 | 34.6 | 3.29 | 5.17 |
| 6 | 3°Amine Side Chain | 50 | 50 | 3.21 | 3.68 |
| 7 | 3°Amine Side Chain | 45 | 70 | 5.69 | 5.36 |
| 8 | 3°Amine Side Chain | 2.0 | 3.0 | 1.55 | 2.58 |
| 9 | 3°Amine Side Chain | 63 | 66 | 3.13 | 2.48 |
| 10 | 3°Amine Side Chain | 5.0 | 9.3 | 2.85 | 2.52 |
| 11 | 3°Amine Side Chain | 6.0 | 8.0 | 3.01 | 1.92 |
| 12 | 3°Amine Side Chain | 7.4 | 10.9 | 2.00 | 1.89 |
| 13 | 3°Amine Side Chain | 1.0 | 3.9 | 3.13 | 2.48 |
| 14 | 3°Amine Side Chain | 71 | 100 | 3.20 | 3.36 |
| 15 | 3°Amine Side Chain | 8.1 | 80 | 2.44 | 2.36 |
| 16 | 3°Amine Side Chain | 13 | 34 | 2.74 | 2.23 |
| 17 | 3°Amine Side Chain | 5.0 | 12 | 2.34 | 2.13 |
| 18 | 2°Amine Side Chain | 2.5 | 5.6 | 5.15 | 3.33 |
| 19 | 2°Amine Side Chain | 13 | 183.6 | 5.73 | 8.77 |
| 20 | 2°Amine Side Chain | 4.7 | 45.3 | 2.66 | 0.91 |
Since the in vitro screening assay involves targeting the stage of the parasite inside human red blood cells (RBCs), we hypothesized that the partitioning between human plasma and RBCs could be an essential property for antimalarial activity. The RBC to plasma partition ratio (B/P ratio) was measured for each of the compounds at concentrations of 1 and 10 μM. All the compounds partition into RBCs over plasma with ratios similar to that of CQ at 1 μM (B/P = 3.76; Table 2), but the amount of partitioning in uninfected RBCs was not significantly correlated with in vitro activity.
Mutagenicity and Cytotoxicity
Since CQ is known to intercalate with DNA at a high concentration and to behave like a weak mutagen7, 8, the compounds were screened for mutagenicity by the Ames assay.9, 10 This assay evaluates the genotoxicity of a compound by comparing its ability to induce reverse mutations at selected loci in the employed bacterial strains. In parallel, the antibacterial activity of these compounds was assessed by observing substantial decreases in the number of revertant colonies on the test plates, clearing or absence of the background bacterial lawn growth, formation of pinpoint nonrevertant colonies, or absence of bacterial growth.
None of the tested compounds showed any mutagenic activity against either the TA98 frame shift mutation or the TA100 base substitution strains, indicating that compounds in this class do not have high mutagenicity. Cytotoxic effects were observed only at high doses (≥50 μM) for all tested compounds.
Metabolic Stability
The parent compound, CQ, is primarily metabolized by N-dealkylation of the ethyl groups on its aminoalkyl side-chain. This factor prompted us to test for significant changes in the metabolism of drug candidates, a majority of which carried modifications in this region (Table 3). For the assessment of metabolic stability, each of the compounds was incubated with pooled human liver microsomes in the presence of NADPH, and the disappearance of the parent compound was analyzed by LC/MS/MS.
Table 3.
Half-lives (t1/2) of the test articles in the presence of pooled human microsomes.
| Compound | t1/2, 1 μM (min) | t1/2, 10 μM (min) |
|---|---|---|
| CQ | 749 | NCa |
| 1 | 374.7 | 255.6 |
| 2 | 116.2 | NC |
| 3 | 116.3 | 3378.5 |
| 4 | 48.2 | 108.9 |
| 5 | 13.8 | 13 |
| 6 | 12 | 17.7 |
| 7 | 11.8 | 29.3 |
| 8 | 8.5 | 29.2 |
| 9 | 7.7 | 14.1 |
| 10 | 7.5 | 37.1 |
| 11 | 6.9 | 8.7 |
| 12 | 6.9 | 8.2 |
| 13 | 6.7 | 8.2 |
| 14 | 6.4 | 29.5 |
| 15 | 6.3 | 8.8 |
| 16 | 5.6 | 38.4 |
| 17 | 5.5 | 8.6 |
| 18 | 94.8 | 276.2 |
| 19 | 147.6 | 160.8 |
| 20 | 408.4 | NC |
NC = not calculated owing to insufficient decrease in parent compound.
CQ had a longer half-life than any other compound in these assays. The ring-substituted compounds with a diethyl amino alkyl side chain—1, 2, and 3—had longer half-lives than the side chain analogs. All the side chains with substituted tertiary amines had a significantly shorter half-life (<10 min) than CQ. Since CQ is mostly modified in the side chain, modifications to the basic side chain may have had a significant effect on the metabolism of these compounds. Moreover, the structures containing an aromatic group in the side chain, such as 12, 17, 14, and 16, have much shorter half-lives. In contrast, the three secondary amines lacking the propyl group on the terminal nitrogen—18, 19, and 20—showed significantly extended half-lives.
Metabolite Identification
Since metabolic stability is essential for an effective antimalarial drug, and metabolism pathways can often be blocked by chemical modification of the substrate, LC/MS was used to identify the metabolites of the tertiary amine compounds generated during incubation with human microsomes. Figure 2 indicates the results obtained for two of these side chain-substituted compounds that showed rapid metabolism. As seen in studies with CQ11, the primary metabolites for these analogs resulted from N-dealkylation reactions of both the propyl group (N-des-Prop) and the aromatic groups (N-des-R). The shortened half-lives of the compounds with benzylic substituted nitrogens on the side chain were expected because the protons at the benzylic positions are significantly more acidic than those of an alkyl-substituted nitrogen; they are therefore more efficient in abstracting the proton α to the nitrogen, the rate-limiting step in most N-dealkylation reactions. An important observation was that the metabolites resulting from the N-dealkylation of the propyl group were at least as abundant as those obtained from removal of the benzyl group (similar trends were found for 11 and 16, as shown in supplementary data). This finding explains why we see improved metabolic stability in compounds 18, 19, and 20 after the propyl group is removed. Another important finding was that the methoxy group in 8 and the methylene group in 10, which give these compounds their strong antimalarial activity, are metabolically labile (“-methylene-” = 23.9% of the metabolites in the case of 8 and “o-desmethyl” = 9.4% of the metabolites in the case of 10).
Figure 2.
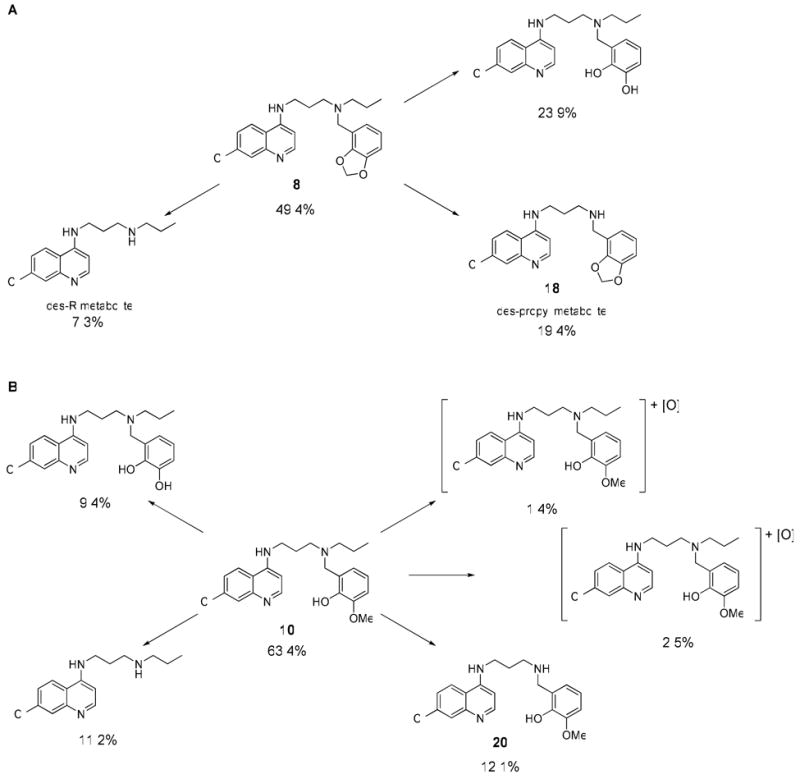
Relative percentages of metabolites for 8 (A) and 10 (B) identified by LC/MS after incubation with pooled human microsomes.
Cytochrome P450 Inhibition
Antimalarial drugs are often administered concurrently with other therapies. For example, in the African subcontinent, antimalarial treatment is often confounded by the presence of HIV infection in the same patient. Under these conditions, antimalarial compounds are often co-administered with antiretroviral drugs. Thus, a drug-drug interaction with a co-administered drug might alter the pharmacokinetics of the test compound, or vice versa. This effect is most often the result of drug-induced induction or inhibition of CYP enzymes.12 Induction of specific P450 enzymes may alter the metabolic profile of a drug either by increasing metabolism or by creating an alternative pathway of metabolism. These changes can have profound effects on the pharmacology and toxicology of drugs. Since inhibition of CYP enzymes can have significant effects on the safety profile of drugs that are co-administered, the U.S. Food and Drug Administration recommends that potential drug-drug interactions of any new chemical entity be investigated prior to regulatory submission. For example, the classic antimalarial drugs quinine and quinidine are known to be potent inhibitors of the CYP2D6 enzyme.13 CQ is also known to inhibit CYP2D6 activity significantly.14 CYP2D6 is an important member of the human CYP group of enzymes. It is estimated that CYP2D6 metabolizes nearly 25% of the drugs commonly used today.15 Studies in the past have shown that co-administration of CQ can increase the levels or effects of CYP2D6 substrates, such as selected beta-blockers like metoprolol16, antiretroviral agents like indinavir17, and the antischizophrenic drug thioridazine.18
To evaluate potential drug-drug interactions early in the antimalarial drug development process, we analyzed the inhibitory effect of our CQ analogs on a panel of four common P450 isoforms. In this assay, human liver microsomes were incubated with a test article and a cocktail of specific P450 substrates for each enzyme. The known major metabolites of the substrates were subsequently quantified by LC/MS/MS to compute the percentage of inhibition due to the test compound in comparison to the percentage in no drug treated controls. As a rule of thumb, enzyme activity levels <70% of the level observed for the untreated controls were considered to be significant inhibition.
As expected, the majority of the compounds inhibited the CYP2D6 enzyme. As shown in Figure 3 and Table 4, compounds 5, 6, 7, 10, 12, 14, and 16 showed approximately 40% inhibition of CYP2D6 activity even at a concentration of 1 μM. The most potent inhibitor was 8, which showed 77% inhibition at 1 μM. The secondary amine versions of compounds 8, 10, and 16 (18, 20, and 19, respectively) were found to be much less powerful inhibitors of CYP2D6. This difference probably indicates reduced binding to the CYPs and explains why the secondary amines tend to have longer half-lives than their tertiary-amine counterparts.
Figure 3.
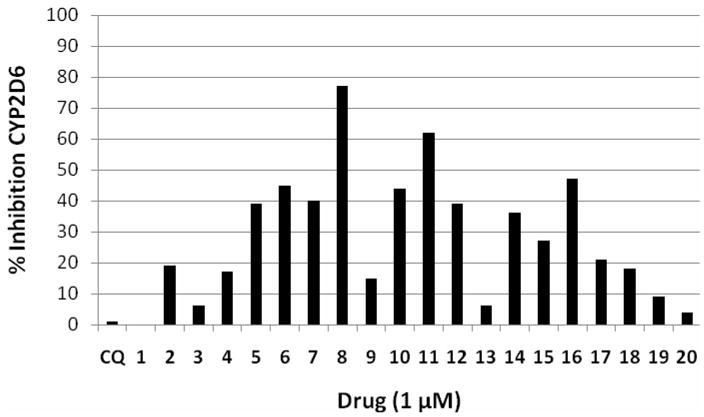
Inhibition of CYP2D6 enzyme activity by the test articles. Graph shows the amount of the metabolite 1′-OH-bufuralol produced in the presence of each test article (1 μM) as a percentage of control (no drug). Values <70% indicate significant inhibition.
Table 4.
Inhibition of cytochrome P450 isoforms by the test articles at 1 and 10 μM. Data expressed as percent metabolism of known substrates for each isoform compared to control.a
| Name | CYP Inhibition (metabolite produced as a percent of control) | |||||||||||
|---|---|---|---|---|---|---|---|---|---|---|---|---|
| CYP2B6 | CYP2C9 | CYP2C19 | CYP2D6 | CYP3A4a | CYP3A4b | |||||||
| 1 μM | 10 μM | 1 μM | 10 μM | 1 μM | 10 μM | 1 μM | 10 μM | 1 μM | 10 μM | 1 μM | 10 μM | |
| CQ | 112 | 134 | 114 | 128 | 113 | 111 | 99 | 90 | 105 | 110 | 102 | 106 |
| 1 | 119 | 118 | 118 | 115 | 120 | 126 | 101 | 72 | 114 | 125 | 102 | 125 |
| 2 | 99 | 109 | 105 | 145 | 109 | 115 | 81 | 57 | 107 | 120 | 108 | 120 |
| 3 | 97 | 121 | 103 | 126 | 93 | 107 | 94 | 94 | 94 | 111 | 96 | 113 |
| 4 | 95 | 112 | 102 | 121 | 107 | 115 | 83 | 63 | 101 | 108 | 103 | 105 |
| 5 | 108 | 107 | 109 | 73 | 104 | 114 | 61 | 13 | 89 | 30 | 76 | 26 |
| 6 | 98 | 117 | 98 | 96 | 104 | 120 | 55 | 22 | 103 | 92 | 102 | 82 |
| 7 | 111 | 108 | 113 | 104 | 97 | 108 | 60 | 15 | 101 | 94 | 99 | 89 |
| 8 | 114 | 115 | 119 | 122 | 117 | 136 | 23 | 8 | 109 | 96 | 107 | 84 |
| 9 | 104 | 117 | 107 | 108 | 108 | 110 | 85 | 49 | 108 | 85 | 102 | 89 |
| 10 | 96 | 113 | 97 | 106 | 103 | 119 | 56 | 15 | 103 | 85 | 94 | 57 |
| 11 | 98 | 114 | 96 | 79 | 108 | 107 | 98 | 10 | 97 | 63 | 80 | 39 |
| 12 | 96 | 100 | 98 | 79 | 90 | 102 | 61 | 13 | 90 | 69 | 87 | 75 |
| 13 | 108 | 128 | 107 | 128 | 110 | 113 | 94 | 87 | 105 | 102 | 102 | 88 |
| 14 | 98 | 113 | 93 | 63 | 107 | 115 | 64 | 17 | 101 | 68 | 92 | 53 |
| 15 | 106 | 109 | 104 | 100 | 104 | 127 | 73 | 20 | 100 | 82 | 99 | 87 |
| 16 | 94 | 107 | 85 | 46 | 101 | 106 | 53 | 11 | 97 | 57 | 89 | 46 |
| 17 | 99 | 110 | 102 | 93 | 94 | 123 | 79 | 4 | 89 | 66 | 84 | 62 |
| 18 | 94 | 112 | 98 | 115 | 104 | 121 | 76 | 29 | 99 | 66 | 96 | 70 |
| 19 | 103 | 98 | 102 | 102 | 100 | 119 | 91 | 56 | 101 | 102 | 103 | 90 |
| 20 | 105 | 105 | 108 | 108 | 113 | 122 | 96 | 69 | 106 | 108 | 108 | 97 |
The known substrates are as follows: CYP2B6 (bupropion 25 μM), CYP2C9 (diclofenac 10 μM), CYP2C19 (mephenytoin 50 μM), CYP2D6 (bufuralol 10 μM), CYP3A4a (midazolam 4μM), and CYP3A4b (testosterone 50 μM). Values <70% are considered to be significant inhibition.
A few of the compounds—specifically 5, 10, 11, and 16—also somewhat inhibited the CYP3A4 enzyme at the highest concentration tested (10 μM). Among the 21 compounds tested, 4—compounds 1, 3, 13, and 20—did not significantly inhibit any of the CYP isoforms at either of the tested concentrations.
Absorption
Oral administration is the desired route for the delivery of antimalarial compounds because it maximizes patient compliance and reduces ancillary care costs. In many impoverished countries, it is the only practical means of delivering drugs. For drugs administered orally, the intestinal membrane often poses the first barrier to systemic exposure. Thus, it is useful to evaluate the absorption of a molecule across the intestinal barrier before it can be considered as a potential lead candidate.
The parallel artificial membrane permeation assay (PAMPA) method uses phospholipid-coated filters to estimate membrane permeability. These assays are highly reproducible and amenable for high throughput, although they can be misleading owing to the lack of metabolizing enzymes and transporters, and modeling of paracellular absorption. The method is useful nevertheless because it has the ability to assess the permeability coefficient (Pe) at a wide range of pH levels, and pH is often an important factor in drug absorption.
Based on a combination of the antimalarial activity data and the earlier ADMET evaluations, we identified five major compounds as possible candidates for clinical applications (1, 3, 4, 18, and 20). We used a Double-sink PAMPA protocol to evaluate their permeability across the gut wall (Table 4). All the candidates had permeability equal to or better than that of our parent compound, CQ. Of the five tested compounds, 3 and 18 had the highest permeability at pH 7.4. Permeability declined sharply at lower pH values, indicating that greater absorption would be expected in the lower gut than in other parts of the digestive tract.
Hepatotoxicity
Numerous studies have reported hepatotoxicity resulting from use of CQ.19, 20 Therefore, we decided to screen our five lead candidates for any potential hepatotoxicity in our final stage of ADMET screening (Figures 4a and 4b). Two independent methods were used to assess hepatotoxicity: (a) measurement of the percentage of lactate dehydrogenase (LDH) released to the medium21, and (b) the MTT assay, which measures the amount of formazan formed by mitochondrial dehydrogenase activity in viable cells on 3-[4,5-dimethylthiazol-2-yl]-2,5-diphenyl tetrazolium (MTT).22 Compounds at concentrations of 10 μM, 100 μM, and 500 μM were tested on isolated rat hepatocytes. The results are presented in Figure 4a (MTT) and 4b (LDH). The cytotoxicity profiles for all tested compounds were almost identical in both the MTT assay and the LDH assay. The parent compound, CQ, had minimal cytotoxicity at lower doses but considerable toxicity at higher doses (TC50 = 50 μM for MTT and 77 μM for LDH). Among the test compounds, 3 was minimally toxic (TC50 = 74 μM for MTT and 135 μM for LDH), and 18 was highly toxic (TC50 = 7.5 μM for MTT and 10 μM for LDH). The MTT assay showed high toxicity for compound 1 (TC50 < 10 μM), but the compound was only moderately cytotoxic in the LDH assay (TC50 = 40 μM). Compounds 20 and 4 have almost identical cytotoxicity profiles (TC50 values ∼40 μM for MTT and 30 μM for LDH) that are nearly as good as that of CQ. Note, however, that compound 18 is an extremely potent antimalarial agent (Table 2) with an IC50 value <10 nM, and thus it might never be administered in vivo at dose levels as high as those used in these cytotoxicity assays. At concentrations above 100 μM, all the compounds were significantly cytotoxic. These results with isolated rat hepatocytes were similar to those obtained with multiple immortalized cell lines, including HEK-293, HepG2, BJ, and Raji.
Figure 4.
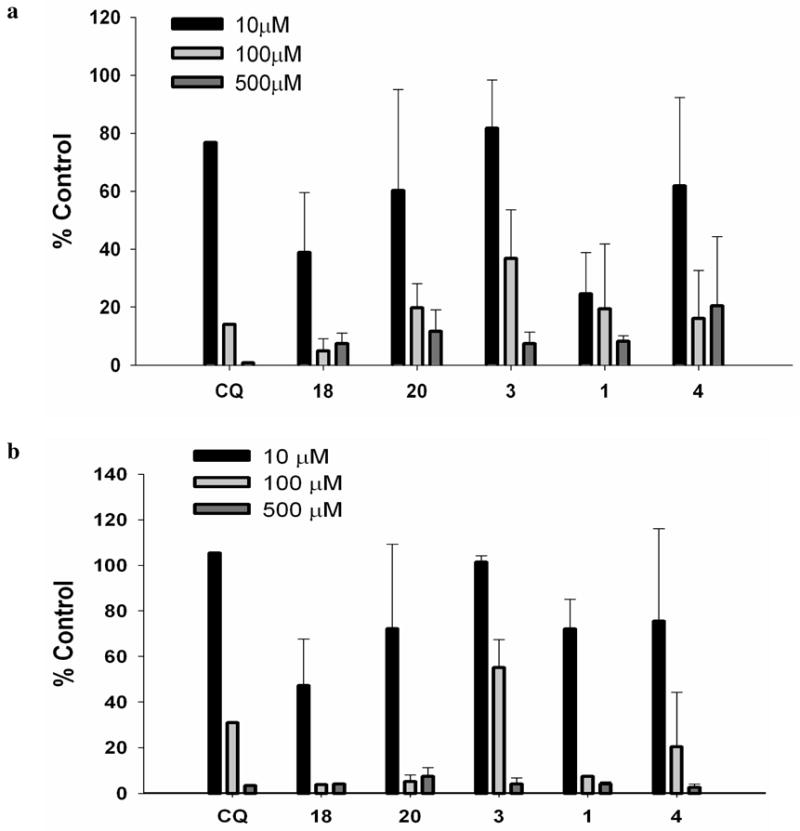
Cytotoxic effects of the compounds on isolated rat hepatocytes. (a) MTT assay, (b) LDH assay
Pharmacokinetic Parameters Evaluated in Mice
Based on the in vitro ADMET studies, compounds 1, 4, 18, and 20 were selected for PK profiling in mice. As shown in Figure 5 and Table 5, the plasma concentration profile of a single oral dose of the secondary amine 18 (AUClast 2026.66 pmole*h/ml) is similar to that of CQ (AUClast 2639.29 pmole*h/ml), except that the maximum plasma concentration (Cmax) for 18 is about two-fold lower than that of CQ. In contrast, the plasma exposure of the other secondary amine, compound 20, was much lower (AUClast 620.49 pmole*h/ml and Cmax 65.9 nM). The PK profile of compound 4 looks quite promising. Compared to CQ, compound 4 offered a longer period of exposure to the drug (t1/2 15.9 h), a much higher exposure level (AUClast 6792.4 pmole*h/ml), and a similar Cmax. Compound 1 had the shortest half-life; its concentration in the plasma dropped below 11.8 nM within 24 h. The relative bioavailability (Frel) of each of the candidates was calculated using CQ as the reference drug. As expected, compound 18, Frel 0.7, is bioequivalent with CQ. Compound 4, Frel 2.34, appears to have a better PK profile than CQ and all the other candidates tested.
Figure 5.
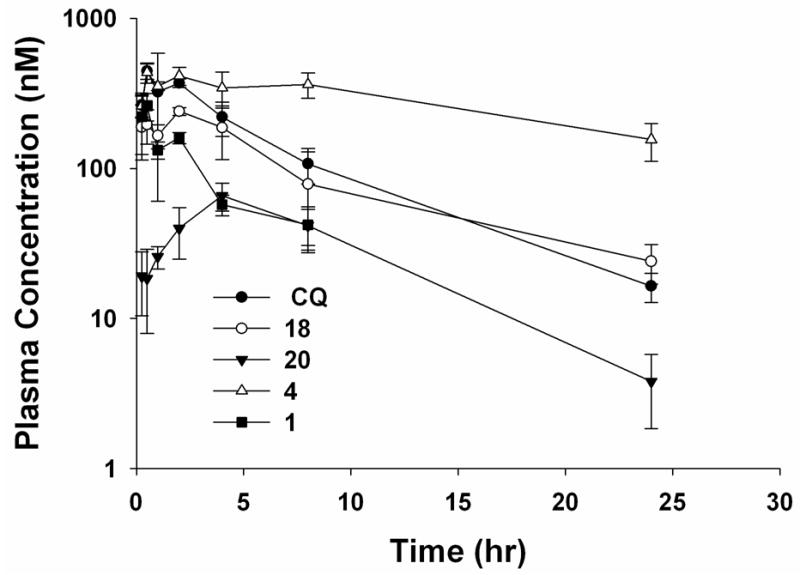
Plasma drug concentration in male CD-1 mice after a single oral dose at 50 mg/kg.
Table 5.
PAMPA permeability measurements (Pe, × 10-6 cm/s) across three pH conditions.a
| Compound name | pH 7.4/7.4 sink | pH 6.2/7.4 sink | pH 5.0/7.4 sink |
|---|---|---|---|
| CQ | 775±195 | 51±1 | 0.5±1 |
| 1 | 1858±499 | 125±78 | 4±1 |
| 3 | 2704±107 | 235±8 | 2±2 |
| 4 | 1109±176 | 2±0 | 0±0 |
| 18 | 2400±652 | 979±129 | 19±6 |
| 20 | 1363±214 | 4±1 | 0±0 |
Values are mean ± SD across n ≥ 2 samples.
Toxicity Studies in Mice
Toxicity studies were performed in male and female CD-1 mice to determine potential adverse effects and maximum tolerated dose (MTD) for two secondary amines, compounds 18 and 20, which had quite different in vitro hepatotoxicity profiles. Both male and female CD-1 mice (n = 5/sex/dose group) were treated for 7 days with compound 18 at 50, 100, or 200 mg/kg/day or with compound 20 at 100, 200, or 400 mg/kg/day. All mice survived until the end of the study except one male mouse administered compound 18 at 200 mg/kg/day, which was found dead on Day 2. All treated groups showed sporadic tachycardia. The body weights of all treated mice remained normal for the duration of the study when compared to the vehicle-treated controls. No biologically significant changes in clinical pathology were observed on Day 8, and histopathology revealed no findings related to the administration of the test articles. Reductions in absolute liver weight and liver-to-body-weight ratios were observed after treatment with compound 20 at various dose levels. Although these findings suggest a possible effect of compound 20 on the liver, the absence of hepatic effects in both serum clinical chemistry and histopathologic evaluations of the liver suggests that this effect is of minimal toxicological significance. The MTDs in mice are estimated to be 100 mg/kg/day for compound 18 and 400 mg/kg/day for compound 20 administered by oral gavage for 7 days.
Designing a Progression Decision Matrix to Select Leads
The Medicines for Malaria Venture (MMV, www.mmv.org) is a public-private partnership dedicated to delivering effective antimalarial treatment to future generations. To improve the success rate of antimalarial drug development, MMV now recommends a suitable product profile for all antimalarial drugs against uncomplicated malaria caused by P. falciparum in adults and children.23 Based on the MMV guidelines and current ADMET data for these 4-aminoquinolines, we have derived a compound progression decision matrix to guide the development of a new antimalarial drug that will conform with the desired product profile (Table 7) recommended by the MMV. Among all the candidates tested in our research, compounds 4 and 18 were well matched with this profile and should be promising leads for further development.
Table 7.
Efficacy and ADMET parameters for the development of a treatment for uncomplicated malaria caused by Plasmodium falciparum in adults and children.
| Parameter | Minimum Essential | Ideal | Compound 18 | Compound 4 |
|---|---|---|---|---|
| In silico profiling, Lipinski “Rule of 5” violations | <2 | 0 | 0 | 0 |
| In vitro potency (IC50, nM, W2 strain) | <2000 | <100 | 5.6 | 17.3 |
| Bacterial mutagenicity, AMES test | <3-fold increase in mutagenicity | no increase in mutagenicity | no increase in mutagenicity | no increase in mutagenicity |
| Metabolic stability, t½ human microsomes | >0.5 h | >4 h | 1.5 h (1 μM), 4.6 h (10 μM) | 0.80 h (1 μM), 1.8 h (10 μM) |
| Permeability, PAMPA pH 7.4/7.4sink | >100 × 10-6 cm/s | >1000 × 10-6 cm/s | 2400 × 10-6 cm/s | 1109 × 10-6 cm/s |
| In vitro P450 inhibition (inhibition of CYP isoforms at 1μM concentration) | Only CYP2D6 | none | none significant | none significant |
| Cytotoxicity, primary rat hepatocytes, ratio TC50 to IC50 W2 | >20 | >100 | 1340 | 2313 |
| t1/2 (h, rodent) | >2 | >8 | 6.8 | 15.9 |
| Cmax (nM, rodent) | >80 | >200 | 240 | 436 |
| AUC (nmoles*h/L, rodent) | >300 | >1000 | 2026 | 6792 |
Conclusion
In conclusion, our ADMET studies allowed us to evaluate a set of antimalarial lead compounds and assess the parameters that will be essential for further lead optimization efforts. A combination of in silico, in vitro, and in vivo ADMET assays were used to establish efficacy and ADMET parameters for the selection of a preclinical development candidate. The in silico evaluation confirmed that the compounds had “drug-like” properties, but did not give information of sufficient value to discriminate between compounds. The in vitro predictive ADMET assays revealed important differences in permeability and metabolic stability that must be measured during lead optimization efforts to maximize compound efficacy. These in vitro studies indicated that conversion of the side chain of CQ to a secondary amine created more potent antimalarial candidates with improved PK profiles. Finally, the in vivo PK studies in mice helped us to identify two potential drug candidates with potent in vitro activity against CQ-resistant P. falciparum along with acceptable PK properties. Future lead optimization efforts are warranted to produce a fully optimized antimalarial drug candidate ready for preclinical development studies.
Experimental Section
General
All reagents and starting materials were purchased from commercial sources and used without further purification. 1H and 13C NMR were recorded on the Varian Utility 400 MHz spectrometer, in CDCl3, CD3OD, or DMSO-d6 solvent. Chemical shifts were reported as parts per million (ppm) downfield from an internal tetramethylsilane (TMS) standard (δ = 0.0 for 1H NMR) or from solvent reference. Coupling constants (J values) were measured in hertz (Hz). Electrospray mass spectra (ES-MS) were collected on a Waters ZQ 4000 mass spectrometer. Purity was assessed using by HPLC using an Xterra reversed-phase C18 column (4.6 mm × 20 mm, 3 μm) running a binary gradient with water (with 0.05% TFA) and methanol (with 0.05% TFA) from 0 – 100% methanol over 20 minutes. All compounds were confirmed to be ≥ 95% purity.
Chemical Synthesis
Synthesis of Ring Substituted 4-Aminoquinolines
Synthesis of 1, 2, and 3 has previously been described (Madrid et al.5).
Synthesis of Side-Chain Substituted Tertiary Amines
Synthesis of 4, 5, 6, and 7 has previously been described (Madrid et al.24). Synthesis of 9, 10, 17, 8, 12, 15, 14, 11, 13, and 16 has also been previously published (Madrid et al.4).
Synthesis of Side-Chain Substituted Secondary Amines
General Procedure for Reductive Alkylation
A stock solution of N1-(7-chloro-quinolin-4-yl)-propane-1,3-diamine was made in dry MeOH, and 1.5 mL (0.04 mmol) was aliquoted to the wells of a 48-well reaction block. An aldehyde was then added to each well (0.17 mmol, 4 eq.), and care was taken to reduce exposure to moisture in the air. The reaction block was sealed with a rubber gasket and shaken for 16 h at 300 rpm. Then sodium borohydride was added to each well (6.4 mg, 0.17 mmol). CAUTION: explosion hazard. After bubbling had ceased, the solution remaining in each well was transferred into another 48-position reaction block containing cartridges loaded with SCX-SPE medium. Each well was washed with 1% TFA in MeOH (1 mL, 2×) and MeOH (2 mL, 2×), and eluted with 5% TEA in MeOH (2 mL, 2×). The eluted products were collected into glass test tubes, and solvent was removed on a GeneVac HT-4 (10 mbar, 4.0 h, 35 °C). The partly purified products were then dissolved in saturated HCl/MeOH (1 mL) and dried again to form the HCl salts of each compound. Each dry HCl salt was then dissolved in 1 mL d6-DMSO and subjected to LC/MS/CLND for analysis of purity, identity, and yield. A 10 mM stock solution of each compound was made in d6-DMSO based on the CLND quantitation data, and compounds were analyzed by 1H-NMR and LC/MS.
2-{[3-(7-Chloro-quinolin-4-ylamino)-propylamino]-methyl}-6-methoxy-phenol (20) 68% yield; 100% pure by HPLC; LCMS (ESI) m/z Calcd for C20H22ClN3O2 [M + H]+ 372.14. Found: 372.49. 1H NMR (400 MHz, d4-MeOD): δ 8.38, (d, J = 6.4, 1H), 8.17 (d, J = 9.2, 1H), 7.81 (d, J =2.0, 1H), 7.50 (dd, J = 9.2, 2.0, 1H), 6.96 (dd, J = 7.6, 1.2, 1H), 6.86 (dd, J = 7.6, 1.2, 1H), 6.79 (t, J = 7.6, 1H), 6.67 (d, J = 6.4, 1H), 4.19 (s, 2H), 3.83 (s, 3H), 3.56 (t, J = 6.4, 2H), 3.14 (t, J = 7.2, 2H), 2.13 (m, 2H).
2-{[3-(7-Chloro-quinolin-4-ylamino)-propylamino]-methyl}-4-methoxy-phenol (19) 46% yield; 100% pure by HPLC; LCMS (ESI) m/z Calcd for C20H22ClN3O2 [M + H]+ 372.14. Found: 372.48. 1H NMR (400 MHz, d4-MeOD): δ 8.43, (m, 2H), 7.91 (d, J =2.0, 1H), 7.71 (dd, J = 9.2, 2.0, 1H), 6.92 (m, 2H), 6.81 (m, 2H), 4.20 (s, 2H), 3.71 (s, 3H), 2.21 (m, 2H).
N-Benzo[1,3]dioxol-4-ylmethyl-N′-(7-chloro-quinolin-4-yl)-propane-1,3-diamine (18) 82% yield; 100% pure by HPLC; LCMS (ESI) m/z Calcd for C20H20ClN3O2 [M + H]+ 370.12. Found: 370.47. 1H NMR (400 MHz, d6-DMSO): δ 8.31, (d, J = 6.4, 1H), 7.97 (d, J = 9.2, 1H), 7.74 (d, J =2.0, 1H), 7.32 (dd, J = 9.2, 2.0, 1H), 6.72-6.82 (m, 3H), 6.50 (d, J = 6.4, 1H), 5.86 (s, 2H), 3.83 (s, 2H), 3.42 (t, J = 6.4, 2H), 3.28 (t, J = 7.2, 2H), 2.84 (t, J = 6.8, 2H), 1.97 (m, 2H).
Screening for Antimalarial Activity
Compounds were screened for growth inhibition activity against P. falciparum using a fluorescent-activated cell sorting (FACS) assay described previously.24 Briefly, the test articles were screened at two concentrations (30 nM and 200 nM) against both a drug-sensitive strain, 3D7, and a highly drug-resistant strain, W2. All screening was done in triplicate, with no drug and nonactive 4-amino-7-chloroquinoline-treated cultures as negative controls and CQ as a positive control. IC50 values were estimated by analyzing the resulting log dose-response curves by visual extrapolation.
RBC Partitioning Experiment
Heparinized rat whole blood was collected and centrifuged at 1000 g for 5 min and then at 3000 g for 15 min to obtain the reference plasma. Aliquots of fresh whole blood and reference plasma were spiked with the test articles at 0–10 μM (spiking solution used PBS with 10% methanol) and incubated at 37 °C for 30 min, with shaking. All concentrations were produced in triplicate. Standards were prepared similarly. After incubation, the whole blood samples were centrifuged as before, and the supernatant (plasma) was collected from the red blood cells into microfuge tubes and stored on ice. Aliquots (100 μl) of the plasma obtained from the whole blood and the reference plasma were then diluted with 400 μl of acetonitrile, vortexed, centrifuged at 14000 rpm for 5 min, and analyzed by LC-MS/MS. The analyte peak areas obtained from LC-MS analysis were used to calculate the RBC-to-plasma partitioning ratio (B/P) using the following equation:
Where
H= hematocrit or percentage of total blood cells in whole blood sample (v/v)
CRefPlasma= Concentration in reference plasma
CPlasmaWB = Concentration in plasma obtained from whole blood.
AMES Assay for Mutagenicity and Cytotoxicity Screening
The microbial mutagenicity screening or Ames assay of the test articles was performed using the plate incorporation method with Salmonella typhimurium tester strains TA98 and TA100, in the presence and absence of an Aroclor 1254 induced rat liver metabolic activation system containing 10% S-9 (MA).
The test articles were assessed for mutagenicity with Salmonella tester strains TA98 and TA100 (Dr. Bruce Ames, University of California, Berkeley), in the presence and in the absence of a rat liver metabolic activation system, S-9 (Molecular Toxicology, Inc., Boone, NC), using two plates per dose level, over a wide range of doses. Frozen tester strains were inoculated into 50 ml Oxoid Nutrient Broth No. 2 (CM 67), allowed to sit unshaken for 2 to 4 h, then gently shaken (100 rpm) for about 11 to 14 h at 37 °C. To start the assay, 2 ml of molten top agar, 0.1 ml of tester organisms (about 108 bacteria), 0.5 ml of metabolic activation mixture (10% of Aroclor-1254 induced rat liver S9, 8 mM MgCl2, 33 mM KCl, 5 mM Glucose-6-phosphate, 4 mM NADP, and 0.2 M of 50% sodium phosphate buffer, pH 7.4), and appropriate amounts of the test articles (doses of 5, 10, 50, 100, 500, 1000, and 2000 μg/plate) were added to sterile 13 × 100 mm test tubes and placed in a 43 °C heating block. The mixture was stirred gently, poured onto plates containing about 25 ml of minimal glucose agar, and incubated at ∼37 °C for about 48 h. The revertant colonies were counted after the incubation period. Appropriate sterility, solvent (zero dose), and positive control tests were also performed in parallel.
Metabolic Stability Studies and Metabolite Identification
Test articles were incubated at 37 °C with pooled human liver microsomes (BD-Gentest, BD-Biosciences, Woburn, MA) at two concentrations (1 and 10 μM). The incubation mix consisted of test articles (1 or 10 μM), 0.2 mg/ml human microsomal protein, 2.5 mM NADPH, and 3.3 mM MgCl2 in 100 mM phosphate buffer, pH 7.4. All incubations were performed in triplicate. Reactions were stopped at the end of incubation by the addition of cold acetonitrile (1× volume of reaction). The rate of loss of parent compound was determined at 0, 15, 30, and 60 min by LC-MS/MS analysis. The amount of compound in the samples was expressed as a percentage of remaining compound compared to time point zero (100%). The slope (-k) of the linear regression from ln[test compound] versus time plot was determined, and t1/2 was calculated from the equation k = ln 2/t1/2.
For metabolite identification, samples were prepared in duplicate by incubating each test article with human microsomes at a concentration of 10 μM for 15 min. Incubations without any test article generated samples that served as the negative control. Sample analysis was performed by LC-MS/MS using a Waters 2795 HPLC with a Waters 996 photodiode array detector coupled to a Waters Micromass Quattro Ultima triple-quadrupole mass spectrometer. Samples were chromatographed on a Luna C18(2), 250 × 4.6 mm, 5 μm column at a flow rate of 1.0 ml/min using a 30 min multistep gradient elution and a 3:7 fixed-ratio flow splitter so that 30% of the postcolumn flow was diverted to the in-line PDA and MS detectors. The HPLC mobile phase was 0.1% formic acid in water (A) and 0.1% formic acid in acetonitrile (B), and the gradient ranged from 0% to 90% B. The mass spectrometer was operated in precursor-ion scan (full-scan) positive-ion electrospray ionization mode, and was optimized for detection of [M+H]+ molecular ions. Samples were evaluated for the presence of metabolite masses (both expected and unexpected) not detected in the controls.
CYP Inhibition Studies
All substrates and co-factors were purchased from Sigma-Aldrich, St Louis, MO. The inhibitory activity of the test articles at 1 and 10 μM was tested on various CYPs in pooled human liver microsomes (HLMs) (BD-Gentest). The compounds were incubated at 37 °C for 20 min with HLMs (0.2 mg/ml) and a substrate cocktail consisting of 25 μM phenacetin (CYP1A2), 25 μM bupropion (CYP2B6), 10 μM diclofenac (CYP2C9), 50 μM mephenytoin (CYP2C19), 10 μM bufuralol (CYP2D6), 50 μM testosterone (CYP3A4), and 4 μM midazolam (CYP3A4) and co-factors, along with 2.5 mM NADPH/3.3mM MgCl2 in 100 mM phosphate buffer, pH 7.4. Positive control incubations containing known inhibitors of the CYPs of interest were also included. Samples were analyzed by LC-MS/MS. Inhibition of each test article was reported as a percentage of the activity obtained with the no drug control.
Parallel Artificial Membrane Permeability Assay
All materials used for the PAMPA assay were purchased from pION Inc, Woburn, MA. In PAMPA, a “sandwich” is formed between a 96-well microtiter plate loaded with magnetic star discs and a 96-well filter plate (P/N 110212) so that each composite well is divided into two chambers (donor at the bottom and acceptor at the top), separated by a 125 μm microfilter disc coated with the GIT-0 lipid solution (P/N 110669). Stock solutions of the test compounds in DMSO were added to the buffered donor solutions (P/N110158) at pH levels of 5.0, 6.2, and 7.4, to obtain a final concentration of 50 μM; the acceptor wells contained the acceptor buffer at pH 7.4 (P/N 11039). The sandwich was formed and allowed to incubate, with stirring, for 30 min at 40 μM aqueous boundary layer (ABL) in the Gut-box™ (P/N 110205); humidity was held constant to prevent evaporation. The sandwich was then separated, and both the donor and acceptor compartments were scanned for absorbance in the UV range (250–500 nm) by a spectrophotometer (SPECTRAmax 190, Molecular Devices, Sunnyvale, CA). The permeability co-efficient or Pe (cm/s) values were calculated using the PAMPA Explorer Command Software (version 3.3) obtained from pION Inc. All assays were carried out in four separate wells for each pH condition tested, and the results were reported as mean ± SD.
Cytotoxicity Studies with Rat Hepatocytes
All assays were performed on freshly isolated hepatocytes from 11-week-old male Sprague Dawley Rats (Charles Rivers Laboratories). The procedure for hepatocyte isolation has been previously described.25
MTT assay
For the MTT assay, freshly isolated rat hepatocytes were added to 96-well Biocoat plates (BD Biosciences, San Jose, CA) at 20,000 cells per well. The hepatocytes were allowed to attach for approximately 2 h. After attachment, the medium was removed along with any unattached cells, and medium containing the test article (10, 100, and 500 μM) was added in triplicate. The cells were incubated for 20–24 h. The medium containing the test article was removed, and the cells were rinsed with warm medium. The MTT assay was performed using the In Vitro Toxicology Assay Kit (TOX-1, Sigma, St. Louis, MO) according to the manufacturer's instructions, except for minor modifications. Briefly, MTT solution was reconstituted with medium without phenol red and serum, and returned to the 37 °C incubator for 3–4 h. At the end of the incubation period, the tetrazolium ring was cleaved by the mitochondrial dehydrogenase to form the MTT formazan crystals that are solubilized in acidified isopropanol. The absorbance of the purple solution is measured spectrophotometrically at 570 nm. The background absorbance measured at 690 nm is subtracted from this value to obtain the final reading. The results are expressed as a percentage of the absorbance obtained in the control wells, which had cells treated with medium only (no test article).
LDH assay
LDH activity of treated cells was measured by the LDH assay kit (TOX-7, Sigma) according to the manufacturer's instructions, except for minor modifications. Briefly, freshly isolated hepatocytes were plated, treated with test articles as before, and incubated for 20–24 h. After incubation, the cells were rinsed with PBS, lysed with 1/10 volume of lysis solution, incubated at 37 °C for 45 min, and centrifuged to collect the supernatant. The supernatant was then diluted 5× by PBS. Diluted supernatant was then mixed with equal volumes of the LDH assay mixture and incubated at room temperature for 20 min protected from light. Finally incubation was terminated by the addition of 1/10 volume of 1 N HCl, and the absorbance esd measured spectrophotometrically at 490 nm. The background absorbance measured at 690 nm was subtracted from the reading at 490 nm to obtain the final reading. The results were expressed as a percentage of the absorbance obtained in the control wells that had cells treated with medium only (no test article).
Pharmacokinetic studies in male CD1 mice
All animal studies were carried out in accordance with SRI International's animal care policies. Male CD-1 mice were purchased from Charles Rivers Laboratories. The plasma pharmacokinetics of CQ and of compounds 18, 183, and 4 were determined in male CD-1 mice following administration of a single dose (50 mg/kg, n = 3) by oral gavage. The vehicle used for CQ and compound 4 was 0.9% saline. Compounds 18 and 20 were administered in 5% DMSO and 95% PEG300. For the PK studies, 0.6 ml of blood was collected from 3 mice per test article and time point at 15, 30, and 60 min and 2, 4, 8, 10, 24, and 48 h after dose administration. All blood samples were collected from the retro-orbital sinus under isoflurane anesthesia, then placed in tubes with EDTA. After collection, blood was processed to plasma by centrifugation at 2000 rpm for 10–20 min, and samples were analyzed by LC-MS/MS. PK parameters, including area under the plasma drug concentration versus time curve (AUC0-t), maximum plasma drug concentration (Cmax), time to maximum concentration (Tmax), and elimination half-life (t1/2), were determined using the WinNonlin Professional software (Pharsight Corporation, Mountain View, CA).
Dose range-finding toxicity studies in male and female CD-1 mice
Male and female CD-1 mice (6–8 weeks, Charles River Laboratories) were given once daily oral doses of of compound 18 at 50, 100, or 200 mg/kg or of compound 20 at 100, 200, and 400 mg/kg for 7 days (n = 5/sex/dose group). An appropriate amount of test article was suspended in 5% DMSO: 95% PEG 300 v/v on the day of dosing. The control group consisted of vehicle-treated animals. Body weights were checked prior to dose administration, on day 4, and prior to necropsy on day 8. Blood for clinical pathology evaluation was collected on day 8 from the retro-orbital sinus and processed for complete hematology and serum chemistry parameters (e.g., glucose, alkaline phosphatase, alanine aminotransferase, blood urea nitrogen, aspartate aminotransferase, total protein, albumin, calcium, phosphorus, cholesterol, triglycerides, total bilirubin, creatinine, globulin, sodium). On the final day, tissues were collected and retained in 10% neutral buffered formalin for histopathology. Toxicology parameters (body weight, clinical pathology, and organ weight data) were computed as mean ± SD using the LABCAT In-life software, version 6.2. All data were statistically analyzed by one-way ANOVA and a post hoc Dunnett's t-test).
Scheme 1.
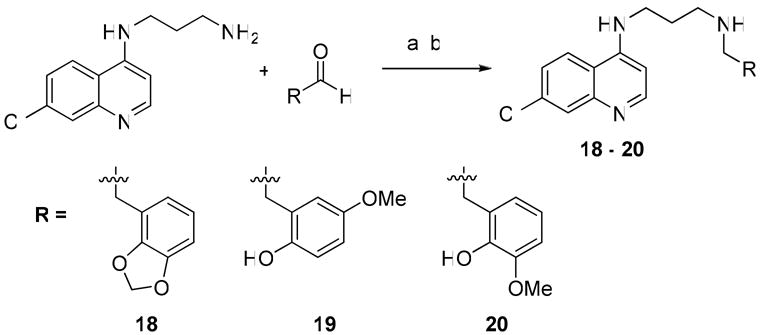
Synthesis of side chain substituted secondary amines. Reagents and Conditions: (a) RCHO (4 eq.), MeOH, 16 h.; (b) NaBH4 (4 eq.), MeOH, 2 h.
Table 6.
Pharmacokinetic profile in mice following a single oral dose.
| Compound | Dose PO (mg/kg) | t1/2 (h) | tmax (h) | Cmax (nM) | AUClast (pmole·h/ml) | Relative Bioavailability (Frela) |
|---|---|---|---|---|---|---|
| CQ | 50 | 5.5 | 0.5 | 444.3 | 2639.29 | NA |
| 1 | 50 | 3.1 | 0.5 | 261.4 | 725.77 | 0.25 |
| 4 | 50 | 15.9 | 0.5 | 436.6 | 6792.42 | 2.34 |
| 18 | 50 | 6.8 | 2 | 240.2 | 2026.66 | 0.70 |
| 20 | 50 | 4.8 | 4 | 65.9 | 620.49 | 0.21 |
Relative Bioavailability (Frel) = AUClast, test/AUClast, CQ
Acknowledgments
We thank Anna Furimsky and Robert Swezey for their valuable contribution to the project. The work supported by NIAID grants U01-AI-53862 and U01-AI-75517 and the American Lebanese Syrian Associated Charities (ALSAC) and St Jude Children's Research Hospital.
Footnotes
Abbreviations: ADMET, Absorption, Distribution, Metabolism, Excretion and Toxicity; CQ, chloroquine; PK, pharmacokinetics; IC50, concentration of inhibitor resulting in 50% inhibition; SAR, structure-activity relationship; CYP, cytochrome P450; RBCs, red blood cells; LC/MS, liquid chromatography / mass spectrometry; MTD, maximum tolerated dose; AUC, area under the curve; Cmax, maximum plasma concentration; t1/2, elimination half-life; tmax, time to maximum concentration;
References
- 1.Kassel DB. Applications of high-throughput ADME in drug discovery. Curr Opin Chem Biol. 2004;8:339–345. doi: 10.1016/j.cbpa.2004.04.015. [DOI] [PubMed] [Google Scholar]
- 2.Shearer TW, Smith KS, Diaz D, Asher C, Ramirez J. The role of in vitro ADME assays in antimalarial drug discovery and development. Comb Chem High Throughput Screen. 2005;8:89–98. doi: 10.2174/1386207053328129. [DOI] [PubMed] [Google Scholar]
- 3.WHO. World Malaria Report. World Health Organization; 2008. [Google Scholar]
- 4.Madrid PB, Liou AP, DeRisi JL, Guy RK. Incorporation of an intramolecular hydrogen-bonding motif in the side chain of 4-aminoquinolines enhances activity against drug-resistant P. falciparum. J Med Chem. 2006;49:4535–4543. doi: 10.1021/jm0600951. [DOI] [PMC free article] [PubMed] [Google Scholar]
- 5.Madrid PB, Sherrill J, Liou AP, Weisman JL, Derisi JL, Guy RK. Synthesis of ring-substituted 4-aminoquinolines and evaluation of their antimalarial activities. Bioorg Med Chem Lett. 2005;15:1015–1018. doi: 10.1016/j.bmcl.2004.12.037. [DOI] [PubMed] [Google Scholar]
- 6.Lipinski CA, Lombardo F, Dominy BW, Feeney PJ. Experimental and computational approaches to estimate solubility and permeability in drug discovery and development settings. Adv Drug Deliv Rev. 2001;46:3–26. doi: 10.1016/s0169-409x(00)00129-0. [DOI] [PubMed] [Google Scholar]
- 7.Schupbach ME. Mutagenicity evaluation of the two antimalarial agents chloroquine and mefloquine, using a bacterial fluctuation test. Mutat Res. 1979;68:41–49. doi: 10.1016/0165-1218(79)90076-4. [DOI] [PubMed] [Google Scholar]
- 8.Obaseiki-Ebor EE, Obasi EE. Aspects of chloroquine mutagenicity. Mutat Res. 1986;175:51–59. doi: 10.1016/0165-7992(86)90125-9. [DOI] [PubMed] [Google Scholar]
- 9.Fluckiger-Isler S, Baumeister M, Braun K, Gervais V, Hasler-Nguyen N, Reimann R, Van Gompel J, Wunderlich HG, Engelhardt G. Assessment of the performance of the Ames II assay: a collaborative study with 19 coded compounds. Mutat Res. 2004;558:181–197. doi: 10.1016/j.mrgentox.2003.12.001. [DOI] [PubMed] [Google Scholar]
- 10.McCann J, Choi E, Yamasaki E, Ames BN. Detection of carcinogens as mutagens in the Salmonella/microsome test: assay of 300 chemicals. Proc Natl Acad Sci U S A. 1975;72:5135–5139. doi: 10.1073/pnas.72.12.5135. [DOI] [PMC free article] [PubMed] [Google Scholar]
- 11.Ansari AM, Craig JC. Metabolites of chloroquine: some observations on desethylchloroquine and N-acetyldesethylchloroquine. J Pharm Sci. 1994;83:1040–1042. doi: 10.1002/jps.2600830722. [DOI] [PubMed] [Google Scholar]
- 12.Zhou SF. Drugs behave as substrates, inhibitors and inducers of human cytochrome P450 3A4. Curr Drug Metab. 2008;9:310–322. doi: 10.2174/138920008784220664. [DOI] [PubMed] [Google Scholar]
- 13.Hutzler JM, Walker GS, Wienkers LC. Inhibition of cytochrome P450 2D6: structure-activity studies using a series of quinidine and quinine analogues. Chem Res Toxicol. 2003;16:450–459. doi: 10.1021/tx025674x. [DOI] [PubMed] [Google Scholar]
- 14.Adedoyin A, Frye RF, Mauro K, Branch RA. Chloroquine modulation of specific metabolizing enzymes activities: investigation with selective five drug cocktail. Br J Clin Pharmacol. 1998;46:215–219. doi: 10.1046/j.1365-2125.1998.00765.x. [DOI] [PMC free article] [PubMed] [Google Scholar]
- 15.Beverage JN, Sissung TM, Sion AM, Danesi R, Figg WD. CYP2D6 polymorphisms and the impact on tamoxifen therapy. J Pharm Sci. 2007;96:2224–2231. doi: 10.1002/jps.20892. [DOI] [PubMed] [Google Scholar]
- 16.Lancaster DL, Adio RA, Tai KK, Simooya OO, Broadhead GD, Tucker GT, Lennard MS. Inhibition of metoprolol metabolism by chloroquine and other antimalarial drugs. J Pharm Pharmacol. 1990;42:267–271. doi: 10.1111/j.2042-7158.1990.tb05405.x. [DOI] [PubMed] [Google Scholar]
- 17.Savarino A, Lucia MB, Rastrelli E, Rutella S, Golotta C, Morra E, Tamburrini E, Perno CF, Boelaert JR, Sperber K, Cauda R. Anti-HIV effects of chloroquine: inhibition of viral particle glycosylation and synergism with protease inhibitors. J Acquir Immune Defic Syndr. 2004;35:223–232. doi: 10.1097/00126334-200403010-00002. [DOI] [PubMed] [Google Scholar]
- 18.Traficante LJ, Hine B, Gershon S, Sakalis G. Chloroquine potentiation of thioridazine effects in rats and drug-resistant schizophrenic patients: a preliminary report. Commun Psychopharmacol. 1977;1:407–419. [PubMed] [Google Scholar]
- 19.Jamshidzadeh A, Niknahad H, Kashafi H. Cytotoxicity of chloroquine in isolated rat hepatocytes. J Appl Toxicol. 2007;27:322–326. doi: 10.1002/jat.1194. [DOI] [PubMed] [Google Scholar]
- 20.Rossmann-Ringdahl I, Olsson R. Porphyria cutanea tarda: effects and risk factors for hepatotoxicity from high-dose chloroquine treatment. Acta Derm Venereol. 2007;87:401–405. doi: 10.2340/00015555-0260. [DOI] [PubMed] [Google Scholar]
- 21.Du XM, Irino N, Furusho N, Hayashi J, Shoyama Y. Pharmacologically active compounds in the Anoectochilus and Goodyera species. Nat Med (Tokyo) 2008;62:132–148. doi: 10.1007/s11418-007-0169-0. [DOI] [PubMed] [Google Scholar]
- 22.Mosmann T. Rapid colorimetric assay for cellular growth and survival: application to proliferation and cytotoxicity assays. J Immunol Methods. 1983;65:55–63. doi: 10.1016/0022-1759(83)90303-4. [DOI] [PubMed] [Google Scholar]
- 23.Medicines for Malaria Venture (MMV) Product Profiles for Antimalarial Drugs. http://www.mmv.org/IMG/pdf/PRODUCT_PROFILE_with_logo.pdf.
- 24.Madrid PB, Wilson NT, DeRisi JL, Guy RK. Parallel synthesis and antimalarial screening of a 4-aminoquinoline library. J Comb Chem. 2004;6:437–442. doi: 10.1021/cc0340473. [DOI] [PMC free article] [PubMed] [Google Scholar]
- 25.Green CE, LeValley SE, Tyson CA. Comparison of amphetamine metabolism using isolated hepatocytes from five species including human. J Pharmacol Exp Ther. 1986;237:931–936. [PubMed] [Google Scholar]