

Abstract
Toll-like receptors (TLRs) are innate immune pattern-recognition receptors endowed with the capacity to detect microbial pathogens based on pathogen-associated molecular patterns. The understanding of the molecular principles of ligand recognition by TLRs has been greatly accelerated by recent structural information, in particular the crystal structures of leucine-rich repeat-containing ectodomains of TLR2, 3, and 4 in complex with their cognate ligands. Unfortunately, for other family members such as TLR7, 8, and 9, no experimental structural information is currently available. Methods such as X-ray crystallography or nuclear magnetic resonance are not applicable to all proteins. Homology modeling in combination with molecular dynamics may provide a straightforward yet powerful alternative to obtain structural information in the absence of experimental (structural) data, provided that the generated three-dimensional models adequately approximate what is found in nature. Here, we report the development of modeling procedures tailored to the structural analysis of the extracellular domains of TLRs. We comprehensively compared secondary structure, torsion angles, accessibility for glycosylation, surface charge, and solvent accessibility between published crystal structures and independently built TLR2, 3, and 4 homology models. Finding that models and crystal structures were in good agreement, we extended our modeling approach to the remaining members of the TLR family from human and mouse, including TLR7, 8, and 9.
Keywords: homology modeling, molecular dynamics, Toll-like receptor, CpG oligonucleotides, leucine-rich repeat, structure function relationships
Introduction
Microorganisms that invade a vertebrate host are initially recognized by the innate immune system through pattern-recognition receptors on the basis of pathogen-associated molecular patterns.1 Upon receptor ligation, intracellular signaling cascades are activated that rapidly induce the expression of a variety of genes, which initiate and shape adaptive immune responses.2 Different classes of pattern recognition receptors, including Toll-like receptors (TLR), recognize distinct microbial components. TLR2 is the receptor for bacterial lipopeptides, TLR4 detects bacterial lipopolysaccharide, TLR3 double-stranded RNA, whereas TLR7/8 and TLR9 recognize single-stranded RNA and unmethylated DNA with CpG motifs,1 respectively. All TLRs feature a glycosylated, leucine-rich repeat (LRR) extracellular domain (ECD), a transmembrane region, and an evolutionarily conserved intracellular Toll/interleukin-1 receptor domain.3 The horseshoe-shaped TLR ECD consists of 20 or more individual LRRs. Each LRR features ∼10 relatively conserved residues that adopt a ß-sheet conformation and contribute to the concave surface of the ECD. The remaining portion of each LRR is more variable and contributes to the convex surface. “Irregular” LRRs found in all TLRs contain inserting stretches of amino acids, which were proposed to protrude from the ECD backbone and be involved in ligand binding.4 Despite a universal scaffold, recent crystallographic studies on human and murine TLRs have shown that specific binding modes operate to engage the structurally vastly dissimilar ligands. For example, TLR1/TLR2 heterodimers are bridged by the acyl chains of the Pam3CSK4 ligand that are directly inserted into hydrophobic channels stretching LRRs 9–12.5 For TLR4, lipopolysaccharide is presented to the receptor through a binding protein, MD-2, leading to a crosslinking of two TLR4-MD-2-LPS complexes.6 In contrast, in TLR3 two distinct, positively charged surface patches make contact with the double-stranded RNA ligand.7 Nevertheless, a significant shortage of structural information for therapeutically interesting TLRs such as TLR7, 8, and 9 and other members of the human and mouse TLR family (e.g., human TLR5 and TLR10, murine TLR5, TLR11-13) remains. Although efforts to experimentally determine these structures are under way, it is unclear whether TLRs from species other than human or mouse will be subjected to systematic experimental structural analysis even though the understanding of host–pathogen interactions at the molecular level is of high evolutionary and commercial interest.8
Comparative or homology modeling9 could serve as a way to predict 3D structures for those TLR domains that are so far structurally unknown, provided its predictions are an accurate approximation of nature, that is, in good agreement with experimental structural data. It is now possible to generate first-approach three-dimensional “models” for TLR ECD (or other domains) by submitting a protein sequence of interest to automated web-based homology modeling servers.10 However, as there is a lack of defined validation criteria, the scientific quality and reliability of these predictions and homology modeling approaches in general remain often unclear.
In this study, we therefore sought to determine the quality of a homology modeling approach that involves structural optimization by molecular dynamics simulation.11 Thus, generated homology models were compared with independently published crystal structures for the same molecules according to secondary structure, torsion angles, accessibility for glycosylation, surface charge, and solvent accessibility. For example, TLR3 ECD-based homology models for the TLR25 and TLR46 ECD were compared to their respective, independently published crystal structures. As a reference point, we also compared two independently determined crystal structures for the same molecule, namely human TLR3 ECD (PDB IDs 2a0z12 and 1ziw13). The data we present here show that homology models are congruent with experimental data to a level of overlap approximating that between two different experimental structures for the same protein. This validated approach was therefore extended to the ECD of all other human and mouse TLRs. Predictions for the ligand binding principles of mouse and human TLR9 were tested experimentally.
Results
Generation of human and murine TLR2 and 4 ECD models
To generate human and mouse TLR2 and TLR4 homology models, the human TLR3 ECD crystal structures 2a0z and 1ziw were used as the only structural templates available at the start of our modeling efforts11 (see also Materials and Methods). Because of differences in primary sequence length (and thus number of LRRs) between the TLR3 template (23 LRR) and the target sequences, h/mTLR2 and h/mTLR4 (19 and 21 LRRs, respectively), we first determined which individual blocks of LRR corresponded best (Supporting Information Fig. S1). Automated LRR alignments showed a homology of ∼30% (Supporting Information Table S1) and these alignments were manually optimized. All generated sequence alignments were used as input files for MODELLER14 (see Materials and Methods), and the generated models subjected to molecular dynamics simulation for energy minimization and further optimization of the structure, especially loop regions. Sterical correctness and energy content were monitored and are shown in Table I and Supporting Information Table S2.
Table I.
Summary of Sterical (Verify 3D, ERRAT) and Energetic (ANOLEA) Structure Quality Factors for All Structures and Models (left), and Validation Criteria for the Comparisons of Two Structures (Secondary Structure, Torsion Angles, and Solvent Accessibility at 50, 90, and 100% Overlap; Right)
| Structure quality factors |
Validation criteria |
||||||||||||
|---|---|---|---|---|---|---|---|---|---|---|---|---|---|
| Shared secondary structure conformations |
Torsion angles (Ramachandran plot) |
Shared solvent accessibility (different % range overlap cutoffs) |
|||||||||||
| Residues included in the analysis | Verify 3D | ERRAT | ANOLEA (E/kT) | β-strands | All | Most favored | Additionally allowed | Generously allowed | Disallowed | 50% | 90% | 100% | |
| hsTLR3 | 98.5% | 79,599 | −6941 | 76.4% | 23.3% | 0.2% | 0.2% | ||||||
| ECD 2a0z | 30–336, | 100% | 94% | 93% | 68% | 55% | |||||||
| hsTLR3 | 343–696# | 95.8% | 80,682 | −7201 | 75.5% | 24.2% | 0.3% | 0.0% | |||||
| hsTLR4 | 97.4% | 86,275 | −6623 | 78.8% | 20.4% | 0.6% | 0.2% | ||||||
| ECD 2z63 | 94% | 64% | 70% | 45% | 38% | ||||||||
| hsTLR4 | 25-527 | 92.2% | 62,838 | −5894a | 73.1% | 25.6% | 0.5% | 0.7% | |||||
| ECD model | |||||||||||||
After Gromacs 10 ns MD simulation.
Gap due to missing entries in pdb coordinate file.
Comparison of TLR3 ECD crystal structures as a reference point for benchmarking
The release of experimental coordinates for human and mouse TLR25 and TLR46 made it possible to compare and evaluate the accuracy of our modeling approach. Therefore, a benchmarking procedure was developed considering (i) secondary structure elements, (ii) torsion angles (Ramachandran plot), (iii) the stereochemical accessibility for posttranslational modification, for example N-glycosylation, (iv) surface charge distribution, and (v) solvent accessibility of individual residues (see Materials and Methods for detailed technical details and software references).
To obtain “reference values,” we first compared the two independently determined crystal structures of human TLR3 ECD (2a0z and 1ziw) that had been used as modeling templates (Fig. 1). Comparison of secondary structure elements [see Materials and Methods, Fig. 2(A) and Supporting Information Fig. S2(A)] showed that most residues (94%) shared the same structural conformation (Table I) and only subtle differences in the convex region of the ECD [cf. LRRs 6–8 in Fig. 2(A)] existed. The position and length of all β-strands on the concave side of the LRR were identical between both structures [cf. Supporting Information Fig. S2(A)]. Regarding backbone torsion angles (Ramachandran plot analysis15) we found that 2a0z and 1ziw shared almost identical percentages of residues in favored regions, generously and additional allowed and disallowed regions (deviations by less than 1%; Table I).
Figure 1.
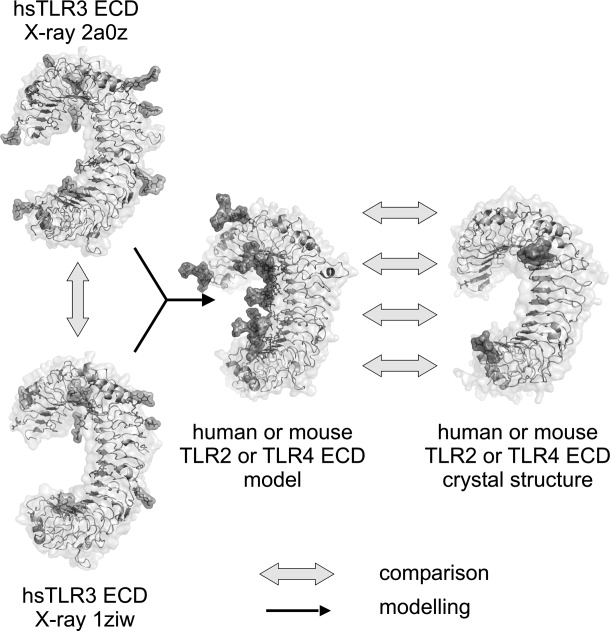
Overview homology modeling and validation workflow. Based on the two published TLR3 ectodomain crystal structures 1ziw and 2a0z (left), models for human and mouse TLR2 and TLR4 ectodomains were generated (black arrows; center). Subsequently, these models were compared with the independently published respective crystal structure (right) according to five criteria: secondary structure, torsion angles, glycosylation, surface charge, and surface accessibilities (details see Materials and Methods). As a reference point, both TLR3 crystal structures were also compared. Upon completion of the validation process, the TLR3 structures were used to generate a homology model of human TLR9 and other TLR ectodomains.
Figure 2.

Modeling validation through comparison of models and crystal structures. (A) (A–C) Comparison of the TLR3 ectodomain crystal structures. Secondary structure elements for selected LRR in TLR3 2a0z (upper) and 1ziw (lower), see Supporting Information Figure S2(A) for all LRRs. Block arrows denote β-strand conformation, ribbons α-helical regions, and straight lines areas without defined secondary structure. Green boxes denote the typical concave surface (A face) of the TLR ectodomain solenoid, red boxes the remainder of the LRR (B–D faces). (B) Comparison of glycosylation accessibility. Structure files were analyzed using GlyProt. Individual circles correspond to asparagine residues in Asn-X-Ser/Thr glycosylation consensus sequons, with residue numbers given above. Dark green: residue glycosylated in crystal structure; light green: glycosylation stereochemically possible as predicted by GlyProt; open circle: residue not found in the structure (due to expression of a truncated construct); orange: glycosylation stereochemically impossible. (C) Surface charge calculation for 2a0z and 1ziw assuming a pH of 5.0. Red: negatively charged; blue: positively charged. (D–F) Comparison of the crystal structure and homology model for human TLR4. (D) Secondary structure elements for selected LRR in 2z63 crystal structure (upper) and human TLR4 model (lower), see Supporting Information Figure S2(B) for all LRRs. Labeling as in (A). (E) Comparison of glycosylation accessibility. Structure files were analyzed using GlyProt. Labeling as in (B). (G) Surface charge calculation for 2z63 and model assuming a pH of 7.0. Labeling as in (C).
N-linked glycosylation profoundly influences the biological activity of many proteins.16 Therefore, a reliable 3D model should feature the correct number of possible glycosylation sites. N-glycosylation is only possible in surface-accessible Asn residues in an Asn-X-Ser/Thr context and depends on the physicochemical properties of an added glycan chain such as mass, accessible surface, and radius of gyration.17 We therefore compared which Asn residues were glycosylated in the crystals and assessed the stereochemical possibility of glycan addition in the remaining Asn residues using GlyProt.17 Figure 2(B) shows that although differences in N-linked sugar substitution existed between both structures, all Asn residues in an Asn-X-Ser/Thr context are stereochemically available for glycan addition in both structures.
Surface charge and/or the precise interactions of surface residues are crucial for many protein–protein or protein–ligand interactions. Therefore, we compared surface charges for both TLR3 ECD crystal structures computed for pH 5.0 (the pH assumed to exist in endosomes where nucleic acid sensing TLRs engage their ligands1) and found considerable differences between the two structures [Fig. 2(C)].
With regard to surface accessibility, we developed an algorithm for computing and comparing surface accessibility between two 3D protein structures taking into account the dynamic nature of each protein side chain (see Materials and Methods for details). In brief, each protein structure was subjected to 200 ps molecular dynamics simulation, and the surface accessibility for each residue of the protein chain was calculated from 20 frames (20 “conformers”) and expressed as a range of solvent-accessible surface area (in Å2). Molecular dynamics helped in assessing the flexibility of protein residues in terms of changes in solvent accessibility. The ranges of accessibility assumed for each residue were computed and compared between structures by adding up for how many residues out of all residues the accessibility ranges of in 2a0z and 1ziw structures overlapped to 50, 90, or 100% (see Materials and Methods and Supporting Information Fig. S3). We found that 93, 68, and 55%, respectively, of all compared residues overlapped in their solvent accessibility ranges to 50, 90, or 100% (Table I).
On the whole this comparison of two independently obtained crystal structures for the human TLR3 ECD in terms of secondary structure, torsion angles, N-glycosylation, surface charge, and surface accessibility provided us with a set of values that served as a reference for the comparison of generated homology models and crystal structures for the TLR2 and 4 ECDs.
TLR2 and TLR4 ECD homology models match their respective crystal structures in most benchmarks
Some of the TLR2 and TLR4 crystal structures did not encompass the entire ECD amino acid sequence because of the experimental approach taken.18 We therefore restricted the comparison between crystal structures and models to the regions found also in the crystal. Figure 2(D), Supporting Information Figure S2(B) and Table I show that 94% of β-strand residues in our model display the same secondary structure conformation as in the human TLR4 ECD crystal structure 2z63, and 64% of all residues. This reflects differences in the lengths (especially of the β-strands) and positions of secondary structure elements between crystal structure 2z63 of TLR4 and the TLR3 templates 2a0z and 1ziw [cf. Fig. 2(A,D)]. Nevertheless, the overall curvature was highly similar [cf. Fig. 2(E,F) and Discussion]. Regarding torsion angles, human TLR4 ECD crystal structure 2z63 and model differed by less than 6%, and the number of residues in disallowed regions was comparable (Table I). Similar results were obtained for secondary structure elements and torsion angle comparisons for the remaining TLR2 and 4 ECD crystal-model pairs (Supporting Information Table S2 and Figs. S4–S6).
In the crystal structure 2z63 of human TLR4 ECD only N309 and N497 were N-glycosylated, and several C-terminal Asn residues in Asn-X-Ser/Thr sequons were not present in the coordinate file [Fig. 2(E)]. Nevertheless, all shared asparagines were accessible for glycan addition in both crystal structure and model, suggesting a correct prediction of the orientation of all Asn residues. For mouse TLR4 ECD all Asn residues in Asn-X-Ser/Thr sequons in both structures displayed the correct orientation and surface exposure to be N-glycosylated [Supporting Information Fig. S4(B)]. Similar results were obtained for human and mouse TLR2 ECDs, which feature 4 and 3 N-glycosylation sites, respectively. In hTLR2 (2z7x) all four sites were accessible (three being glycosylated in the crystal) and correctly predicted in the model [Supporting Information Fig. S5(B)], in mTLR2 (2z81) this was true for all three sites [Supporting Information Fig. S6(B)].
Regarding surface charge we noted that despite small differences at pH 7.0 (assumed cell surface pH), in all cases the difference between crystal structure and corresponding model seemed not greater than that observed for two human TLR3 2a0z and 1ziw [cf. Fig. 2(C,F), Supporting Information Figs. S4(C), S5(C), and S6(C)]. We finally compared the solvent accessibility for residues in the human and mouse TLR2 and TLR4 ECD structure-model pairs. For a 50, 90, and 100% overlap between the accessibility ranges, we obtained 70, 45, and 38% for human TLR4 ECD (Table I) and values up to 4% lower for mouse TLR4 ECD, human TLR2 ECD, and mouse TLR2 ECD (Supporting Information Table S2). Having compared human and mouse TLR2 and TLR4 ECD crystal structures with our corresponding homology models according to five criteria of biological and stereochemical significance, we concluded that the differences between crystal structure–model and crystal structure–crystal structure were sufficiently similar to warrant extension of the comprehensive method used here to other TLR ECD (see also Discussion).
Identification of functionally important residues in the mouse and human TLR9 ECD based on model-guided mutagenesis
Using the human TLR3 ECD crystal structures as templates and considering which individual LRR blocks best corresponded to those in the target sequences, we generated homology models of all human and murine TLR ECD (Supporting Information Fig. S7), in particular human TLR7, TLR8, and TLR9 (Fig. 3 and Supporting Information Fig. S8). This subfamily exclusively displays a region within the ECD with low similarity to the LRR consensus or other structural motifs. This region that would correspond to LRR14 was therefore termed “unstructured” or “hinge” region.4 Even between TLR7-9 sequence lengths differ and homologies are low in this region. Based on structure-sequence searches and secondary structure prediction programs, we decided to model this part as two consecutive LRRs 14 and 14a using as a template structure polygalacturonase-inhibiting protein [PDB ID 1ogq; see Supporting Information Fig. S8(B)]. A complete TLR9 ECD structure was assembled from different blocks [Supporting Information Fig. S8(A)] and optimized by molecular dynamics simulation. In a similar way, models for human (Fig. 3) and murine (not shown) TLR7 and TLR8 were also generated (cf. Supporting Information Table S3 for structural quality factors).
Figure 3.
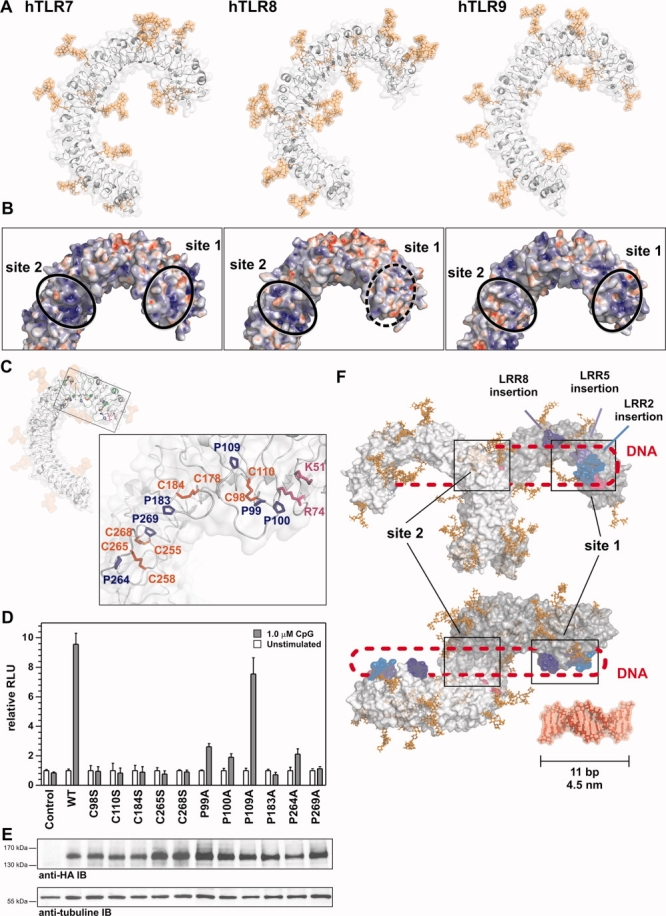
Homology modeling applied to human TLR7-9 leads to the identification of LRR insertions as important for CpG oligonucleotide recognition by human TLR9. (A) Ribbon diagram and molecular surfaces of human TLR7, 8, and 9 in gray and putative N-glycosylation in orange. (B) Surface charge calculation for TLR7, 8, and 9 models at pH 5.0. Black circles denote N- and more C-terminal positively charged patches in TLR7, 8, and 9, one of which is absent in TLR8 (dashed circle). Red: negatively charged; blue: positively charged. (C) Ribbon diagram and molecular surface of hTLR9 with putative N-glycosylation in orange. “Irregular” LRRs 2, 5, and 8 are shown in green. Insert: close-up on LRR2 (C98-110), LRR5 (C178-C184), and LRR8 (C255-C265) loop insertions, cysteines shown in red, prolines in blue, and R71 in magenta. (D) All cysteine to serine mutations and most proline to alanine substitutions lead to loss of function of hTLR9. HEK293 cells transfected with WT or mutant hTLR9-HA expression constructs and stimulated with 1 μM CpG 2006 for 18 h were analyzed by an NF-κB-dependent dual luciferase assay. Triplicate values (±SD) are shown for one representative experiment. (E) hTLR9 mutants are expressed at levels similar to WT. Forty-eight hours after transfection with WT and mutant hTLR9-HA constructs, HEK293 cell lysates were separated on 3–8% Tris acetate SDS-PAGE and analyzed by anti-HA or anti-β tubulin (loading control) immunoblot. One representative experiment is shown. (F) Proposed recognition model for CpG oligonucleotides by human TLR9 involves two binding regions, one centrally located around D535 and Y537,19 one near the N-terminus involving a negatively charged patch around K51 and R7420 (magenta), as well as the LRR insertions of LRR2, 5, and 8 (shades of blue). A double-stranded 11-mer DNA oligonucleotide is shown for size comparison.
As evident from Figure 3(A), the N- and C-terminal parts of the LRR solenoid in our TLR7-9 ECD models differ in curvature (radius of LRRs solenoid) compared with the central part. A similar phenomenon was observed in the crystal structures of human TLR25 and TLR4.6 These structures additionally exhibit a twist within the central part (LRR7–9) of the overall superhelical structure, a feature typical for LRR proteins but difficult to predict in silico.21 These features imply that different ECD differ in their conformational rigidity, and their relative orientation or movement could be important for proper receptor function as demonstrated experimentally for TLR922 and for several TLRs using molecular dynamics.11 It is interesting to note that the distance between N- and C-terminal point of the TLR9 ECD predicted in our model (∼7.5 nm) corresponds very well with the experimental values obtained by Latz et al. (7.3 nm)22 (cf. Supporting Information Fig. S11).
We noted that in the TLR7-9 models [Fig. 3(A)] the surface following the concave β-sheet (henceforward referred to as B-face) was glycan free as predicted earlier11 and supported by crystallographic studies for TLR1, TLR2,5 TLR3,12,13 and TLR4.6 This suggested that the B-faces of TLR7-9 might be involved in protein–ligand or protein–protein interactions. In analogy to hTLR3 where the nucleic acid ligand is bound by two positively charged patches,7,23 we noted two positively charged patches in TLR7 and 9 but only one in TLR8 [Fig. 3(B)]. It was intriguing to find that the protruding insertions in “irregular” LRRs 2, 5, and 8 lined the N-terminal half of the B-faces, suggesting that molecular interactions might not only involve the LRR core structure. N-terminal insertions are absent in TLR3. In hTLR9 the loop insertions contained several highly conserved cysteine residues usually in the company of one or more highly conserved proline residues [Fig. 3(C) and Supporting Information Fig. S9]. Additionally, we identified several highly conserved residues in an N-terminal positively charged patch that bears functional similarity to an N-terminal-binding site in TLR3.23 This structural analysis hinted to a potential functional role of these residues, which we decided to functionally assess in cellular assays. We addressed the role of several cysteines by mutation to serine, an amino acid isostructural to cysteine, but unable to form disulphide bonds. Additionally, we mutated individual proline residues to alanine. HA-tagged expression constructs were generated and transiently transfected into HEK293 cells [Fig. 3(D)]. Proline residues mutants P183A (LRR5) and P269A (LRR8) completely abrogated TLR9 function, and P99A and P100A (LRR2) reduced TLR9 activation levels to ∼25%. P109A (LRR2), on the other hand, did not significantly influence TLR9 signaling. Protein expression of all point mutants was unaffected [Fig. 3(E)]. Mutation of any of the five cysteines leads to a complete loss of human TLR9 signaling when assessing the ability to respond to CpG oligonucleotide 2006 in NF-κB-dependent dual luciferase assays [Fig. 3(D)]. Supporting Information Figure S10 shows that the electrophoretic mobilities of WT TLR9 and selected cysteine mutants (C98S and C110S) were identical under reducing and nonreducing SDS-PAGE conditions, ruling out the possibility that the generation of an unpaired cysteine could have lead to aberrant receptor crosslinking. These data demonstrate that individual residues in the loop insertions of hTLR9 are functionally important for sensing CpG oligonucleotides. Furthermore, these data confirm and validate our modeling procedure experimentally.
Discussion
In this study, we have evaluated the accuracy of a modeling approach combining homology modeling and molecular dynamics for the generation and refinement of 3D models using a set of stereochemically and biologically relevant criteria. The analysis and comparison of two crystal structures of the same protein (hTLR3) served as a reference point assuming that both crystal structures are two experimental attempts to describe the same protein structurally. To get an idea how close homology modeling could possibly “get” to predict an unknown structure, we compared our homology models for human and mouse TLR2 and TLR4 ECD with the respective crystal structures, which would generally be seen as the most accurate description of a protein's structure, despite the shortcomings that may affect crystal structures and which have been discussed elsewhere.24,25
The presented models for human and murine TLR2 and TLR4 ECD resemble their respective, independently generated crystal structures closely for some comparison criteria: overall quality factors, β-strand conformation, torsion angles, and accessibility for glycosylation. The secondary structure conformation for residues on the LRR ECD-defining concave surface was correctly predicted for an average (considering the four human and murine TLR2 and TLR4 ECD models) of 95% of all concave LRRs residues that were compared. Expectedly, the more structurally diverse convex side was correctly predicted in only ∼60% of the cases, a value that needs to be improved. Regarding the distribution of residues to the different Ramachandran plot regions, we found differences between models and crystals below 10% (Table I and Supporting Information Table S2). Because of the particular role of glycosylation in many receptors, including TLRs,26,27 particular emphasis was placed on whether the correct number of possible glycosylation sites was featured in the homology models. Our analysis reveals that the orientation of all 30 modeled, putatively N-glycan-linked asparagines was predicted as in the crystal structures. Identifying potential glycosylation sites per se is a trivial task as it follows precise sequence requirements.28 On a structural level, however, it does not follow that any asparagine in the correct sequence context can automatically be glycosylated in 3D as the Asn side chain needs to adopt the correct geometry and surface accessibility required for N-glycan addition.17 As glycan sites in TLR3 are not in equivalent positions in TLR2 or TLR426 the prediction of Asn geometries in the latter TLR ECD was not biased toward a “glycan-accessible” orientation. The fact that all 30 modeled Asn in a glycosylation sequon were glycan-accessible postmodeling is therefore highly significant and underscores the meaningfulness of our approach with regard to this important biological parameter. Whether all predicted sites will be glycosylated in vivo will need to be the focus of future biochemical studies. In terms of the fourth benchmark, surface charge, we found that significant differences existed between the two reference crystal structures [Fig. 2(C)], whereas for the remaining crystal-model pairs differences in surface charge distribution appeared less [Fig. 2(F), Supporting Information Figs. S4(C), S5(C), and S6(C)]. Differences in the pH of the crystallization buffer (pH 4.5 for 2a0z, pH 7.5 for 1ziw) may account for the observed differences in surface charge between both TLR3 structures through affecting side-chain orientation and/or surface accessibility of charged residues. If this was so, the pH dependence observed for nucleic acid sensing by endosomal TLRs19 may be more complex than only affecting the protonation of histidine residues. Particular emphasis was also placed on the question of whether residues in general are predicted correctly to be solvent accessible and thus able to engage in molecular interactions. For example, point mutations at H39, H60, H539, and N541 in TLR3 rendered the receptor dysfunctional29 and abrogated ligand interaction.23 Similar results were obtained for TLR8.30,31 Our comparison of surface accessibility dynamics revealed that homology modeling predicted only ∼68% of all residues correctly for human and mouse TLR2 and TLR4 ECD crystal-model pairs even at the lowest 50% overlap level. This is matched by more than 93% for the two human TLR3 ECD crystal structures and suggests that side-chain conformation, as expected, would be the most difficult to predict by modeling. It is difficult to envisage how to predict surface accessibility more accurately, and our data show that there is scope to refine the modeling process and to improve comparison tools in terms of surface charge. Nevertheless, on a purely theoretical basis the obtained approximations of nature seem accurate enough to formulate hypotheses for the structure–function relationships of structurally unknown TLRs that would be worth testing experimentally. Such experimental testing would of course be the ultimate test for any homology model.
Analysis of the model of human TLR9 prompted us to experimentally investigate the role of cysteine and proline residues in LRR insertions. Our mutational analysis showed that in keeping with data on TLR830,31 mutation of any of the cysteines resulted in a complete loss of TLR9 signaling [Fig. 3(D)] most likely by disruption of disulphide bonds connecting the start and end of each loop as proposed in Figure 3(C) (C98-C110 in LRR2, C178-C184 in LRR5, and C255-C268 and C258-C265 in LRR8) and not due to aberrant receptor crosslinking through unpaired cysteines (cf. Supporting Information Fig. S10). Disulphide bond formation could be important in the folding of the loop insertion or providing a certain amount of stability or rigidity that may be required for the detection of DNA. This would link in with our observation that another functional requirement for proper receptor function is the presence of proline residues, which are known for their unusual conformational rigidity. Alternatively, cysteines may coordinate metal ions as observed in the RNA-binding pattern-recognition receptor RIG-I.32 Future experiments need to address the precise molecular mechanism, but our preliminary data show that all three N-terminal LRR insertions contribute to signaling. Another interesting observation is that at least LRR2 is directly adjacent to an N-terminal CpG oligonucleotide recognition site in murine TLR9 ECD, which was very recently proposed based on a homology model of murine TLR9 and experimentally confirmed by signaling and CpG-binding assays.20 In this study, K51 and R74 were identified as two positively charged residues with similar spatial properties as H39 and H60, which constitute one of the two nucleic acid-binding sites in TLR3.7 Interestingly, the distance between R74 and the LRR2 insertion would be less then 4 Å according to our human TLR9 model [Fig. 3(C)], so that both could represent one continuous binding site and/or that N-terminal patches and LRR insertions act in concert in CpG oligonucleotide sensing.
The notion of N-terminal CpG oligonucleotide-binding sites in human and murine TLR9 appears incompatible with earlier reports suggesting that a C-terminal fragment of the TLR9 ECD generated by cathepsin-mediated cleavage in the region between LRR14 and 15 represented the actual CpG oligonucleotide sensor, the TLR9 N-terminus thus being dispensable for signaling.20,33 Although a cleavage product was confirmed to exist for murine TLR9 in the HEK293 system, mutations in the N-terminal residues K51 and R74 clearly impaired function and not generation of the cleavage product.20 We did not observe a cleavage product for human TLR9 in our experiments, and our data strengthen the importance of N-terminal residues for human TLR9 signaling further. TLR9 cleavage may nevertheless represent an important regulatory step subsequent to initial CpG oligonucleotide detection by the full-length receptor. Further experiments using purified ECD truncations would be highly informative to clarify the impact of cleavage on ligand recognition.
According to our modeling and experimental data, CpG DNA appears to be engaged by at least two distinct sites in both human and murine TLR9. As seen in Figure 3(F), the distance between site 1 and 2 in one receptor molecule (predicted to be ∼7.5 nm, Supporting Information Fig. S11) could be bridged by a 24-mer like CpG 2006 (a 11 mer included for size comparison spans 4.5 nm). The relative distance of site 1 and site 2 would obviously be affected by LRR curvature, rigidity, and conformational changes occurring during signaling.11,22 Assuming the greatest flexibility to occur in the “hinge” region of TLR9, the different curvatures experimentally determined by Latz et al.22 would translate to the site 1-2 distance to shrink from ∼7.5 nm (in the unbound state) to ∼6.8 nm upon CpG binding, as illustrated in Supporting Information Figure S11. This would equate to an approximate shift in one dinucleotide. If the core structure is double stranded with free 5′ and 3′ overhangs as suggested on the basis of biophysical studies,34 we speculate that sites 1 and 2 could be simultaneously contacted in two receptor molecules (distance site 1–site2/2′–site 1′ ∼16 nm) that exist as preformed dimers before ligand binding.22 Future studies will need to address whether these predictions hold true and what role relative receptor positions (as proposed for TLR323) plays during ligand binding and signal generation. Another interesting question that may be guided by the homology models generated here is whether similar binding principles apply for the other nucleic acid sensing receptors TLR7 and 8 [Fig. 3(B)]. Homology models we built for the remaining members of human (TLR5, 6, and 7–10; Supporting Information Fig. S7), mouse (TLR5, 6, and 11–13; data not shown), and other vertebrate TLR families may furthermore provide a structural perspective into the evolution of the TLR family as a whole (Kubarenko et al., manuscript in preparation).
In conclusion, we present here data on the ligand-recognition principles of human TLR9 upon validation of our TLR ECD homology modeling approach. Although comprehensive validation is not possible for models corresponding to domains of entirely unknown structure, when possible, modeling procedures should be validated against corresponding crystal structures. As a growing number of publications in the TLR field rely on homology modeling for the interpretation of experimental results, modeling results should be referenced to certain benchmarks. Particularly when models are used to retrospectively interpret obtained experimental results rather than to initiate a hypothesis that is subsequently tested experimentally, the validity of the approach used should be demonstrated and sufficient data shared to assess the quality of the prediction. We were surprised to find that our report is the first one to discuss the issue of validation of generated homology models for TLR domains. Engaging with this question may foster improvements in modeling procedures not only for TLR domains but also may increase the power of predictions based on homology models. Although crystal structures for some of the TLRs discussed here will follow, experimental data generated on the basis of homology modeling may in the meantime not only provide important insights into the molecular biology of these receptors but would also constitute the functional data necessary to functionally validate even high-resolution crystal structures.
Materials and Methods
Structural data files
Crystal structures
Apart from the crystal structures referenced in the text, the structures for mouse CD14 (PDB ID 1wwl35) and P. vulgarism polygalacturonase-inhibiting protein (PDB ID 1ogq, PMID 12904578) were also used.
TLR sequences
For homology modeling, the following TLR sequences were used: hTLR4 (AAF05316), mTLR4 (NP_067272), hTLR2 (AAC34133), mTLR2 (AAD49335), hTLR7 (NP_057646), mTLR7 (NP_573474), hTLR8 (NP_619542), mTLR8 (NP_573475), bovine btTLR8 (NP_001029109), hTLR9 (NP_059138), and mTLR9 (NP_112455).
Homology modeling
Modeling was carried out as previously described11 using the MODELLER package,14 the human TLR3 ECD structures 2a0z and 1ziw, mouse CD14 1wwl, and P. vulgarism polygalacturonase-inhibiting protein as a templates using blocks of LRR with highest similarity between template and target (Supporting Information Figs. S1 and S8). After modeling individual blocks, they were assembled to the complete ECD structure by means of partial sequence/structure overlap in the most structurally conserved β-strand region. The FUGUE server36 was used for the search of TLR7-9 LRR14 templates. GROMACS molecular dynamics and the quality analysis (ANOLEA, VERIFY_3D and ERRAT) and visualization/analysis (SwissPBD Viewer and PyMol) tools were used as referenced.11
Structure comparison programs
For the comparison of secondary structures and torsion angles, ProCheck and ProCheck_Comp37 and DSSP38 were used. For glycosylation analysis, the pdb files were submitted to the GlyProt webserver.17 Surface charges were calculated and visualized using PDB2PQR,39 PropKa,40 and APBS41 packages. For solvent accessibility comparison 20 frames corresponding to each 10 ps interval from 200 ps GROMACS molecular dynamic simulation were extracted, and for each frame solvent-accessible area for each residue was calculated using the MSMS module42 within the CAT package (www.md-simulations.de/CAT).
Cells and reagents
Chemicals and cell culture reagents were from Sigma, unless otherwise stated. The CpG oligodeoxynucleotide 2006 (5′-tcgtcgttttgtcgttttgtcgtt-3′) was synthesized by TIB MolBiol (Ebersberg, Germany). Anti-HA antibodies were received from Sigma. HEK293 cells were a gift from A. Dalpke, Heidelberg University, Germany and were grown at 37°C and 5% CO2 in DMEM supplemented with 10% FCS (PAA, Germany), l-glutamine, and penicillin/streptomycin (Invitrogen).
Site-directed mutagenesis
pSEM3_hTLR9-HA plasmid was constructed by introducing an annealed custom synthesized 5′-phosphorylated oligonucleotide encoding the HA-tag sequence (YPYDVPDYA) using the restriction enzymes BamHI and NotI. Site-directed mutagenesis was carried out as described earlier,20 sequences of the primers can be made available upon request.
Reporter gene experiments and immunoblot
For reporter gene experiments, a firefly luciferase reporter construct with a 6xNF-κB responsive element was used. A total of 1 × 10⁶ HEK293 cells was seeded and immediately transfected in 24-well format and a volume of 500 μL media. A total of 50 ng of hTLR9-HA or the indicated mutant plasmids was transfected with 85 ng NF-κB-reporter plasmid encoding firefly luciferase, and 8.5 ng pRL-TK (Promega) encoding Renilla luciferase was transfected using the calcium phosphate method. Twenty-four hours after transfection, cells were stimulated with 1 μM CpG oligonucleotide 2006 for 18 h, and luciferase activities were determined using the Dual Luciferase Reporter Assay System Kit (Promega) on a Fluostar Optima Instrument (BMG Labtech). Mean values of triplicates (±SD) of one of at least three independent experiments are shown. hTLR9-HA was proven to signal similarly to untagged hTLR9 in this assay (A. Kubarenko, unpublished observation).
Immunoblot
HEK293 cells were transfected as above with 400 ng of the indicated hTLR9-HA plasmid. Forty-eight hours later, cells were lysed for 30 min on ice in 80 μL lysis buffer (50 mM Tris pH 8, 150 mM NaCl, 1% NP-40, 0.5% sodium deoxycholate, 0.1% SDS supplemented with Complete protease inhibitor cocktail (Roche)) per well and three wells pooled. Lysates were cleared by centrifugation at 4°C for 15 min at 11,000g. Equal amounts of lysates were fractionated on 3–8% Tris-acetate SDS-PAGE (Invitrogen) gels and transferred to nitrocellulose membranes by wet transfer (Invitrogen). The membranes were blocked with PBS supplemented with 3% nonfat dry milk and 0.5% Tween 20, probed with anti-HA (1:2500) and a Promega anti-mouse-HRP conjugate (1:10,000), and crossreactive bands visualized using enhanced chemiluminescence (Pierce) on an Agfa automated developer.
Acknowledgments
The authors thank A. Dalpke for helpful discussions and T. Holz for computer support.
References
- 1.Kawai T, Akira S. Toll-like receptor and RIG-I-like receptor signaling. Ann N Y Acad Sci. 2008;1143:1–20. doi: 10.1196/annals.1443.020. [DOI] [PubMed] [Google Scholar]
- 2.Iwasaki A, Medzhitov R. Toll-like receptor control of the adaptive immune responses. Nat Immunol. 2004;5:987–995. doi: 10.1038/ni1112. [DOI] [PubMed] [Google Scholar]
- 3.Gay NJ, Gangloff M, Weber AN. Toll-like receptors as molecular switches. Nat Rev Immunol. 2006;6:693–698. doi: 10.1038/nri1916. [DOI] [PubMed] [Google Scholar]
- 4.Bell JK, Mullen GE, Leifer CA, Mazzoni A, Davies DR, Segal DM. Leucine-rich repeats and pathogen recognition in Toll-like receptors. Trends Immunol. 2003;24:528–533. doi: 10.1016/s1471-4906(03)00242-4. [DOI] [PubMed] [Google Scholar]
- 5.Jin MS, Kim SE, Heo JY, Lee ME, Kim HM, Paik SG, Lee H, Lee JO. Crystal structure of the TLR1-TLR2 heterodimer induced by binding of a tri-acylated lipopeptide. Cell. 2007;130:1071–1082. doi: 10.1016/j.cell.2007.09.008. [DOI] [PubMed] [Google Scholar]
- 6.Kim HM, Park BS, Kim JI, Kim SE, Lee J, Oh SC, Enkhbayar P, Matsushima N, Lee H, Yoo OJ, Lee JO. Crystal structure of the TLR4-MD-2 complex with bound endotoxin antagonist Eritoran. Cell. 2007;130:906–917. doi: 10.1016/j.cell.2007.08.002. [DOI] [PubMed] [Google Scholar]
- 7.Liu L, Botos I, Wang Y, Leonard JN, Shiloach J, Segal DM, Davies DR. Structural basis of Toll-like receptor 3 signaling with double-stranded RNA. Science. 2008;320:379–381. doi: 10.1126/science.1155406. [DOI] [PMC free article] [PubMed] [Google Scholar]
- 8.Werling D, Coffey TJ. Pattern recognition receptors in companion and farm animals—the key to unlocking the door to animal disease? Vet J. 2007;174:240–251. doi: 10.1016/j.tvjl.2006.10.010. [DOI] [PMC free article] [PubMed] [Google Scholar]
- 9.Sanchez R, Sali A. Advances in comparative protein-structure modelling. Curr Opin Struct Biol. 1997;7:206–214. doi: 10.1016/s0959-440x(97)80027-9. [DOI] [PubMed] [Google Scholar]
- 10.Guex N, Peitsch MC. SWISS-MODEL and the Swiss-PdbViewer: an environment for comparative protein modeling. Electrophoresis. 1997;18:2714–2723. doi: 10.1002/elps.1150181505. [DOI] [PubMed] [Google Scholar]
- 11.Kubarenko A, Frank M, Weber AN. Structure-function relationships of Toll-like receptor domains through homology modelling and molecular dynamics. Biochem Soc Trans. 2007;35:1515–1518. doi: 10.1042/BST0351515. [DOI] [PubMed] [Google Scholar]
- 12.Choe J, Kelker MS, Wilson IA. Crystal structure of human Toll-like receptor 3 (TLR3) ectodomain. Science. 2005;309:581–585. doi: 10.1126/science.1115253. [DOI] [PubMed] [Google Scholar]
- 13.Bell JK, Botos I, Hall PR, Askins J, Shiloach J, Segal DM, Davies DR. The molecular structure of the Toll-like receptor 3 ligand-binding domain. Proc Natl Acad Sci USA. 2005;102:10976–10980. doi: 10.1073/pnas.0505077102. [DOI] [PMC free article] [PubMed] [Google Scholar]
- 14.Sali A, Overington JP. Derivation of rules for comparative protein modeling from a database of protein structure alignments. Protein Sci. 1994;3:1582–1596. doi: 10.1002/pro.5560030923. [DOI] [PMC free article] [PubMed] [Google Scholar]
- 15.Laskowski RA, Moss DS, Thornton JM. Main-chain bond lengths and bond angles in protein structures. J Mol Biol. 1993;231:1049–1067. doi: 10.1006/jmbi.1993.1351. [DOI] [PubMed] [Google Scholar]
- 16.Mitra N, Sinha S, Ramya TN, Surolia A. N-linked oligosaccharides as outfitters for glycoprotein folding, form and function. Trends Biochem Sci. 2006;31:156–163. doi: 10.1016/j.tibs.2006.01.003. [DOI] [PubMed] [Google Scholar]
- 17.Bohne-Lang A, von der Lieth CW. GlyProt: in silico glycosylation of proteins. Nucleic Acids Res. 2005;33:W214–W219. doi: 10.1093/nar/gki385. [DOI] [PMC free article] [PubMed] [Google Scholar]
- 18.Jin MS, Lee JO. Application of hybrid LRR technique to protein crystallization. BMB Rep. 2008;41:353–357. doi: 10.5483/bmbrep.2008.41.5.353. [DOI] [PubMed] [Google Scholar]
- 19.Rutz M, Metzger J, Gellert T, Luppa P, Lipford GB, Wagner H, Bauer S. Toll-like receptor 9 binds single-stranded CpG-DNA in a sequence- and pH-dependent manner. Eur J Immunol. 2004;34:2541–2550. doi: 10.1002/eji.200425218. [DOI] [PubMed] [Google Scholar]
- 20.Peter ME, Kubarenko AV, Weber AN, Dalpke AH. Identification of an N-terminal recognition site in TLR9 that contributes to CpG-DNA-mediated receptor activation. J Immunol. 2009;182:7690–7697. doi: 10.4049/jimmunol.0900819. [DOI] [PubMed] [Google Scholar]
- 21.Kajava AV, Kobe B. Assessment of the ability to model proteins with leucine-rich repeats in light of the latest structural information. Protein Sci. 2002;11:1082–1090. doi: 10.1110/ps.4010102. [DOI] [PMC free article] [PubMed] [Google Scholar]
- 22.Latz E, Verma A, Visintin A, Gong M, Sirois CM, Klein DC, Monks BG, McKnight CJ, Lamphier MS, Duprex WP, Espevik T, Golenbock DT. Ligand-induced conformational changes allosterically activate Toll-like receptor 9. Nat Immunol. 2007;8:772–779. doi: 10.1038/ni1479. [DOI] [PubMed] [Google Scholar]
- 23.Pirher N, Ivicak K, Pohar J, Bencina M, Jerala R. A second binding site for double-stranded RNA in TLR3 and consequences for interferon activation. Nat Struct Mol Biol. 2008;15:761–763. doi: 10.1038/nsmb.1453. [DOI] [PubMed] [Google Scholar]
- 24.Putnam CD, Hammel M, Hura GL, Tainer JA. X-ray solution scattering (SAXS) combined with crystallography and computation: defining accurate macromolecular structures, conformations and assemblies in solution. Q Rev Biophys. 2007;40:191–285. doi: 10.1017/S0033583507004635. [DOI] [PubMed] [Google Scholar]
- 25.DePristo MA, de Bakker PI, Blundell TL. Heterogeneity and inaccuracy in protein structures solved by X-ray crystallography. Structure. 2004;12:831–838. doi: 10.1016/j.str.2004.02.031. [DOI] [PubMed] [Google Scholar]
- 26.Weber AN, Morse MA, Gay NJ. Four N-linked glycosylation sites in human Toll-like receptor 2 cooperate to direct efficient biosynthesis and secretion. J Biol Chem. 2004;279:34589–34594. doi: 10.1074/jbc.M403830200. [DOI] [PubMed] [Google Scholar]
- 27.da Silva Correia J, Ulevitch RJ. MD-2 and TLR4 N-linked glycosylations are important for a functional lipopolysaccharide receptor. J Biol Chem. 2002;277:1845–1854. doi: 10.1074/jbc.M109910200. [DOI] [PubMed] [Google Scholar]
- 28.Shakin-Eshleman SH, Spitalnik SL, Kasturi L. The amino acid at the X position of an Asn-X-Ser sequon is an important determinant of N-linked core-glycosylation efficiency. J Biol Chem. 1996;271:6363–6366. doi: 10.1074/jbc.271.11.6363. [DOI] [PubMed] [Google Scholar]
- 29.Bell JK, Askins J, Hall PR, Davies DR, Segal DM. The dsRNA binding site of human Toll-like receptor 3. Proc Natl Acad Sci USA. 2006;103:8792–8797. doi: 10.1073/pnas.0603245103. [DOI] [PMC free article] [PubMed] [Google Scholar]
- 30.Gibbard RJ, Morley PJ, Gay NJ. Conserved features in the extracellular domain of human Toll-like receptor 8 are essential for pH-dependent signaling. J Biol Chem. 2006;281:27503–27511. doi: 10.1074/jbc.M605003200. [DOI] [PubMed] [Google Scholar]
- 31.Zhu J, Brownlie R, Liu Q, Babiuk LA, Potter A, Mutwiri GK. Characterization of bovine Toll-like receptor 8: ligand specificity, signaling essential sites and dimerization. Mol Immunol. 2009;46:978–990. doi: 10.1016/j.molimm.2008.09.024. [DOI] [PubMed] [Google Scholar]
- 32.Cui S, Eisenacher K, Kirchhofer A, Brzozka K, Lammens A, Lammens K, Fujita T, Conzelmann KK, Krug A, Hopfner KP. The C-terminal regulatory domain is the RNA 5′-triphosphate sensor of RIG-I. Mol Cell. 2008;29:169–179. doi: 10.1016/j.molcel.2007.10.032. [DOI] [PubMed] [Google Scholar]
- 33.Ewald SE, Lee BL, Lau L, Wickliffe KE, Shi GP, Chapman HA, Barton GM. The ectodomain of Toll-like receptor 9 is cleaved to generate a functional receptor. Nature. 2008;456:658–662. doi: 10.1038/nature07405. [DOI] [PMC free article] [PubMed] [Google Scholar]
- 34.He G, Patra A, Siegmund K, Peter M, Heeg K, Dalpke A, Richert C. Immunostimulatory CpG oligonucleotides form defined three-dimensional structures: results from an NMR study. ChemMedChem. 2007;2:549–560. doi: 10.1002/cmdc.200600262. [DOI] [PubMed] [Google Scholar]
- 35.Kim JI, Lee CJ, Jin MS, Lee CH, Paik SG, Lee H, Lee JO. Crystal structure of CD14 and its implications for lipopolysaccharide signaling. J Biol Chem. 2005;280:11347–11351. doi: 10.1074/jbc.M414607200. [DOI] [PubMed] [Google Scholar]
- 36.Shi J, Blundell TL, Mizuguchi K. FUGUE: sequence-structure homology recognition using environment-specific substitution tables and structure-dependent gap penalties. J Mol Biol. 2001;310:243–257. doi: 10.1006/jmbi.2001.4762. [DOI] [PubMed] [Google Scholar]
- 37.Laskowski RA. PDBsum: summaries and analyses of PDB structures. Nucleic Acids Res. 2001;29:221–222. doi: 10.1093/nar/29.1.221. [DOI] [PMC free article] [PubMed] [Google Scholar]
- 38.Sreerama N, Woody RW. Molecular dynamics simulations of polypeptide conformations in water: a comparison of alpha, beta, and poly(pro)II conformations. Proteins. 1999;36:400–406. [PubMed] [Google Scholar]
- 39.Dolinsky TJ, Nielsen JE, McCammon JA, Baker NA. PDB2PQR: an automated pipeline for the setup of Poisson-Boltzmann electrostatics calculations. Nucleic Acids Res. 2004;32:W665–W667. doi: 10.1093/nar/gkh381. [DOI] [PMC free article] [PubMed] [Google Scholar]
- 40.Li H, Robertson AD, Jensen JH. Very fast empirical prediction and rationalization of protein pKa values. Proteins. 2005;61:704–721. doi: 10.1002/prot.20660. [DOI] [PubMed] [Google Scholar]
- 41.Baker NA, Sept D, Joseph S, Holst MJ, McCammon JA. Electrostatics of nanosystems: application to microtubules and the ribosome. Proc Natl Acad Sci USA. 2001;98:10037–10041. doi: 10.1073/pnas.181342398. [DOI] [PMC free article] [PubMed] [Google Scholar]
- 42.Sanner MF, Olson AJ, Spehner JC. Reduced surface: an efficient way to compute molecular surfaces. Biopolymers. 1996;38:305–320. doi: 10.1002/(SICI)1097-0282(199603)38:3%3C305::AID-BIP4%3E3.0.CO;2-Y. [DOI] [PubMed] [Google Scholar]