

Abstract
Objectives
STMN1 (stathmin or oncoprotein-18) destabilizes microtubules and reorganizes cytoskeleton, and functions in cell cycle progression and cell migration. STMN1 activity is influenced by p53, p27, and the PI3K/AKT pathway. However, its prognostic significance in colon cancer is uncertain.
Methods
Utilizing 546 colorectal cancers (stage I–IV) from two independent prospective cohort studies (the Nurses' Health Study and Health Professionals Follow-up Study), STMN1 expression was detected in 297 (54%) tumors by immunohistochemistry. Cox proportional hazard models computed hazard ratios (HRs) of mortality, adjusted for clinical and tumoral features, including microsatellite instability (MSI), CpG island methylation phenotype (CIMP), LINE-1 hypomethylation, KRAS, BRAF, PIK3CA, p53, p21, p27, cyclin D1, β-catenin, fatty acid synthase, FASN, and COX-2.
Results
Five-year colorectal cancer–specific survival was 78% in STMN1-positive patients and 76% in STMN1-negative patients (log-rank P = 0.30). STMN1-positivity was not significantly associated with cancer-specific survival in univariate analysis with HR of 0.82 (95% confidence interval (CI), 0.59–1.14), which became significant in multivariate analysis (adjusted HR = 0.60; 95% CI, 0.41–0.87; P = 0.0078). Notably, the prognostic effect of obesity (body mass index, BMI≥30 kg/m2) significantly differed by STMN1 (Pinteraction = 0.005). Obesity was associated with high cancer-specific mortality among STMN1-positive patients (adjusted HR = 2.36; 95% CI, 1.18–4.69), whereas obesity was not associated with high mortality among STMN1-negative patients (adjusted HR = 0.51; 95% CI, 0.24–1.07).
Conclusions
STMN1 overexpression in colorectal cancer is independently associated with improved survival. The adverse prognostic effect of obesity was limited to patients with STMN1-positive tumors. Our findings suggest the presence of a tumor (STMN1)–host (BMI) interaction that potentially determines clinical outcome.
Introduction
STMN1 (the official symbol for stathmin or oncoprotein-18) is one of the cellular proteins that destabilize microtubules in a phosphorylation-dependent manner (1–5). By virtue of its ability to reorganize the microtubule cytoskeleton, STMN1 likely plays an important role in cell cycle progression and cell migration (4–7). STMN1 is phosphorylated in response to EGF (epidermal growth factor) in colon cancer cells (8), and can serve as a signature molecule for activation of the phosphatidylinositol 3-kinase (PI3K)/AKT pathway (9), suggesting STMN1 as a potential therapeutic target. Considering a link between cancer, excess energy balance, and the EGF-PI3K-AKT signaling pathway (10,11), STMN1 is likely involved in energy balance-related carcinogenesis. Activity of STMN1 is inhibited by cell cycle regulators, p53 (6,12,13) and p27 (CDKN1B) (7,14). STMN1 expression has been reported in various human cancers (9,15–19) including colorectal cancers (8,13,20), and has been associated with clinical outcome in breast, brain, and liver cancers (16,21,22). However, to our knowledge, no study has examined the prognostic significance of STMN1 expression in colorectal cancer.
In this study, using a large number (N = 546) of stage I–IV colorectal cancers in two independent cohort studies, we have examined the effect of tumoral STMN1 expression on patient survival. As we concurrently assessed other related molecular variables including fatty acid synthase (FASN), LINE-1 hypomethylation, p53, p21, p27, cyclin D1, KRAS, BRAF, PIK3CA, microsatellite instability (MSI), and the CpG island methylator phenotype (CIMP), we could evaluate the independent effect of STMN1 on patient survival after controlling for potential confounding by molecular events.
Methods
Study population
We utilized the databases of two independent prospective cohort studies; the Nurses' Health Study (N = 121,700 women followed since 1976) and the Health Professionals Follow-up Study (N = 51,500 men followed since 1986) (23). Every 2 years, participants have been sent follow-up questionnaires to update information on potential risk factors and to identify newly diagnosed cancer and other diseases in themselves and their first degree relatives. When a colorectal cancer incidence was reported, we sought permission to obtain medical records. Study physicians reviewed all records related to colorectal cancer, and recorded TNM and AJCC (American Joint Committee on Cancer) tumor stage and tumor location. We calculated body mass index (BMI, kg/m2), using self-reported height and weight from the biennial questionnaire that immediately preceded the diagnosis of colorectal cancer. In validation studies, self-reported anthropometric measures correlated well with measurements by trained technicians (r > 0.96) (24). We collected paraffin-embedded tissue blocks from hospitals where patients underwent tumor resections (23,25). Based on availability of tissue samples, we included a total of 546 stage I–IV colorectal cancer cases diagnosed prior to 2003. Tissue sections from all colorectal cancer cases were reviewed and confirmed by a pathologist (S.O.). Of the 546 tumors, three or more tumor tissue blocks were available in 204 cases, 2 in 217 cases, and 1 in the remaining 125 cases. We excluded cases preoperatively treated with radiation and/or chemotherapy. Tumor grade was categorized as high or low (≤50% vs. >50% glandular area). This current analysis represents a new analysis of STMN1 on the existing colorectal cancer database that have been previously characterized for CIMP, MSI, FASN, p53, KRAS, BRAF, PIK3CA, LINE-1, COX-2, and clinical outcome (23,25–27). This is analogous to novel studies using the well-described cell lines or animal models. In any of our previous studies, we have not examined STMN1 expression or the relations of STMN1 with clinical outcome and other molecular events. Moreover, we were able to control for possible confounding by a number of molecular features on which our tumor database had accumulated data. This study represents a unique novel study in terms of (1) a large sample size analyzed for STMN1; and (2) the comprehensive clinical and tissue molecular database utilized, including the long-term follow-up outcome data, CIMP, MSI, KRAS, BRAF, PIK3CA, FASN, p53, β-catenin, LINE-1 methylation, and cyclooxygenase-2 (COX-2).
For nonresponders, we searched the National Death Index to discover deaths and ascertain any diagnosis of colorectal cancer that contributed to death or was a secondary diagnosis. Approximately 96% of all incident colorectal cancer cases were identified through these methods. This study was approved by the Human Subjects Committees at Brigham and Women's Hospital and the Harvard School of Public Health. Informed consent was obtained from all study subjects.
Measurement of mortality
Patients were observed until death or June 2006, whichever came first. Ascertainment of deaths included reporting by the family or postal authorities. In addition, the names of persistent nonresponders were searched in the National Death Index. The cause of death was assigned by physicians blinded to information on lifestyle exposures and molecular changes in colorectal cancer. In rare patients who died as a result of colorectal cancer not previously reported, we obtained medical records with permission from next of kin. More than 98% of deaths in the cohorts were identified by these methods.
DNA extraction, pyrosequencing of KRAS, BRAF and PIK3CA, and MSI analysis
DNA from paraffin-embedded tissue was extracted, and PCR and Pyrosequencing targeted for KRAS codons 12 and 13 (28), BRAF codon 600 (29) and PIK3CA exons 9 and 20 were performed (30). MSI status was determined using 10 microsatellite markers (D2S123, D5S346, D17S250, BAT25, BAT26, BAT40, D18S55, D18S56, D18S67, and D18S487) (31). MSI-high was defined as the presence of instability in ≥30% of the markers, MSI-low/microsatellite stability as the presence of instability in 0–29% of the markers.
Real-Time PCR for CpG island methylation and pyrosequencing to measure LINE-1 methylation
Sodium bisulfite treatment on tumor DNA and subsequent real-time PCR (MethyLight) assays were validated and performed (32). We quantified promoter methylation in eight CIMP-specific genes (CACNA1G, CDKN2A, CRABP1, IGF2, MLH1, NEUROG1, RUNX3, and SOCS1) (26,31,33). CIMP-high was defined as ≥6/8 methylated promoters using the 8-marker CIMP panel, CIMP-low/0 as 0–5 methylated promoters, according to the previously established criteria (26). To accurately quantify relatively high LINE-1 methylation levels, we utilized Pyrosequencing as described earlier (27,34).
Immunohistochemistry for STMN1, cyclin D1, p53, p21, p27, β-catenin, COX-2, and FASN
Tissue microarrays were constructed as described earlier (23). Methods of immunohistochemical procedures and interpretation were previously described as follows: cyclin D1 (35); β-catenin (36); p21, p27, and p53 (37,38); COX-2 (23,39); FASN (39).
For STMN1 (Figure 1), antigen retrieval was performed, and deparaffinized tissue sections in Antigen Retrieval Citra Solution (Biogenex Laboratories, San Ramon, CA) were treated with microwave for 15 min. Tissue sections were incubated with 5% normal goat serum (Vector Laboratories, Burlingame, CA) in phosphate-buffered saline (60 min). Primary antibody against STMN1 (Rabbit polyclonal to STMN1, 1:50 dilution; Cell Signaling, Danvers, MA) was applied, and the slides were maintained overnight at room temperature. Next, we applied an anti-rabbit IgG antibody (Vector Laboratories) for 30 min, followed by an avidin–biotin complex conjugate (Vector Laboratories) for 30 min. Slides were developed using diaminobenzidine (5 min) and methyl-green counterstain. Among the 546 tumors, 193 tumors showed 0–9% of tumor cells staining, 53 showed 10–19% of tumor cells staining, 58 showed 20–29% of tumor cells staining, 120 showed 30–49% of tumor cells staining, and 122 showed ≥50% of tumor cells staining. In our initial exploratory analysis, the adjusted HR for colorectal cancer-specific mortality in each category (compared with tumors with 0–9% positive cells as a referent) was as follows: 0.90 (95% CI, 0.44–1.87) in 10–19% positive tumors; 0.63 (95% CI, 0.31–1.28) in 20–29% positive tumors; 0.36 (95% CI, 0.19–0.68) in 30–49% positive tumors; 0.47 (95% CI, 0.27–0.82) in ≥50% positive tumors. Thus, for further analysis, STMN1 positivity was defined as the presence of at least weak cytoplasmic staining in ≥20% of tumor cells. Either absent staining or staining in < 20% of tumor cells was interpreted as negative.
Figure 1.
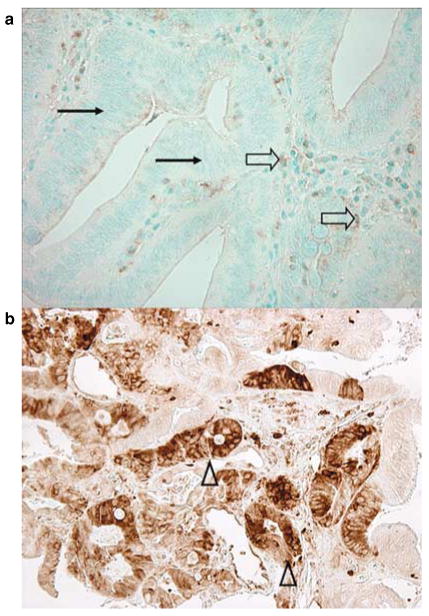
STMN1 expression in colorectal cancer cells. (a) Negative for STMN1 expression in colorectal cancer (arrows). Weak staining in inflammatory cells serves as an internal positive control (empty arrows). (b) Positive for STMN1 expression in colorectal cancer (arrowheads).
Appropriate positive and negative controls were included in each run of immunohistochemistry. All immunohistochemically stained slides for STMN1 were interpreted by one of the investigators (K.N.) unaware of other data. A random sample of 123 tumors were re-examined by a second observer (Y.B.) unaware of other data. The concordance between the two observers was 85% (κ = 0.69; 95% CI, 0.57–0.82; P < 0.0001), indicating substantial agreement.
Statistical analysis
We used stage-stratified (matched) conditional Cox proportional hazard models to compute hazard ratios (HRs) of death according to STMN1 status, adjusted for age at diagnosis, sex, year of diagnosis, BMI (< 30 vs. ≥30 kg/m2), family history of colorectal cancer in any first degree relative (present vs. absent), tumor location (right vs. left colon vs. rectum), grade (high vs. low), FASN, MSI (high vs. low/microsatellite stability), CIMP (high vs. low/0), LINE-1 methylation, KRAS, BRAF, PIK3CA, β-catenin, p53, p21, p27, cyclin D1, and COX-2. For analyses of colorectal cancer-specific mortality, death as a result of colorectal cancer was the primary end point and deaths as a result of other causes were censored. The proportionality of hazards assumption was satisfied by evaluating time-dependent variables, which were the cross product of the STMN1 variable and survival time (P = 0.10 for colon cancer-specific mortality; P = 0.62 for overall mortality). To adjust for potential confounding, age, year of diagnosis, and LINE-1 methylation were used as continuous variables, and all other covariates were used as categorical variables. Tumor stage (I, IIA, IIB, IIIA, IIIB, IIIC, IV) was used as a stratifying (matching) variable. For cases with missing information in covariates (including BMI (3.7% missing), tumor location (0.9% missing), tumor grade (0.4% missing), MSI (0.4% missing), KRAS (0.2% missing), BRAF (2.0% missing), β-catenin (6.8% missing), p53 (0.4% missing), p21 (1.8% missing), p27 (3.8% missing), cyclin D1 (3.3% missing) and FASN (0.7% missing)), we included those cases in a majority category, to minimize the number of “missing” indicator variables and maximize the efficiency of multivariate Cox regression analyses. We confirmed that excluding cases with missing information in any of the covariates did not substantially alter results (data not shown). An interaction was assessed by including the cross product of the STMN1 variable and another variable of interest (without data-missing cases) in a multivariate Cox model, and the likelihood ratio test was performed. P values were conservatively interpreted, considering multiple hypotheses testing on potential interactions. To assess an interaction between STMN1 and stage, we dichotomized tumor stage (I–II vs. III–IV) as well as treated stage as a linear ordinal variable (I–IV). To assess an interaction between STMN1 and tumor location, we dichotomized tumor location as rectum vs. colon, because adjusted HRs were very similar between right colon and left colon (see Figure 2).
Figure 2.

STMN1 status and colorectal cancer mortality in various strata. Loge (adjusted HRs) with 95% CI for colorectal cancer–specific mortality in STMN1 + tumors (vs. STMN–tumors) are shown. CI, confidence interval; CIMP, CpG island methylator phenotype; HPFS, Health Professionals Follow-up Study; HR, hazard ratio; NHS, Nurses' Health Study.
The Kaplan–Meier method was used to describe the distribution of colon cancer-specific and overall survival time, and the log-rank test was performed. The χ2 test was used to examine an association of STMN1 with any of the categorical variables. The t-test assuming unequal variances was performed to compare mean age and mean LINE-1 methylation level. All analyses used SAS version 9.1 (SAS Institute, Cary, NC) and all P values were two-sided.
Results
STMN1 expression in colorectal cancer and patient survival
Among 546 patients with stage I–IV colorectal cancer, STMN1 overexpression was observed in 297 (54%) tumors. Examples of STMN1 immunohistochemistry are shown in Figure 1. We assessed clinical and molecular characteristics of colorectal cancers, according to tumoral STMN1 status (Table 1). Compared with STMN1-negative tumors, STMN1-positive tumors were more likely to show PIK3CA mutation (P = 0.018), p53 negativity (P = 0.044), and expressions of p21 (P = 0.002) and fatty acid synthase (FASN, P = 0.015). STMN1 expression was not significantly associated with mucinous component, signet ring cells or tumor differentiation.
Table 1. Clinical and molecular characteristics according to STMN1 status in colorectal cancer.
| Clinical or molecular feature | Cases, N | STMN1 | P value | |
|---|---|---|---|---|
| Negative, n | Positive, n | |||
| Total | 546 | 249 | 297 | |
| Sex | 0.69 | |||
| Male (HPFS) | 223 (41%) | 104 (42%) | 119 (40%) | |
| Female (NHS) | 323 (59%) | 145 (58%) | 178 (60%) | |
| Mean age ± s.d. | 66.1 ± 8.5 | 66.0 ± 8.2 | 66.2 ± 8.7 | 0.73 |
| Body mass index (BMI, kg/m2) | 0.56 | |||
| <25 | 229 (44%) | 99 (42%) | 130 (46%) | |
| 25–29 | 207 (40%) | 100 (42%) | 107 (38%) | |
| ≥30 | 84 (16%) | 39 (16%) | 45 (16%) | |
| Family history of colorectal cancer in any first-degree relative | 0.86 | |||
| Absent | 412 (75%) | 187 (75%) | 225 (76%) | |
| Present | 134 (25%) | 62 (25%) | 72 (24%) | |
| Year of diagnosis | 0.064 | |||
| Prior to 1995 | 231 (42%) | 116 (47%) | 115 (39%) | |
| 1995–2002 | 315 (58%) | 133 (53%) | 182 (61%) | |
| Tumor location | 0.41 | |||
| Right (cecum to transverse colon) | 243 (45%) | 103 (42%) | 140 (47%) | |
| Left colon (splenic flexure to sigmoid) | 179 (33%) | 83 (34%) | 96 (32%) | |
| Rectum | 119 (22%) | 59 (24%) | 60 (20%) | |
| Tumor stage | 0.88 | |||
| I | 145 (27%) | 62 (25%) | 83 (28%) | |
| II | 174 (32%) | 82 (33%) | 92 (31%) | |
| III | 163 (30%) | 75 (30%) | 88 (30%) | |
| IV | 64 (12%) | 30 (12%) | 34 (11%) | |
| Mucinous component | 0.74 | |||
| 0% | 288 (60%) | 132 (60%) | 156 (60%) | |
| 1–49% | 127 (27%) | 56 (25%) | 71 (27%) | |
| ≥50% | 64 (13%) | 32 (15%) | 32 (12%) | |
| Signet-ring cell component | 0.64 | |||
| 0% | 416 (92%) | 195 (93%) | 221 (91%) | |
| 1–49% | 29 (6.4%) | 11 (5.3%) | 18 (7.4%) | |
| ≥50% | 7 (1.6%) | 3 (1.4%) | 4 (1.7%) | |
| Tumor differentiation | 0.13 | |||
| Well to moderate | 499 (92%) | 233 (94%) | 266 (90%) | |
| Poor (excluding undifferentiated tumors) | 31 (5.7%) | 12 (4.8%) | 19 (6.4%) | |
| Undifferentiated | 14 (2.6%) | 3 (1.2%) | 11 (3.7%) | |
| MSI | 0.20 | |||
| MSI-low/MSS | 462 (85%) | 216 (87%) | 246 (83%) | |
| MSI-high | 82 (15%) | 32 (13%) | 50 (17%) | |
| CIMP | 0.10 | |||
| CIMP-low/0 | 463 (85%) | 218 (88%) | 245 (82%) | |
| CIMP-high | 83 (15%) | 31 (12%) | 52 (18%) | |
| Mean LINE-1 methylation (%) | 60.7±9.7 | 61.4±10.0 | 60.2±9.5 | 0.17 |
| BRAF mutation | 0.80 | |||
| (−) | 456 (85%) | 209 (86%) | 247 (85%) | |
| (+) | 79 (15%) | 35 (14%) | 44 (15%) | |
| KRAS mutation | 0.82 | |||
| (−) | 342 (63%) | 155 (62%) | 187 (63%) | |
| (+) | 203 (37%) | 94 (38%) | 109 (37%) | |
| PIK3CA mutation | 0.018 | |||
| (−) | 409 (83%) | 199 (87%) | 210 (79%) | |
| (+) | 84 (17%) | 29 (13%) | 55 (21%) | |
| β-catenin scorea | 0.69 | |||
| Low (0–2) | 318 (62%) | 139 (61%) | 179 (63%) | |
| High (3–5) | 191 (38%) | 87 (39%) | 104 (37%) | |
| p53 expression | 0.044 | |||
| (−) | 308 (57%) | 152 (61%) | 156 (53%) | |
| (+) | 236 (43%) | 96 (39%) | 140 (47%) | |
| p21 (CDKN1A) | 0.002 | |||
| Expressed | 102 (19%) | 32 (13%) | 70 (24%) | |
| Lost | 434 (81%) | 211 (87%) | 223 (76%) | |
| p27 (CDKN1B) | 0.10 | |||
| Nuclear expression | 109 (21%) | 41 (18%) | 68 (23%) | |
| Cytoplasmic expression or loss of expression | 416 (79%) | 193 (82%) | 223 (77%) | |
| Cyclin D1 | 0.74 | |||
| (−) | 243 (46%) | 111 (47%) | 132 (45%) | |
| (+) | 285 (54%) | 126 (53%) | 159 (55%) | |
| Fatty acid synthase (FASN) | 0.015 | |||
| (−) | 468 (86%) | 223 (90%) | 245 (83%) | |
| (+) | 74 (14%) | 24 (9.7%) | 50 (17%) | |
| Cyclooxygenase-2 (COX-2) | 0.038 | |||
| (−) | 84 (15%) | 47 (19%) | 37 (12%) | |
| (+) | 462 (85%) | 202 (81%) | 260 (88%) | |
(%) indicates the proportion of tumors with a specific clinical or molecular feature in STMN1(−) (or STMN1 +) tumors.
CIMP, CpG island methylator phenotype; HPFS, Health Professionals Follow-up Study; LINE-1, long interspersed nucleotide element-1; MSI, microsatellite instability; MSS, microsatellite stable; NHS, Nurses' Health Study.
β-catenin score was calculated as described earlier (36).
During follow-up, there were 236 deaths, including 149 colorectal cancer-specific deaths. We assessed the influence of STMN1 on patient survival. Five-year colorectal cancer-specific survival was 78% in STMN1-positive patients and 76% in STMN1-negative patients (log-rank P = 0.30), and five-year overall survival was 73% in STMN1-positive patients and 71% in STMN1-negative patients (log-rank P = 0.68). In univariate Cox regression analysis, compared with STMN1-negative patients, STMN1-positive patients showed a non-significant trend towards a lower cancer-specific mortality (hazard ratio (HR) 0.82; 95% confidence interval (CI), 0.59–1.14). In the multivariate Cox model adjusted for other potential predictors of outcome (including FASN expression), STMN1 positivity was associated with a significantly lower colorectal cancer-specific mortality (multivariate HR 0.60; 95% CI, 0.41–0.87; P = 0.0078) (Table 2). The greater effect of STMN1 in multivariate analysis was principally due to adjusting for tumor stage, LINE-1 methylation, p53 and p21. When we adjusted for only those variables, adjusted HR for colorectal cancer-specific mortality was 0.66 (95% CI, 0.46–0.94). No other major confounder was present.
Table 2. STMN1 expression in colorectal cancer and patient mortality.
| Total (n) | Colorectal cancer–specific mortality | Overall mortality | |||||||
|---|---|---|---|---|---|---|---|---|---|
| Deaths/person-years | Univariate HR (95% CI) |
Stage-matched HR (95% CI) |
Multivariate HR (95% CI) |
Deaths/person-years | Univariate HR (95% CI) |
Stage-matched HR (95% CI) |
Multivariate HR (95% CI) |
||
| All cases | |||||||||
| STMN1(−) | 249 (46%) | 74/2031 | 1 (referent) | 1 (referent) | 1 (referent) | 114/2031 | 1 (referent) | 1 (referent) | 1 (referent) |
| STMN1(+) | 297 (54%) | 73/2277 | 0.84 (0.61–1.16) |
0.82 (0.59–1.14) |
0.60 (0.41–0.87) |
122/2277 | 0.95 (0.73–1.22) |
0.92 (0.71–1.19) |
0.77 (0.57–1.03) |
| P value | 0.30 | 0.23 | 0.0078 | 0.68 | 0.52 | 0.075 | |||
| Nonobese cases | |||||||||
| STMN(−) | 210 (46%) | 62/1728 | 1 (referent) | 1 (referent) | 1 (referent) | 96/1728 | 1 (referent) | 1 (referent) | 1 (referent) |
| STMN1(+) | 252 (54%) | 60/1870 | 0.82 (0.57–1.17) |
0.68 (0.47–0.98) |
0.47 (0.31–0.73) |
102/1870 | 0.96 (0.73–1.27) |
0.84 (0.63–1.12) |
0.69 (0.50–0.96) |
| P value | 0.27 | 0.040 | 0.0008 | 0.77 | 0.23 | 0.027 | |||
CI, confi dence interval; HR, hazard ratio.
The multivariate, stage-matched conditional Cox regression model included age, year of diagnosis, sex, family history of colorectal cancer, body mass index (BMI), tumor location, stage, grade, KRAS, BRAF, PIK3CA, p53, p21, p27, cyclin D1, β-catenin, COX-2, FASN, LINE-1 methylation, microsatellite instability (MSI), and CpG island methylator phenotype (CIMP).
Modifying effect of BMI on the relation between STMN1 and mortality
STMN1 has been shown to be a signature molecule for PTEN-altered, AKT-activated breast cancers (9). The PI3K/AKT signaling pathway is considered to play an important role in the pathogenetic link between excess energy balance and cancer (11). Thus, we examined a potential modifying effect of BMI or PIK3CA mutation on the relation between STMN1 and patient survival. There was no significant modifying effect of PIK3CA on the relation between STMN1 and mortality (Figure 2). In contrast, there was a significant modifying effect of BMI on the relation between STMN1 and survival (Table 3). The beneficial effect of STMN1 positivity on cancer-specific mortality appeared stronger among normal-weight patients (BMI < 25 kg/m2; adjusted HR 0.31; 95% CI, 0.17–0.56) as compared with overweight patients (BMI 25–30 kg/m2; adjusted HR 0.56; 95% CI, 0.29–1.08), whereas there was no beneficial effect of STMN1 positivity among obese patients (BMI ≥ 30 kg/m2; adjusted HR 1.94; 95% CI, 0.77–4.90) (Pinteraction = 0.005).
Table 3. Patient mortality in STMN1(+) colorectal cancer compared with STMN1(-) tumor in strata of BMI category.
| BMI category | Colorectal cancer–specific mortality in STMN1 + tumors (vs. STMN1(−) tumors as a referent) | Overall mortality in STMN1 + tumors (vs. S(−) tumors as a referent) | ||||
|---|---|---|---|---|---|---|
| No. of deaths/cases (STMN1 + vs. −) | Stage-matched HR (95% CI) | Multivariate HR (95% CI) | No. of deaths/cases (STMN1 + vs. −) | Stage-matched HR (95% CI) | Multivariate HR (95% CI) | |
| <25 kg/m2 | 34/130 vs. 28/99 | 0.49 (0.29–0.84) | 0.31 (0.17–0.56) | 61/130 vs. 43/99 | 0.75 (0.50–1.13) | 0.56 (0.36–0.86) |
| 25–30 kg/m2 | 21/107 vs. 28/100 | 0.79 (0.44–1.42) | 0.56 (0.29–1.08) | 34/107 vs. 46/100 | 0.80 (0.51–1.26) | 0.65 (0.40–1.06) |
| ≥30 kg/m2 | 13/45 vs. 12/39 | 1.55 (0.68–3.49) | 1.94 (0.77–4.90) | 20/45 vs. 18/39 | 1.41 (0.73–2.74) | 1.70 (0.82–3.52) |
BMI, body mass index; CI, confi dence interval; HR, hazard ratio.
The multivariate Cox model included the STMN1 variable stratified by BMI category, age, year of diagnosis, sex, family history of colorectal cancer, tumor location, stage, grade, KRAS, BRAF, PIK3CA, p53, p21, p27, cyclin D1, β-catenin, COX-2, FASN, LINE-1 methylation, microsatellite instability (MSI), and CpG island methylator phenotype (CIMP). SAS codes to stratify the STMN1 variable by BMI category are available upon request.
P for interaction between STMN1 and BMI = 0.005 (when the BMI category was used as linear ordinal variable), and 0.011 (when BMI was used as a dichotomous variable; < 30 vs. ≥30 kg/m2) in analysis of cancer-specific mortality.
Of note, when we excluded obese patients, the overall beneficial effect of STMN1 positivity on cancer-specific mortality was even more apparent (Table 2), compared with the analysis including all obese and nonobese cases. STMN1 positivity was significantly associated with a low cancer-specific mortality in stage-matched Cox regression (HR 0.68; 95% CI, 0.47–0.98; P = 0.040) and the multivariate analysis (adjusted HR 0.47; 95% CI, 0.31–0.73; P = 0.0008).
Effect of obesity on survival in strata of STMN1
Considering the significant interaction between STMN1 and patient BMI, we examined the effect of BMI on patient mortality in strata of STMN1 status (Table 4). Among STMN1-positive cases, obese patients (BMI ≥30 kg/m2) experienced a significantly higher cancer-specific mortality (multivariate HR 2.36; 95% CI, 1.18–4.69) compared with nonobese patients (BMI < 30 kg/m2). In contrast, BMI was not significantly related with survival among STMN1-negative cases.
Table 4. Effect of BMI on mortality among colorectal cancer patients in strata of STMN1 status.
| Colorectal cancer–specific mortality | Overall mortality | |||||
|---|---|---|---|---|---|---|
| No. of deaths/cases | Stage-matched HR (95% CI) | Multivariate HR (95% CI) | No. of deaths/cases | Stage-matched HR (95% CI) | Multivariate HR (95% CI) | |
| STMN1 (−) | ||||||
| BMI <30 kg/m2 | 56/199 | 1 (referent) | 1 (referent) | 89/199 | 1 (referent) | 1 (referent) |
| BMI ≥30 kg/m2 | 12/39 | 0.95 (0.50–1.80) | 0.51 (0.24–1.07) | 18/39 | 0.95 (0.56–1.61) | 0.71 (0.40–1.28) |
| STMN1 (+) | ||||||
| BMI <30 kg/m2 | 55/237 | 1 (referent) | 1 (referent) | 95/237 | 1 (referent) | 1 (referent) |
| BMI ≥30 kg/m2 | 13/45 | 2.21 (1.18–4.15) | 2.36 (1.18–4.69) | 20/45 | 1.67 (1.01–2.75) | 1.93 (1.13–3.32) |
BMI, body mass index; CI, confi dence interval; HR, hazard ratio.
The multivariate Cox model included the BMI variable stratifi ed by STMN1 category, age, year of diagnosis, sex, family history of colorectal cancer, tumor location, stage, grade, KRAS, BRAF, PIK3CA, p53, p21, p27, cyclin D1, β-catenin, COX-2, FASN, LINE-1 methylation, microsatellite instability (MSI), CpG island methylator phenotype (CIMP), and STMN1. SAS codes to stratify the BMI variable by STMN1 category are available upon request.
Stratified analysis of STMN1 and mortality
We examined the influence of STMN1 positivity on cancer-specific mortality among the nonobese patients across strata of other potential predictors of survival, including age, sex, year of diagnosis, family history of colorectal cancer, tumor location, stage, FASN, MSI, CIMP, LINE-1 methylation, KRAS, BRAF, PIK3CA, β-catenin, p53, p21, p27, cyclin D1, and COX-2 (Figure 2, not all strata are shown). There was no evidence for significant effect modification by any of the variables examined (all Pinteraction >0.13). Notably, the effect of STMN1 did not significantly differ between the two independent cohort studies (Pinteraction = 0.65), or between FASN-positive and FASN-negative tumors (Pinteraction = 0.66).
Discussion
We conducted this study to examine the relation between stathmin (STMN1, the official symbol) expression and patient survival in a large number of colorectal cancers. STMN1 is considered to play an important role in the reorganization of microtubule cytoskeleton, cell cycle progression and cell migration (4–7). Accordingly, STMN1 alteration has been implicated in a carcinogenic process (4–7,12–14). We found that STMN1 expression was associated with longer survival, independent of patient characteristics and other related molecular variables including p53, p21, p27, KRAS, BRAF, LINE-1 methylation, MSI, and the CIMP. This beneficial effect of STMN1 expression was limited to nonobese patients. Our results indicate that STMN1 expression marks colon cancer with indolent biological behavior, particularly among nonobese patients.
Clinical outcome or molecular changes in colorectal cancer have been extensively investigated (40–49). It is very common to consider that the presence of oncogene activation (or tumor suppressor inactivation) should imply aggressive tumor behavior. However, this preconception does not always hold true. Colon cancers develop through accumulation of multiple genetic and epigenetic events. Some tumors activate STMN1, whereas others do not. To acquire malignant features, STMN1-inactive tumors need to have other aberrations which may confer more aggressive behavior than STMN1 activation does. As an example, MSI has been associated with both tumor suppressor inactivation (such as TGFBR2 and BAX) and longer patient survival (50). This is likely because non-MSI tumors have more detrimental aberrations. As another example, we have shown that FASN oncoprotein activation is significantly associated with good outcome in nonobese individuals (25). In survival analysis, an aberration of a given oncoprotein (such as STMN1) can mark a subset of tumors with worse or better outcome, depending on the entire molecular signatures in tumor cells and host environment (as shown in our current study). The aforementioned preconception that oncogene activation (or anti-oncogene inactivation) has to cause poor outcome might have caused serious publication bias, because reports consistent with this preconception have been regarded favorably during journals' decision process, whereas reports of the opposite conclusion have been treated unfavorably.
Interestingly, we found a potential modifying effect of BMI on the relation between STMN1 and clinical outcome in colon cancer. Specifically, STMN1 positivity appeared to confer a good prognosis in nonobese patients, but not in obese patients with BMI ≥30 kg/m2. STMN1 is phosphorylated in response to EGF (epidermal growth factor) in colon cancer cells (8), and can serve as a signature molecule for activation of the PI3K/AKT pathway (9). Given a potential link between excess energy balance and activation of the EGF-PI3K-AKT pathway (10,11), energy balance may be important in determining biological behavior in STMN1-positive tumors. Obesity and excess energy balance have been associated with increased risks of colon cancer and adenoma as well as colon cancer recurrence and mortality (51–54). Our data suggest that obesity and excess energy balance are specifically detrimental among patients with STMN1-positive tumors, possibly due to activation of the PI3K-AKT pathway by excess energy balance. Thus, it is possible that influence of STMN1 overexpression differs substantially according to the host milieu in which the overexpression occurs. These intriguing findings need to be confirmed by independent cohorts in the future.
Our current study has several advantages. In addition to its large sample size, our well-characterized tumor database allowed us to examine a potential interaction between STMN1 and any of the molecular events that have been described in colorectal cancer, including MSI, CIMP, LINE-1 hypomethylation, and alterations of KRAS, BRAF, PIK3CA, p53, p21, p27, cyclin D1, COX-2, FASN, and β-catenin. Our large sample size enabled us to perform most subset analyses with adequate power. We were also able to control for potential confounding by those molecular variables, which were potential confounders in survival analysis. Accordingly, we could demonstrate an effect of STMN1 on patient survival, independent of clinical and other tumoral characteristics.
As one limitation in our cohort studies, data on cancer treatment were limited. Nonetheless, it is unlikely that chemotherapy use differed according to tumoral STMN1 status, because such data were not available to patients or treating physicians. In addition, beyond cause of mortality, data on cancer recurrences were not available in these cohorts. Nonetheless, given the median survival for metastatic colon cancer was approximately 10–12 months during much of the time period of this study, colon cancer-specific survival should be a reasonable surrogate for cancer-specific outcomes.
In summary, our large cohort study suggests that STMN1 expression is independently associated with good prognosis in colon cancer. Our findings may have considerable clinical implications. Future studies are needed to confirm this association as well as to elucidate exact mechanisms by which STMN1 affects tumor behavior.
Study Highlights.
WHAT IS CURRENT KNOWLEDGE
Obesity and excess energy balance are associated with inferior survival among colon cancer patients.
The phosphatidylinositol 3-kinase (PI3K/AKT) signaling pathway mediates energy balance–related carcinogenesis.
The microtubule-related protein stathmin or oncoprotein-18 (STMN1) is downstream of the PI3K/AKT pathway.
STMN1 plays an important role in cell cycle progression and cell migration.
WHAT IS NEW HERE
STMN1 expression in colorectal cancer is associated with patient survival.
This association between STMN1 expression and prognosis is modified by patient body mass index.
Tumoral STMN1 expression is associated with improved survival among nonobese patients.
An adverse effect of obesity on patient survival is observed only among STMN1-positive patients.
Acknowledgments
Financial support: This work was supported by the US National Institute of Health (P01 CA87969 to S. Hankinson, P01 CA55075 to W. Willett, P50 CA127003 to C.S.F., and K07 CA122826 to S.O.) and in part by the Bennett Family Fund and the Entertainment Industry Foundation through National Colorectal Cancer Research Alliance (NCCRA). K.N. was supported by a fellowship grant from the Japan Society for Promotion of Science. The content is solely the responsibility of the authors and does not necessarily represent the official views of NCI or NIH. Funding agencies did not have any role in the design of the study; the collection, analysis, or interpretation of the data; the decision to submit the article for publication; or the writing of the article.
We deeply thank the Nurses' Health Study and Health Professionals Follow-up Study cohort participants; hospitals and pathology departments throughout the US for providing us with tumor tissue materials; Frank Speizer; Walter Willett; Susan Hankinson; Graham Colditz; Meir Stampfer; and many other staff members who implemented and maintained the cohort studies.
Footnotes
Guarantor of the article: Shuji Ogino, MD, PhD.
Specific author contributions: Conception and design: Shuji Ogino and Charles S. Fuchs; Funding support: Shuji Ogino, Edward L. Giovannucci, and Charles S. Fuchs; administrative support: Gregory J. Kirkner, Edward L. Giovannucci, and Charles S. Fuchs; data collection: Shuji Ogino, Katsuhiko Nosho, Yoshifumi Baba, Shoko Kure, Kaori Shima, Natsumi Irahara, Saori Toyoda, Li Chen, Gregory J. Kirkner, Edward L. Giovannucci, and Charles S. Fuchs; data analysis: Shuji Ogino, Katsuhiko Nosho, Yoshifumi Baba, Shoko Kure, Kaori Shima, Natsumi Irahara, Saori Toyoda, Li Chen, Gregory J. Kirkner, Brian M. Wolpin, Andrew T. Chan, Edward L. Giovannucci, and Charles S. Fuchs; writing of the article: Shuji Ogino, Katsuhiko Nosho, Yoshifumi Baba, Brian M. Wolpin, Edward L. Giovannucci, and Charles S. Fuchs; Final approval of the article: Shuji Ogino, Katsuhiko Nosho, Yoshifumi Baba, Shoko Kure, Kaori Shima, Natsumi Irahara, Saori Toyoda, Li Chen, Gregory J. Kirkner, Brian M. Wolpin, Andrew T. Chan, Edward L. Giovannucci, and Charles S. Fuchs.
Potential competing interests: None.
References
- 1.Steinmetz MO. Structure and thermodynamics of the tubulin-stathmin interaction. J Struct Biol. 2007;158:137–47. doi: 10.1016/j.jsb.2006.07.018. [DOI] [PubMed] [Google Scholar]
- 2.Belmont LD, Mitchison TJ. Identification of a protein that interacts with tubulin dimers and increases the catastrophe rate of microtubules. Cell. 1996;84:623–31. doi: 10.1016/s0092-8674(00)81037-5. [DOI] [PubMed] [Google Scholar]
- 3.Nogales E, Wang HW. Structural intermediates in microtubule assembly and disassembly: how and why? Curr Opin Cell Biol. 2006;18:179–84. doi: 10.1016/j.ceb.2006.02.009. [DOI] [PubMed] [Google Scholar]
- 4.Cassimeris L. The oncoprotein 18/stathmin family of microtubule destabilizers. Curr Opin Cell Biol. 2002;14:18–24. doi: 10.1016/s0955-0674(01)00289-7. [DOI] [PubMed] [Google Scholar]
- 5.Rubin CI, Atweh GF. The role of stathmin in the regulation of the cell cycle. J Cell Biochem. 2004;93:242–50. doi: 10.1002/jcb.20187. [DOI] [PubMed] [Google Scholar]
- 6.Johnsen JI, Aurelio ON, Kwaja Z, et al. p53-mediated negative regulation of stathmin/Op18 expression is associated with G(2)/M cell-cycle arrest. Int J Cancer. 2000;88:685–91. doi: 10.1002/1097-0215(20001201)88:5<685::aid-ijc1>3.0.co;2-z. [DOI] [PubMed] [Google Scholar]
- 7.Baldassarre G, Belletti B, Nicoloso MS, et al. p27(Kip1)-stathmin interaction influences sarcoma cell migration and invasion. Cancer Cell. 2005;7:51–63. doi: 10.1016/j.ccr.2004.11.025. [DOI] [PubMed] [Google Scholar]
- 8.Ji H, Baldwin GS, Burgess AW, et al. Epidermal growth factor induces serine phosphorylation of stathmin in a human colon carcinoma cell line (LIM 1215) J Biol Chem. 1993;268:13396–405. [PubMed] [Google Scholar]
- 9.Saal LH, Johansson P, Holm K, et al. Poor prognosis in carcinoma is associated with a gene expression signature of aberrant PTEN tumor suppressor pathway activity. Proc Natl Acad Sci USA. 2007;104:7564–9. doi: 10.1073/pnas.0702507104. [DOI] [PMC free article] [PubMed] [Google Scholar]
- 10.Manning BD, Cantley LC. AKT/PKB signaling: navigating downstream. Cell. 2007;129:1261–74. doi: 10.1016/j.cell.2007.06.009. [DOI] [PMC free article] [PubMed] [Google Scholar]
- 11.Engelman JA, Luo J, Cantley LC. The evolution of phosphatidylinositol 3-kinases as regulators of growth and metabolism. Nat Rev Genet. 2006;7:606–19. doi: 10.1038/nrg1879. [DOI] [PubMed] [Google Scholar]
- 12.Ahn J, Murphy M, Kratowicz S, et al. Down-regulation of the stathmin/Op18 and FKBP25 genes following p53 induction. Oncogene. 1999;18:5954–8. doi: 10.1038/sj.onc.1202986. [DOI] [PubMed] [Google Scholar]
- 13.Liu Z, Lu H, Shi H, et al. PUMA overexpression induces reactive oxygen species generation and proteasome-mediated stathmin degradation in colorectal cancer cells. Cancer Res. 2005;65:1647–54. doi: 10.1158/0008-5472.CAN-04-1754. [DOI] [PubMed] [Google Scholar]
- 14.Iancu-Rubin C, Atweh GF. p27(Kip1) and stathmin share the stage for the first time. Trends Cell Biol. 2005;15:346–8. doi: 10.1016/j.tcb.2005.05.008. [DOI] [PubMed] [Google Scholar]
- 15.Friedrich B, Gronberg H, Landstrom M, et al. Differentiation-stage specific expression of oncoprotein 18 in human and rat prostatic adenocarcinoma. Prostate. 1995;27:102–9. doi: 10.1002/pros.2990270207. [DOI] [PubMed] [Google Scholar]
- 16.Yuan RH, Jeng YM, Chen HL, et al. Stathmin overexpression cooperates with p53 mutation and osteopontin overexpression, and is associated with tumour progression, early recurrence, and poor prognosis in hepatocellular carcinoma. J Pathol. 2006;209:549–58. doi: 10.1002/path.2011. [DOI] [PubMed] [Google Scholar]
- 17.Singer S, Ehemann V, Brauckhoff A, et al. Protumorigenic overexpression of stathmin/Op18 by gain-of-function mutation in p53 in human hepatocarcinogenesis. Hepatology. 2007;46:759–68. doi: 10.1002/hep.21736. [DOI] [PubMed] [Google Scholar]
- 18.Brattsand G. Correlation of oncoprotein 18/stathmin expression in human breast cancer with established prognostic factors. Br J Cancer. 2000;83:311–8. doi: 10.1054/bjoc.2000.1264. [DOI] [PMC free article] [PubMed] [Google Scholar]
- 19.Curmi PA, Nogues C, Lachkar S, et al. Overexpression of stathmin in breast carcinomas points out to highly proliferative tumours. Br J Cancer. 2000;82:142–50. doi: 10.1054/bjoc.1999.0891. [DOI] [PMC free article] [PubMed] [Google Scholar]
- 20.Abal M, Obrador-Hevia A, Janssen KP, et al. APC inactivation associates with abnormal mitosis completion and concomitant BUB1B/MAD2L1 up-regulation. Gastroenterology. 2007;132:2448–58. doi: 10.1053/j.gastro.2007.03.027. [DOI] [PubMed] [Google Scholar]
- 21.Golouh R, Cufer T, Sadikov A, et al. The prognostic value of Stathmin-1, S100A2, and SYK proteins in ER-positive primary breast cancer patients treated with adjuvant tamoxifen monotherapy: an immunohistochemical study. Breast Cancer Res Treat. 2008;110:317–26. doi: 10.1007/s10549-007-9724-3. [DOI] [PubMed] [Google Scholar]
- 22.Ngo TT, Peng T, Liang XJ, et al. The 1p-encoded protein stathmin and resistance of malignant gliomas to nitrosoureas. J Natl Cancer Inst. 2007;99:639–52. doi: 10.1093/jnci/djk135. [DOI] [PubMed] [Google Scholar]
- 23.Chan AT, Ogino S, Fuchs CS. Aspirin and the Risk of Colorectal Cancer in Relation to the Expression of COX-2. New Engl J Med. 2007;356:2131–42. doi: 10.1056/NEJMoa067208. [DOI] [PubMed] [Google Scholar]
- 24.Rimm EB, Stampfer MJ, Colditz GA, et al. Validity of self-reported waist and hip circumferences in men and women. Epidemiology. 1990;1:466–73. doi: 10.1097/00001648-199011000-00009. [DOI] [PubMed] [Google Scholar]
- 25.Ogino S, Nosho K, Meyerhardt JA, et al. Cohort study of fatty acid synthase expression and patient survival in colon cancer. J Clin Oncol. 2008;26:5713–20. doi: 10.1200/JCO.2008.18.2675. [DOI] [PMC free article] [PubMed] [Google Scholar]
- 26.Ogino S, Kawasaki T, Kirkner GJ, et al. Evaluation of markers for CpG island methylator phenotype (CIMP) in colorectal cancer by a large population-based sample. J Mol Diagn. 2007;9:305–14. doi: 10.2353/jmoldx.2007.060170. [DOI] [PMC free article] [PubMed] [Google Scholar]
- 27.Ogino S, Nosho K, Kirkner GJ, et al. A cohort study of tumoral LINE-1 hypomethylation and prognosis in colon cancer. J Natl Cancer Inst. 2008;100:1734–8. doi: 10.1093/jnci/djn359. [DOI] [PMC free article] [PubMed] [Google Scholar]
- 28.Ogino S, Kawasaki T, Brahmandam M, et al. Sensitive sequencing method for KRAS mutation detection by Pyrosequencing. J Mol Diagn. 2005;7:413–21. doi: 10.1016/S1525-1578(10)60571-5. [DOI] [PMC free article] [PubMed] [Google Scholar]
- 29.Ogino S, Kawasaki T, Kirkner GJ, et al. CpG island methylator phenotype-low (CIMP-low) in colorectal cancer: possible associations with male sex and KRAS mutations. J Mol Diagn. 2006;8:582–8. doi: 10.2353/jmoldx.2006.060082. [DOI] [PMC free article] [PubMed] [Google Scholar]
- 30.Nosho K, Kawasaki T, Ohnishi M, et al. PIK3CA mutation in colorectal cancer: relationship with genetic and epigenetic alterations. Neoplasia. 2008;10:534–41. doi: 10.1593/neo.08336. [DOI] [PMC free article] [PubMed] [Google Scholar]
- 31.Ogino S, Cantor M, Kawasaki T, et al. CpG island methylator phenotype (CIMP) of colorectal cancer is best characterised by quantitative DNA methylation analysis and prospective cohort studies. Gut. 2006;55:1000–6. doi: 10.1136/gut.2005.082933. [DOI] [PMC free article] [PubMed] [Google Scholar]
- 32.Ogino S, kawasaki T, Brahmandam M, et al. Precision and performance characteristics of bisulfite conversion and real-time PCR (MethyLight) for quantitative DNA methylation analysis. J Mol Diagn. 2006;8:209–17. doi: 10.2353/jmoldx.2006.050135. [DOI] [PMC free article] [PubMed] [Google Scholar]
- 33.Weisenberger DJ, Siegmund KD, Campan M, et al. CpG island methylator phenotype underlies sporadic microsatellite instability and is tightly associated with BRAF mutation in colorectal cancer. Nat Genet. 2006;38:787–93. doi: 10.1038/ng1834. [DOI] [PubMed] [Google Scholar]
- 34.Ogino S, Kawasaki T, Nosho K, et al. LINE-1 hypomethylation is inversely associated with microsatellite instability and CpG methylator phenotype in colorectal cancer. Int J Cancer. 2008;122:2767–73. doi: 10.1002/ijc.23470. [DOI] [PMC free article] [PubMed] [Google Scholar]
- 35.Nosho K, Kawasaki T, Chan AT, et al. Cyclin D1 is frequently overexpressed in microsatellite unstable colorectal cancer, independent of CpG island methylator phenotype. Histopathology. 2008;53:588–98. doi: 10.1111/j.1365-2559.2008.03161.x. [DOI] [PMC free article] [PubMed] [Google Scholar]
- 36.Kawasaki T, Nosho K, Ohnishi M, et al. Correlation of beta-catenin localization with cyclooxygenase-2 expression and CpG island methylator phenotype (CIMP) in colorectal cancer. Neoplasia. 2007;9:569–77. doi: 10.1593/neo.07334. [DOI] [PMC free article] [PubMed] [Google Scholar]
- 37.Ogino S, Meyerhardt JA, Cantor M, et al. Molecular alterations in tumors and response to combination chemotherapy with gefitinib for advanced colorectal cancer. Clin Cancer Res. 2005;11:6650–6. doi: 10.1158/1078-0432.CCR-05-0738. [DOI] [PubMed] [Google Scholar]
- 38.Ogino S, kawasaki T, Kirkner GJ, et al. Down-regulation of p21 (CDKN1A/CIP1) is inversely associated with microsatellite instability and CpG island methylator phenotype (CIMP) in colorectal cancer. J Pathol. 2006;210:147–54. doi: 10.1002/path.2030. [DOI] [PubMed] [Google Scholar]
- 39.Ogino S, Brahmandam M, Cantor M, et al. Distinct molecular features of colorectal carcinoma with signet ring cell component and colorectal carcinoma with mucinous component. Mod Pathol. 2006;19:59–68. doi: 10.1038/modpathol.3800482. [DOI] [PubMed] [Google Scholar]
- 40.Stang A, Kluttig A. Etiologic insights from surface adjustment of colorectal carcinoma incidences: an analysis of the U.S. SEER data 2000 –2004. Am J Gastroenterol. 2008;103:2853–61. doi: 10.1111/j.1572-0241.2008.02087.x. [DOI] [PubMed] [Google Scholar]
- 41.Sinicrope FA, Rego RL, Foster N, et al. Microsatellite instability accounts for tumor site-related differences in clinicopathologic variables and prognosis in human colon cancers. Am J Gastroenterol. 2006;101:2818–25. doi: 10.1111/j.1572-0241.2006.00845.x. [DOI] [PubMed] [Google Scholar]
- 42.Leung WK, To KF, Man EP, et al. Detection of hypermethylated DNA or cyclooxygenase-2 messenger RNA in fecal samples of patients with colorectal cancer or polyps. Am J Gastroenterol. 2007;102:1070–6. doi: 10.1111/j.1572-0241.2007.01108.x. [DOI] [PubMed] [Google Scholar]
- 43.Li Y, Wang J, Zhu G, et al. Detection of parvovirus B19 nucleic acids and expression of viral VP1/VP2 antigen in human colon carcinoma. Am J Gastroenterol. 2007;102:1489–98. doi: 10.1111/j.1572-0241.2007.01240.x. [DOI] [PubMed] [Google Scholar]
- 44.Garrity-Park MM, Loftus EV, Jr, Bryant SC, et al. Tumor necrosis factor-alpha polymorphisms in ulcerative colitis-associated colorectal cancer. Am J Gastroenterol. 2008;103:407–15. doi: 10.1111/j.1572-0241.2007.01572.x. [DOI] [PubMed] [Google Scholar]
- 45.Itzkowitz S, Brand R, Jandorf L, et al. A simplified, noninvasive stool DNA test for colorectal cancer detection. Am J Gastroenterol. 2008;103:2862–70. doi: 10.1111/j.1572-0241.2008.02088.x. [DOI] [PubMed] [Google Scholar]
- 46.Appelman HD. Con: High-grade dysplasia and villous features should not be part of the routine diagnosis of colorectal adenomas. Am J Gastroenterol. 2008;103:1329–31. doi: 10.1111/j.1572-0241.2008.02005_3.x. [DOI] [PubMed] [Google Scholar]
- 47.Yamaji Y, Okamoto M, Yoshida H, et al. The effect of body weight reduction on the incidence of colorectal adenoma. Am J Gastroenterol. 2008;103:2061–7. doi: 10.1111/j.1572-0241.2008.01936.x. [DOI] [PubMed] [Google Scholar]
- 48.Julie C, Tresallet C, Brouquet A, et al. Identification in daily practice of patients with Lynch syndrome (hereditary nonpolyposis colorectal cancer): revised Bethesda guidelines-based approach versus molecular screening. Am J Gastroenterol. 2008;103:2825–35. 2836. doi: 10.1111/j.1572-0241.2008.02084.x. quiz. [DOI] [PubMed] [Google Scholar]
- 49.Toma J, Paszat LF, Gunraj N, et al. Rates of new or missed colorectal cancer after barium enema and their risk factors: a population-based study. Am J Gastroenterol. 2008;103:3142–8. doi: 10.1111/j.1572-0241.2008.02199.x. [DOI] [PubMed] [Google Scholar]
- 50.Popat S, Hubner R, Houlston RS. Systematic review of microsatellite instability and colorectal cancer prognosis. J Clin Oncol. 2005;23:609–18. doi: 10.1200/JCO.2005.01.086. [DOI] [PubMed] [Google Scholar]
- 51.Dignam JJ, Polite BN, Yothers G, et al. Body mass index and outcomes in patients who receive adjuvant chemotherapy for colon cancer. J Natl Cancer Inst. 2006;98:1647–54. doi: 10.1093/jnci/djj442. [DOI] [PubMed] [Google Scholar]
- 52.Gunter MJ, Leitzmann MF. Obesity and colorectal cancer: epidemiology, mechanisms and candidate genes. J Nutr Biochem. 2006;17:145–56. doi: 10.1016/j.jnutbio.2005.06.011. [DOI] [PubMed] [Google Scholar]
- 53.Haydon AM, Macinnis RJ, English DR, et al. Effect of physical activity and body size on survival after diagnosis with colorectal cancer. Gut. 2006;55:62–7. doi: 10.1136/gut.2005.068189. [DOI] [PMC free article] [PubMed] [Google Scholar]
- 54.Ikeda S, Sasazuki S, Natsukawa S, et al. Screening of 214 single nucleotide polymorphisms in 44 candidate cancer susceptibility genes: a case-control study on gastric and colorectal cancers in the Japanese population. Am J Gastroenterol. 2008;103:1476–87. doi: 10.1111/j.1572-0241.2008.01810.x. [DOI] [PubMed] [Google Scholar]