

Abstract
We wished to determine whether decreases in prefrontal glutamate concentrations occur in offspring of parents with bipolar disorder with and at high risk for mania. Sixty children and adolescents, 9-18 years old, of parents with bipolar I or II disorder (20 offspring with established history of mania,“BD”, 20 offspring with symptoms subsyndromal to mania, “SS”, and 20 healthy controls “HC”) were examined using proton magnetic resonance spectroscopy at 3T to study glutamatergic metabolite concentrations in the anterior cingulate cortex (ACC). A signal for reductions in absolute glutamate concentrations in the ACC was seen in the BD compared to HC and SS groups. No other statistically significant differences among groups were found. Offspring of parents with BD with prior histories of mania may have disruptions in glutamatergic function compared to healthy controls or children at risk for BD who have not yet developed mania. Longitudinal studies are necessary to confirm whether prefrontal glutamate decreases only after the onset of full mania.
Keywords: Bipolar Disorder, Neurochemistry, Risk, glutamate
1. Introduction
Bipolar disorder (BD) is associated with high rates of familial transmission, with up to a 70% chance of developing a mood disorder in offspring of bilineally affected parents (Goodwin, 1990). Furthermore, genetic factors play a significant role in pediatric onset BD (Pavuluri et al., 2005). For example, offspring of bipolar parents have an increased risk of developing pediatric onset BD, compared with patients with BD who have no family history of the disorder (Chang et al., 2003; DelBello and Geller, 2001). While the familial risk of BD is well established, potential biomarkers for later illness development in children at familial risk for BD remain unknown.
Glutamate is the central mediator of excitatory synaptic transmission in the mammalian brain (Orrego and Villanueva, 1993), facilitating learning, memory, and synaptic plasticity. Abnormalities in glutamatergic function have been implicated in individuals with BD and other mood disorders (Sanacora et al., 2008), who show departures from normal glutamate levels in plasma (Palomino et al., 2007), serum (Mitani et al., 2006), cerebrospinal fluid (Hoekstra et al., 2006; Frye et al., 2007a), and brain tissue (Hashimoto et al., 2007). Other important indicators that glutamatergic dysfunction may be associated with BD include alterations in glutamate receptors (Scarr et al., 2003; Mccullumsmith et al., 2007) and disruptions in glial cells important for regulating the glutamatergic system (Ongur et al., 1998). One recent case-control study reported that increased gene expression of glutamatergic kainate receptors confer genetic protection from the development of BD (Pickard et al., 2008), illustrating the role that the glutamatergic system may play as a biological marker mediating the development of BD. These data, together with the strong familiality and increased recognition of bipolar phenomenology in youth, provide an impetus to investigate whether disruption in glutamatergic function coincides with an increased risk for or early onset of mania.
Several recent studies have implicated altered glutamatergic neurochemistry in key cortico-limbic and cerebellar regions in patients with BD across the lifespan (Michael et al., 2003; Frye et al., 2007b, Moore et al., 2007a; Moore et al., 2007b; Ongur et al., 2008; Shibuya-Tayoshi et al., 2008). Findings associated with functional (Chang et al., 2004) and structural (Kaur et al., 2005) changes in prefrontal brain regions in children and adolescents with BD suggest underlying cellular and molecular dysfunction at a microscopic level in these regions that warrant further investigation. Several lines of evidence suggest that in BD the anterior cingulate cortex (ACC) is particularly vulnerable to potential disease associated changes such as oxidative stress (Wang et al., 2009a), reductions in volume associated with increased trait impulsivity (Matsuo et al., 2009), and abnormal functional connectivity to the amygdala during emotional processing (Wang et al., 2009b). Further in vivo examination of this region is warranted.
Proton magnetic resonance spectroscopy (1H-MRS) is a noninvasive neuroimaging method that yields molecular level biochemical data to quantitatively examine neuronal function in individuals with and at risk for BD. Adolescents with BD were found in one study to have decreased glutamate/glutamine (Glx) (Moore et al., 2007a) and glutamine (Moore et al., 2007b) in the ACC, suggesting decreased excitatory neurotransmission in this region of the prefrontal cortex. Other studies have shown no differences in glutamatergic neurochemistry in pediatric patients with BD compared to healthy or clinical comparison groups in prefrontal regions (Davanzo et al., 2003; Olvera et al., 2007). This could be due to different sampling criteria, varying field strengths, non-uniform protocols for spectral acquisition and voxel placement, or variable levels of medication exposure or other confounding variables. To our knowledge, there are no studies to date that have examined markers of glutamatergic neurochemistry in children at familial risk for BD who have not yet developed mania. Therefore, it is unclear from these studies if altered glutamatergic transmission is a consequence of disease progression or represents a trait marker present before BD onset.
To characterize glutamatergic function in pediatric BD, we used 1H-MRS to compare ACC levels of glutamate among children and adolescents who have a familial risk for BD compared to age-, gender, and socioeconomically similar healthy controls. Children with a familial risk for BD were further divided into those with and without BD at the time of evaluation. Based on previous studies demonstrating glutamatergic dysfunction in the pathophysiology of BD (Belsham, 2001; Szabo et al., 2008) and its restoration of function with treatment (Kugaya and Sanacora, 2005; Post, 2008), glutamate rather than glutamine was selected as a primary metabolite of interest for the present study. Coinciding with theories of prefrontal neurodegeneration possibly due to oxidative stress demonstrated in preclinical and postmortem studies in BD (Dean et al., 2009; Wang et al., 2009), we hypothesized that BD offspring would demonstrate decreases in glutamatergic concentrations in the ACC due to illness burden compared to healthy controls. Specifically, we predicted that offspring with BD would have the lowest relative concentrations of glutamate compared to both healthy controls and high-risk offspring without BD (who would have intermediate concentrations of glutamate).
2. Methods
2.1. Subjects
The Stanford University Panel of Medical Research in Human Subjects approved this research protocol. After complete description of the study to the subjects and their parents, written informed consent was obtained from the parents, and written assent was obtained from the children. Forty 9–18 year old children of parents with either bipolar I or II disorder (N=20 with fully syndromal mania, “BD,” and N=20 with subsyndromal symptoms but no mania, “SS”), were recruited from ongoing studies of high-risk offspring at Stanford's Pediatric Bipolar Disorders Program and from the community. Control children of parents without any DSM-IV Axis I disorder with comparable age, Tanner stage, race, sex, socioeconomic status and handedness were recruited for study participation from community advertisements and local schools (HC, N=20). All participants were evaluated for psychiatric disorders by semi-structured interviews. The Structured Clinical Interview for DSM-IV (SCID-P) (First et al., 1996), was administered to all parents by raters blind to diagnostic group and with established symptom and diagnostic inter-rater reliability (kappa>0.9). All children were evaluated for lifetime psychiatric diagnoses using the Affective and Psychotic Modules of the Washington University in St. Louis Kiddie-Schedule for Affective Disorders and Schizophrenia (WASH-U KSADS) (Geller et al., 1996) and the Kiddie Schedule of Affective Disorders and Schizophrenia Present and Lifetime version (KSADS-PL) (Kaufman et al., 1997), administered separately to parents and children by raters blind to diagnostic group and with established symptom and diagnostic reliability (kappa>0.9) (Gallelli et al., 2005). Diagnostic decisions were ultimately made by a child psychiatrist (K.C.) based on personal interview or discussion with a masters-level research assistant. Current and lifetime diagnoses, onsets and offsets of manic and hypomanic episodes were established using DSM-IV criteria. Parents with BD were euthymic at the time of their own and their child's interview.
In addition to a parental BD diagnosis, subjects included in the pediatric BD group required a diagnosis of bipolar I or II disorder by the WASH-U-KSADS. For inclusion in the subsyndromal group, children met criteria for moderate mood dysfunction by a score of >10 on the Young Mania Rating Scale (YMRS) (Young et al., 1978) or a score of >29 on the Children's Depressive Rating Scale-Revised (CDRS-R) (Poznanski et al., 1979), but did not meet symptom duration or severity criteria for a fully syndromal mania, either at the time of assessment or ever historically. Subjects in the SS group received a diagnosis of bipolar disorder–not otherwise specified (BD-NOS) if they were missing only one DSM-IV-TR criterion for mania or had all criteria but only had 2 to 4 days of episode duration (Birmaher et al., 2006) and did not have a concurrent diagnosis of major depression. The control group was comprised of healthy volunteers with no DSM-IV psychiatric diagnosis, psychotropic medication exposure, no parent with any psychiatric diagnosis by SCID, and no first- or second-degree relative with BD as assessed by the Family History Research Diagnostic Criteria (Andreasen et al., 1977). All subjects were assessed and scanned in an outpatient setting. Psychostimulant medications were discontinued 24 hours before the MRS, primarily due to a concurrent, separate fMRI study of attention. Other medications including mood-stabilizers, atypical antipsychotics, and antidepressants, were continued to avoid any risk of mood destabilization. Thorough medication histories were obtained and used for exploratory and covariate analyses of 1H-MRS findings.
2.2. Proton Magnetic Resonance Spectroscopy
After psychiatric diagnostic interviews, subjects were scanned by 1H-MRS using a 3 Tesla Signa MRI system with Echospeed gradients (General Electric Healthcare, Milwaukee, WI, USA) using a custom-built quadrature birdcage receiving head coil with a 50% advantage in signal-to-noise ratio (SNR) over that provided by the standard GE head coil. Eighteen axial slices (4 mm thick, 05 mm skip) parallel to the anterior-posterior commissure plane and covering the entire brain were acquired with a temporal resolution of 3 seconds using a T2-weighted gradient echo spiral pulse sequence (Fast Spin Echo, TR=4000 ms, TE= 68 ms, echo train length = 12, receiver bandwidth = 15.63, 22 cm field of view; 256 × 192 matrix; acquired resolution = 5.0 × 0.9 × 1.2 mm3). This T2-weighted image was used to localize and prescribe a voxel in the ACC. Images were then reconstructed as an 18 × 256 × 256 matrix with a 5.0 × 0.9 × 0.9 mm3 spatial resolution.
Spectroscopic data were acquired within a 2×2×2 voxel that was placed in the ACC according to the 124 × 256 × 256 anatomical image set using the following parameters: PRESS localization, TR/TE=2000/35ms, 5 mm slice thickness, 124 × 256 × 256 matrix, 2×2×2 cm voxel in the dorsal ACC and orbitofrontal cortex (Brodmann areas 32 and 12), superior to the orbits and inferior to the genu of the corpus callosum from the first axial slice above the lateral ventricles (see Figure 1). An investigator blind to group status visually inspected the prescription of each voxel to ensure proper placement in the region of interest. MRS scans used 32 averages, 1 kHz spectral bandwidth, 1 k data points, with water suppressed and unsuppressed frames, and a scan length of 1 min 44 seconds. The metabolite spectra were reconstructed using the water-suppressed frames, while the water-unsuppressed frames were used by LCModel for “absolute” quantification in institutional units. A field strength of 3T made it possible to obtain adequate signal-to-noise with a relatively short acquisition time (Di Costanzo et al., 2007). The fully automated PROBE/SV quantification tool (General Electric Medical Systems, Milwaukee, WI, USA) was used for data acquisition and LCModel version 6.20 (Provencher, 2001) was used to process the MRS data, enabling examination of both absolute and relative to creatine (Cr) concentrations of glutamate, and glutamine. The role of other neurometabolites that may be implicated in BD risk, including N-acetyl aspartate (NAA) and myoinositol (mI) were also explored (see Figure 2 for representative spectrum). Cramer-Rao spectral inclusion criteria were SD<15% for NAA, Cho, Cr, and myo-Inositol, and SD<25% for glutamate and glutamine, to replicate assumptions made by previous research measuring these neurochemicals in prefrontal regions in youths with BD (Moore et al., 2007b).
Figure 1.
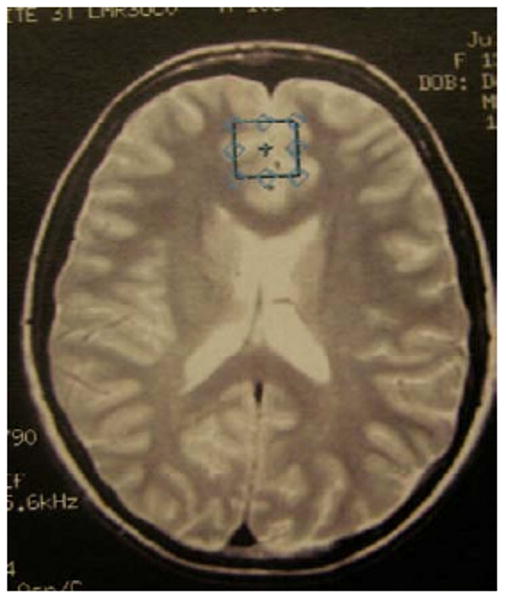
Position of anterior cingulate cortex voxels.
Figure 2.
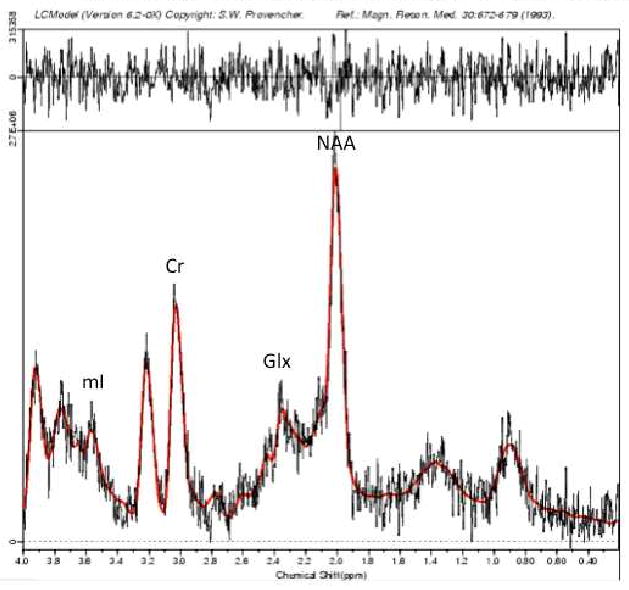
Sample magnetic resonance spectrum in LCModel; mI = myoinositol; Cr = creatine, Glx = Glutamate+Glutamine, NAA = N-acetyl aspartate
Voxel segmentation was performed using high-resolution T1-weighted spoiled grass gradient recalled (SPGR) 3D MRI sequences with the parameters: TR=35 ms; TE=6 ms; flip angle = 45°; 24 cm field of view; 124 slices in the coronal plane; 256 × 192 matrix, with acquired resolution of 1.5 × 0.9 × 1.2 mm3. The images were reconstructed as a 124 × 256 × 256 matrix with a 1.5 × 0.9 × 0.9 mm3 spatial resolution. Coronal volume images were segmented into gray matter, white matter, and CSF using a semi-automated software package, FSL version 3.5 after bias correction using SPM 5 (Ashburner and Friston, 2005). The segmented images were edited further by applying the voxel dimensions in the ACC used for MRS, providing the grey and white matter content of the ACC voxel for each subject (Gallelli et al., 2005).
2.3. Statistical Analysis
All statistical analyses were performed using Statistical Analysis System software, version 8.02 (SAS Institute, Cary, N.C.). Analyses of variance (ANOVA) and chi-square tests were used to compare demographic and clinical characteristics between groups. MRS data were first examined for normality using univariate analyses to conform to the assumptions of the parametric statistics employed (Shapiro-Wilks statistic, W>0.91; P>0.08). Difference in glutamate concentration in the ACC was considered the primary outcome measure, and was compared among groups using ANOVA with a significance threshold of P ≤ 0.05. Glutamate as a ratio to creatine was measured to confirm the stability of the absolute glutamate concentrations observed across all three groups. Other absolute and relative to creatine metabolite concentrations, including glutamine, glutamate+glutamine (Glx), N-acetyl aspartate (NAA), and myoinositol (mI), were considered secondary and exploratory, with a significance threshold of P ≤ 0.0125 to adjust for multiple comparisons. Metabolite concentration was the dependent variable and group status (BD, SS, or HC) was the independent variable. Effect sizes for group differences in metabolite concentration were calculated to identify the largest difference between groups based on F-values obtained from the ANOVAs using the formula (f) = √(k-1)F/N, where (f)= effect size, k=number of groups, F=test statistic, N=total number of subjects. An effect size of (f)>0.25 is considered a medium effect and of potential clinical relevance (Cohen, 1977). Where a clinically relevant effect size was found, least-squares means tests were performed to determine which pairs of groups differed significantly in metabolite concentration.
Pearson correlations were performed to explore relationships between metabolites and clinical scores for depression (CDRS-R), mania (YMRS), overall functioning (CGAS). Because of these multiple comparisons, a Bonferroni-type correction was applied to adjust significance threshold to P< 0.001 for these exploratory analyses. The presence of ADHD comorbidity, as well as the effects of prior, current, and lifetime exposures to medications within the BD and SS groups were examined by repeating the primary ANOVA analysis after removal of these subgroups.
3. Results
3.1 Cohort
There were no statistically significant group differences in age, gender, socioeconomic status, ethnicity, or intellectual quotient (IQ) among the three groups (Table 1). Although the SS group was approximately two years younger than the BD and HC groups, the between group metabolite differences presented below did not change significantly after covarying for age. In the BD group, 90% (N=18) had a diagnosis of bipolar I disorder and 10% (N=2) a diagnosis of bipolar II disorder. In the SS group, mood diagnoses included major depressive disorder (MDD) (N= 8), dysthymia (N=1), and BD-NOS (N=5). YMRS scores were comparable in the BD (mean = 14.6 ± 6.3) and SS (mean = 12.2 ± 5.1, P = 0.38) groups. However, CDRS-R scores were higher in the BD group (mean = 42 ± 14) compared to the SS group (mean = 32 ± 5.6, P = 0.02). Although subjects were not in a manic or depressive episode at the time of the scan, the mood symptom scores suggest a predominance of depressive symptoms over mania. Overall level of functioning represented in CGAS scores were significantly higher in the HC group relative to the BD and SS groups (F(1, 35) = 58.14, P<0.0001), but BD and SS groups had comparable CGAS scores (t(26) = 1.45, P = 0.16).
Table 1. Demographic and Clinical Characteristics of Study Participants.
| Bipolar BD | Subsyndromal SS | Control HC | ||
|---|---|---|---|---|
| N | 20 | 20 | 20 | |
| Mean age, years (SD) | 15.89 (2.3) | 12.9 (2.9) | 15.1 (2.3) | |
| Gender, (%) female | 7 (35) | 10 (50) | 5 (25) | |
| SES (SD) | 4.2 (0.9) | 4.0 (0.7) | 4.5 (0.9) | |
| Ethnicity (%) | ||||
| African-American | 0 (0) | 1 (5) | 0 (0) | |
| Asian | 0 (0) | 0 (0) | 5 (25) | |
| Caucasian | 19 (95) | 17 (85) | 13 (65) | |
| Hispanic | 1 (5) | 1 (5) | 2 (10) | |
| Other (Middle Eastern) | 0 (0) | 1 (5) | 0 (0) | |
| Mean IQ (SD)* | 108 (14) | 107 (14) | 115 (10) | |
| Mean YMRS Score (SD)* | 14.6 (8.6) | 12.2 (6.7) | 0.42 (0.8) | |
| Mean CDRS-R Score (SD)* | 41.5 (13.7) | 32.0 (5.6) | 17.9 (1.5) | |
| Mean CGAS (SD)* | 52.6 (10.8) | 59.4 (13.3) | 87.9 (4.9) | |
| Comorbid diagnoses of offspring, n (%) | ||||
| ADHD | 17 (85) | 13 (65) | 0 (0) | |
| Anxiety disorders | 3 (15) | 5 (25) | 0 (0) | |
| ODD | 12 (60) | 6 (30) | 0 (0) | |
| Psychotropic medications at time of MRS, n (%) | ||||
| Atypical Antipsychotics | 6 (30) | 8 (40) | 0 (0) | |
| Antidepressants | 9 (45) | 7 (35) | 0 (0) | |
| Stimulants | 11 (55) | 6 (30) | 0 (0) | |
| Lithium | 6 (30)* | 1 (5)* | 0 (0) | |
| Valproate | 7 (35) | 3 (15) | 0 (0) | |
| Lamotrigine | 1 (5) | 1 (5) | 0 (0) | |
| Lifetime exposure to any psychotropic medication | 17 (85) | 17 (85) | 0 (0) | |
BD = high-risk offspring with bipolar disorder; SS = high-risk offspring with subsyndromal symptoms; HC = healthy controls; SD = standard deviation; SES = socioeconomic status; YMRS = Young Mania Rating Scale; CDRS-R = Childhood Depression Rating Scale-Revised; Anxiety disorder = separation anxiety disorder, generalized anxiety disorder, social phobia, obsessive-compulsive disorder, or post-traumatic stress disorder; ADHD = attention-deficit/hyperactivity disorder; ODD = oppositional defiant disorder; MRS = magnetic resonance spectroscopy.
significant group difference at p < 0.05.
Seventeen (85%) subjects in the BD group had previously taken psychotropic medications. Fifty-five percent of these subjects had significant past exposure (more than 2 months) to stimulants; 60% to antidepressants (including SSRIs, tricyclic antidepressants, and atypical antidepressants); 35% to antipsychotics, 35% with exposure to lithium, 45% with exposure to valproate, and 5% to lamotrigine. However, at the time of scan distributions of subjects in the bipolar group actively being treated with medication were as follows (table 1): 55% with stimulants (however stimulants were discontinued for 24 hours prior to scan); 45% with antidepressants; 30% with antipsychotics; 30% on lithium, 35% on valproate, and 5% on lamotrigine.
Seventeen (85%) subjects in the SS group had previously taken psychotropic medications. Forty percent were exposed to stimulants, 45% to antidepressants, 40% to antipsychotics, 5% with exposure to lithium, 10% with exposure to valproate, and 10% exposure to lamotrigine. At the time of scan the percentages of subjects in the SS group being actively treated with medication were as follows: 30% with stimulants; 35% with antidepressants; 40% with antipsychotics, and mood-stabilizers, including 5% on lithium, 15% on valproate, and 5% on lamotrigine.
No subjects in the control group had previously been exposed to psychotropic medications. At the time of scan, there were no significant differences between BD and SS groups in current medication exposure.
In the BD group, 85% of subjects had co-occurring attention-deficit/hyperactivity disorder (ADHD); 15% had a comorbid diagnosis of anxiety disorder; and 60% had comorbid oppositional defiant disorder (ODD). Sixty-five percent of SS subjects had a diagnosis of ADHD, 30% were diagnosed with an anxiety disorder, and 25% with ODD. None of the subjects in any group had a present or past substance-use disorder.
3.2. Spectroscopy Results
An ANOVA indicated significant differences in absolute glutamate concentrations among the three groups (F = 3.08, P=0.05, (f)=0.32). Significant individual group differences in glutamate concentrations were found between SS and BD groups [10.30 ± 2.0 (SD) versus 9.08 ± 1.8 (SD), respectively; F(1,38)=4.31, P<0.04, (f)=0.27], and between HC and BD groups [10.21 ± 1.4 (SD) versus 9.08 ± 1.8 (SD), respectively; F(1,38)=4.30, P<0.04, (f)=0.27] (Figure 3). These results remained unchanged even after restricting our analyses to unmedicated subgroups. A trend for between-group differences in glutamate/Cr concentration (F = 2.79, P=0.07, (f) = 0.30) supported the primary result observed for absolute glutamate concentrations. Follow up two-group analyses showed significant group differences in glutamate/Cr concentrations between SS and BD groups [1.72 ± 0.30 (SD) versus 1.49 ± 0.34 (SD), respectively; F(1,38)=4.31, P<0.04, (f)=0.27], and between HC and BD groups [1.65 ± 0.31 (SD) versus 1.49 ± 0.34 (SD), respectively; F(1,38)=4.30, P<0.04, (f)=0.27]. No other absolute metabolite concentration or ratio showed statistically significant group differences. Exploratory ANOVAs of additional metabolites NAA and mI, in absolute and relative concentrations to creatine, were not statistically significant for the ACC region examined here (Table 2), consistent with previously published results in the right and left dorsolateral prefrontal cortices (Gallelli et al., 2005) and ventromedial prefrontal cortex (Hajek et al., 2008).
Figure 3.

Comparative absolute glutamate concentrations across groups
Legend: HC=Healthy Controls; SS=High-risk offspring with Subsyndromal symptoms; BD=High-risk offspring with Mania; Overall ANOVA: F=3.08, p=0.05, f=0.32;
* Significant group differences in SS and BD groups [10.30 ± 2.0 (SD) versus 9.08 ± 1.8 (SD); F(1,38)=4.31, p<0.04, (f)=0.27], and between HC and BD groups [10.21 ± 1.4 (SD) versus 9.08 ± 1.8 (SD), F(1,38)=4.30, p<0.04, (f)=0.27]
Table 2. ACC 1H-MRS Glutamatergic Quantification in Bipolar versus Healthy Control Offspring.
| Subject Group | BD Mean(SD) | SS Mean (SD) | HC Mean(SD) | F Statistic | P | Effect Size, f |
|---|---|---|---|---|---|---|
| N | 20 | 20 | 20 | |||
| Creatine | 6.18 (0.89) | 6.02 (0.58) | 6.29 (0.68) | 0.66 | 0.52 | 0.10 |
| Glutamate* | 9.08 (1.97) | 10.30 (1.77) | 10.21 (1.44) | 3.08 | 0.05 | 0.32 |
| Glutamate/Creatine | 1.49 (0.34) | 1.72 (0.30) | 1.65 (0.31) | 2.79 | 0.07 | 0.30 |
| Glutamine* | 6.97 (2.40) | 6.83 (1.54) | 6.34 (1.71) | 0.61 | 0.55 | 0.14 |
| Glutamine/Creatine | 1.14 (0.39) | 1.14 (0.23) | 1.00 (0.25) | 1.40 | 0.24 | 0.22 |
| Glx* | 16.04 (2.43) | 17.14 (2.35) | 16.5 (1.84) | 1.22 | 0.30 | 0.20 |
| Glx/Creatine | 2.63 (0.47) | 2.86 (0.37) | 2.65 (0.33) | 2.03 | 0.14 | 0.26 |
| N-Acetyl Aspartate | 7.01 (1.22) | 7.34 (0.87) | 7.30 (1.04) | 0.57 | 0.57 | 0.14 |
| NAA/Cr | 1.14 (0.19) | 1.23 (0.18) | 1.17 (0.19) | 1.10 | 0.34 | 0.19 |
| Myoinositol | 5.08 (1.39) | 4.76 (0.82) | 4.93 (0.84) | 0.45 | 0.64 | 0.12 |
| mI/Cr | 0.82 (0.20) | 0.85 (0.29) | 0.79 (0.13) | 0.44 | 0.64 | 0.12 |
Absolute concentrations to tissue water using LCModel;
Glx = Glutamate/Glutamine; BD=Offspring with Bipolar Disorder; SS=Offspring with Subsyndromal Symptoms; HC=Healthy Controls; SD = Standard Deviation; NAA = N-Acetyl Aspartate, mI = Myoinositol
No significant correlations between YMRS, CDRS-R, or CGAS scores and metabolite concentrations were found within the BD and SS groups after correcting for multiple comparisons. Restricting analyses to unmedicated individuals or those with past, current, or lifetime medication exposures did not change group differences in metabolite concentrations. Presence of an ADHD, ODD, or anxiety diagnosis did not significantly change group differences in metabolite concentrations.
Tissue segmentation data were acquired from subjects from each diagnostic group, as previously described by our group (Gallelli et al., 2005). There were no significant differences between grey or white matter contributions to the ACC voxel for any of the three groups (Table 3).
Table 3. Average Percent Voxel Composition of Subjects By Group.
| BD (N=20), % (SD) | SS (N=20), % (SD) | HC (N=20), % (SD) | F statistic | P Value | |
|---|---|---|---|---|---|
| Grey | 82.4 (0.07) | 82.5 (0.08) | 85.9 (0.07) | 1.86 | 0.17 |
| White | 12.7 (0.06) | 13.5 (0.05) | 11.5 (0.04) | 1.06 | 0.35 |
BD=Offspring with Bipolar Disorder; SS=Offspring with Subsyndromal Symptoms; HC=Healthy Controls
4. Discussion
The findings from our MRS study indicate that offspring of parents with BD show decreases in anterior cingulate glutamate absolute concentrations and trends for decreases in glutamate relative to creatine, but only after they have developed fully syndromal mania. This suggests that for high-risk offspring, altered glutamatergic functioning may represent a marker for a more fully symptomatic clinical course of mania rather than a feature associated with familial risk alone. Exploratory analyses did not reveal any statistically significant differences in any other glutamate-related metabolites among high-risk offspring with BD, high-risk offspring with subsyndromal symptoms, or healthy controls. Moreover, effect sizes for glutamine and Glx were, for the most part, small, suggesting that very large samples would be needed to detect differences that may be biologically relevant.
A signal for decreased glutamate concentrations in high-risk offspring with BD is partially consistent with and adds to several recent studies that have shown state dependent changes in glutamate, its precursor and storage form glutamine, or a combined contribution of glutamate and glutamine (Glx) in individuals with BD. Decreases in glutamine have been found in the ACC in unmedicated children with BD (Moore et al., 2007b) and in the basal ganglia of healthy adults shortly after they were exposed to subclinical doses of lithium (Shibuya-Tayoshi et al., 2008). Glx reductions have similarly been found in risperidone-medicated children and adolescents with BD (Moore et al., 2007a). However, increased Glx concentrations have been found in the basal ganglia and frontal lobes in children 6 to 12 years old with BD (Castillo et al., 2000), in children with co-occurring BD and attention deficit with hyperactivity disorder (ADHD) (Moore et al., 2006a), in the grey matter of the cingulate gyrus in unmedicated adults with BD (Dager et al., 2004). Age and developmental differences across cohorts and variable levels of exposure to medication may account for differences in the direction of change in glutamine and Glx concentrations. Nevertheless, in the presence of fully syndromal BD, these studies collectively suggest altered glutamatergic transmission in prefrontal and subcortical regions.
Interestingly, while we found potential decreases in glutamate concentrations in high-risk offspring with an established history of mania, a decrease in glutamate was not seen in the SS group in spite of similar YMRS scores to the BD group. As the SS group were younger than the BD group and have not yet developed full mania, it is possible that decreases in prefrontal glutamate concentrations reflect the presence of persistent, prolonged, or severe symptoms of mania or depression rather than transient or subsyndromal mood states. Adjusting for age when comparing glutamate concentration between BD and SS groups did not significantly change our results. Further prospective examination of acute and chronic changes of glutamate in the brain and its response to treatment is warranted to understand its relationship to different stages of illness and neurodevelopment.
Some, but not all, prior studies have demonstrated that alterations in other neurometabolite concentrations may occur early during the initial development of BD. NAA, a healthy nerve cell marker putatively involved in maintaining fluid balance, energy production, and myelin formation in the brain has been observed to be decreased in the dorsolateral prefrontal cortex (DLPFC) in pediatric BD (Olvera et al., 2007) as well as in pediatric high-risk offspring with mania (Chang et al., 2003), suggesting neurodegenerative changes coincident with the presence of mania. However, further comparisons of NAA levels in bilateral DLPFC in high-risk offspring with and without mania found no statistically significant decrements in NAA, suggesting that decrements of NAA in the DLFPC may not be seen until progression of illness into adulthood (Gallelli et al., 2005). Another study on symptomatic offspring of BD parents also demonstrated increased orbitofrontal myoinositol (mI), a marker for cellular metabolism and related second messenger signaling pathways (Cecil et al., 2003). Both NAA and mI appear to change in concentration with lithium treatment in pediatric populations (Davanzo et al., 2003; Patel et al., 2006; Patel et al., 2008). However, these changes in metabolite concentrations have not been replicated in other studies of offspring at high-risk for BD (Gallelli et al., 2005; Hajek et al., 2008), including the present study. Diagnostic and developmental heterogeneity, mood state at the time of scan, partial volumes of grey and white matter in the region of interest, and other demographic variables may account for differences across studies.
Several limitations need to be acknowledged for the current study. Voxel placement may have varied slightly across subjects, but was based on anatomical landmarks that provided some framework for reliable placement. Due to limitations in scanning children for prolonged periods of time, scanner drift and the possibility of overlapping resonances due to the short echo time (TE = 35 msec) may have caused sources of variance in our spectral measurements across all groups. We capitalized on the higher 3T field strength used in our study to overcome these issues by providing better peak separation and SNR compared to 1.5 T magnets, although at field strengths greater than 3T, the signal-to-noise ratio and spectral separation for 1H NMR spectroscopy may be superior (Tkáč et al., 2009). It is noteworthy that trends for reduced glutamate/Cr ratios were observed, which may not have achieved statistical significance due to additional variance from creatine. Similarly, Glx ratios and absolute concentrations did not achieve statistical significance, possibly due to variance contributed by glutamine, which showed nonsignificant increases across all groups. Although the goal of this study was not to unequivocally differentiate glutamate from glutamine or GABA, a future study using a sequence that provides a less ambiguous measure of glutamate (e.g. CT-PRESS) (Mayer and Spielman, 2005) would aid in verifying our results.
Sample heterogeneity due to co-occurring diagnoses and medication exposure limit this analysis due to insufficient sample sizes to examine individual effects of these factors. Moreover, adjustments for multiple comparisons in MRS studies can result in null findings (Dickstein et al., 2008). In the early stages of investigating the relationship between mood disorders and neurochemistry, some accommodation for exploratory analyses should be permitted, particularly since clinical studies have already begun to demonstrate robust and clinically relevant neurochemical responses to pharmacological interventions (DelBello et al., 2006; Moore et al., 2006b). Nonetheless, our results did not change even after restricting our analyses to unmedicated subgroups.
To our knowledge, this is the first 1H-MRS study performed as yet investigating glutamatergic neurochemistry in the ACC in children with familial BD and in a population at risk for developing BD due to its familial and symptomatic propensities. Our findings indicate that relative to healthy controls, children at familial risk for BD show in vivo 1H-MRS-detected trends for decreased glutamate concentrations after the onset of fully syndromal mania. This suggests that decreases in glutamate may be a marker for a clinical course that includes the development of frank mania, and requires further investigation for its potential role in the pathophysiology of BD and prefrontal neurodegeneration. These results may be limited by a cross-sectional design, small sample size, co-occurring psychiatric diagnoses, or medication exposure. Nevertheless, glutamatergic function may be an important component to consider in the characterization of risk for developing BD in offspring of bipolar parents. Further longitudinal studies are necessary to determine if early neurochemical changes can predict the development of mania. Improved methods for identifying children with particular neurochemical vulnerabilities may inform preventive and early intervention strategies prior to the onset of fully syndromal BD.
Acknowledgments
The authors gratefully acknowledge the support of the NIMH (K23 MH064460, K23 MH085919, and R01 MH077047), NARSAD, the Hahn Family, and Stanford's Child Health Research Program. The authors of this paper do not have any commercial associations that might pose a conflict of interest in connection with this manuscript.
Footnotes
Publisher's Disclaimer: This is a PDF file of an unedited manuscript that has been accepted for publication. As a service to our customers we are providing this early version of the manuscript. The manuscript will undergo copyediting, typesetting, and review of the resulting proof before it is published in its final citable form. Please note that during the production process errors may be discovered which could affect the content, and all legal disclaimers that apply to the journal pertain.
References
- Andreasen NC, Endicott J, Spitzer RL, Winokur G. The family history method using diagnostic criteria. Reliability and validity. Archives of General Psychiatry. 1977;34:1229–1235. doi: 10.1001/archpsyc.1977.01770220111013. [DOI] [PubMed] [Google Scholar]
- Ashburner J, Friston KJ. Unified segmentation. Neuroimage. 2005;26:839–851. doi: 10.1016/j.neuroimage.2005.02.018. [DOI] [PubMed] [Google Scholar]
- Belsham B. Glutamate and its role in psychiatric illness. Human Psychopharmacology. 2001;16:139–146. doi: 10.1002/hup.279. [DOI] [PubMed] [Google Scholar]
- Birmaher B, Axelson D, Strober M, Gill MK, Valeri S, Chiappetta L, Ryan N, Leonard H, Hunt J, Iyengar S, Keller M. Clinical course of children and adolescents with bipolar spectrum disorders. Archives of General Psychiatry. 2006;63:175–183. doi: 10.1001/archpsyc.63.2.175. [DOI] [PMC free article] [PubMed] [Google Scholar]
- Castillo M, Kwock L, Courvoisie H, Hooper SR. Proton MR spectroscopy in children with bipolar affective disorder: preliminary observations. American Journal of Neuroradiology. 2000;21:832–838. [PMC free article] [PubMed] [Google Scholar]
- Cecil KM, DelBello MP, Sellars MC, Strakowski SM. Proton magnetic resonance spectroscopy of the frontal lobe and cerebellar vermis in children with a mood disorder and a familial risk for bipolar disorders. Journal of Child and Adolescent Psychopharmacology. 2003;13:545–555. doi: 10.1089/104454603322724931. [DOI] [PubMed] [Google Scholar]
- Chang KD, Adleman N, Dienes K, Reiss AL, Ketter TA. Bipolar Offspring: A Window Into Bipolar Disorder Evolution. Biological Psychiatry. 2003;53:941–945. doi: 10.1016/s0006-3223(03)00061-1. [DOI] [PubMed] [Google Scholar]
- Chang K, Adleman N, Dienes K, Barnea-Goraly N, Reiss A, Ketter T. Decreased N-acetylaspartate in children with familial bipolar disorder. Biological Psychiatry. 2003;53:1059–1065. doi: 10.1016/s0006-3223(02)01744-4. [DOI] [PubMed] [Google Scholar]
- Chang K, Adleman NE, Dienes K, Simeonova DI, Menon V, Reiss A. Anomalous prefrontal-subcortical activation in familial pediatric bipolar disorder: a functional magnetic resonance imaging investigation. Archives of General Psychiatry. 2004;61:781–792. doi: 10.1001/archpsyc.61.8.781. [DOI] [PubMed] [Google Scholar]
- Cohen J. Statistical Power Analysis for the Behavioral Sciences. New York: Academic Press; 1977. [Google Scholar]
- Dager SR, Friedman SD, Parow A, Demopulos C, Stoll AL, Lyoo IK, Dunner DL, Renshaw PF. Brain metabolic alterations in medication-free patients with bipolar disorder. Archives of General Psychiatry. 2004;61:450–458. doi: 10.1001/archpsyc.61.5.450. [DOI] [PubMed] [Google Scholar]
- Davanzo P, Yue K, Thomas MA, Belin T, Mintz J, Venkatraman TN, Santoro E, Barnett S, McCracken J. Proton magnetic resonance spectroscopy of bipolar disorder versus intermittent explosive disorder in children and adolescents. American Journal of Psychiatry. 2003;160:1442–1452. doi: 10.1176/appi.ajp.160.8.1442. [DOI] [PubMed] [Google Scholar]
- Dean OM, van den Buuse M, Bush AI, Copolov DL, Ng F, Dodd S, Berk M. A role for glutathione in the pathophysiology of bipolar disorder and schizophrenia? Animal models and relevance to clinical practice. Current Medicinal Chemistry. 2009;16:2965–2976. doi: 10.2174/092986709788803060. [DOI] [PubMed] [Google Scholar]
- DelBello MP, Cecil KM, Adler CM, Daniels JP, Strakowski SM. Neurochemical effects of olanzapine in first-hospitalization manic adolescents: a proton magnetic resonance spectroscopy study. Neuropsychopharmacology. 2006;31:1264–1273. doi: 10.1038/sj.npp.1300950. [DOI] [PubMed] [Google Scholar]
- DelBello MP, Geller B. Review of studies of child and adolescent offspring of bipolar parents. Bipolar Disorders. 2001;3:325–334. doi: 10.1034/j.1399-5618.2001.30607.x. [DOI] [PubMed] [Google Scholar]
- Di Costanzo A, Trojsi F, Tosetti M, Schirmer T, Lechner SM, Popolizio T, Scarabino T. Proton MR spectroscopy of the brain at 3 T: an update. Eur Radiol. 2007;17:1651–1662. doi: 10.1007/s00330-006-0546-1. [DOI] [PubMed] [Google Scholar]
- Dickstein DP, van der Veen JW, Knopf L, Towbin KE, Pine DS, Leibenluft E. Proton magnetic resonance spectroscopy in youth with severe mood dysregulation. Psychiatry Research. 2008;163:30–39. doi: 10.1016/j.pscychresns.2007.11.006. [DOI] [PubMed] [Google Scholar]
- First MB, Spitzer RL, Gibbon M, Williams JBW. Structured clinical Interview for DSM-IV axis I disorders-patient version (SCID-P) New York: 1996. [Google Scholar]
- Frye MA, Tsai GE, Huggins T, Coyle JT, Post RM. Low cerebrospinal fluid glutamate and glycine in refractory affective disorder. Biological Psychiatry. 2007a;61:162–166. doi: 10.1016/j.biopsych.2006.01.024. [DOI] [PubMed] [Google Scholar]
- Frye MA, Watzl J, Banakar S, O'Neill J, Mintz J, Davanzo P, Fischer J, Chirichigno JW, Ventura J, Elman S, Tsuang J, Walot I, Thomas MA. Increased anterior cingulate/medial prefrontal cortical glutamate and creatine in bipolar depression. Neuropsychopharmacology. 2007b;32:2490–2499. doi: 10.1038/sj.npp.1301387. [DOI] [PubMed] [Google Scholar]
- Gallelli KA, Wagner CM, Karchemskiy A, Howe M, Spielman D, Reiss A, Chang KD. N-acetylaspartate levels in bipolar offspring with and at high-risk for bipolar disorder. Bipolar Disorders. 2005;7:589–597. doi: 10.1111/j.1399-5618.2005.00266.x. [DOI] [PubMed] [Google Scholar]
- Geller B, Zimerman B, Williams M, Frazier J. Washington University in St Louis Kiddie and Young Adult Schedule for Affective Disorders and Schizophrenia (WASH-U-KSADS) Washington University School of Medicine; St. Louis: 1996. [DOI] [PubMed] [Google Scholar]
- Goodwin FK, Jamison KR. Manic-depressive illness. New York: Oxford University Press; 1990. [Google Scholar]
- Hajek T, Bernier D, Slaney C, Propper L, Schmidt M, Carrey N, MacQueen G, Duffy A, Alda M. A comparison of affected and unaffected relatives of patients with bipolar disorder using proton magnetic resonance spectroscopy. Journal of Psychiatry and Neuroscience. 2008;33:531–540. [PMC free article] [PubMed] [Google Scholar]
- Hashimoto K, Sawa A, Iyo M. Increased levels of glutamate in brains from patients with mood disorders. Biological Psychiatry. 2007;62:1310–1316. doi: 10.1016/j.biopsych.2007.03.017. [DOI] [PubMed] [Google Scholar]
- Hoekstra R, Fekkes D, Loonen AJ, Pepplinkhuizen L, Tuinier S, Verhoeven WM. Bipolar mania and plasma amino acids: increased levels of glycine. European Neuropsychopharmacology. 2006;16:71–77. doi: 10.1016/j.euroneuro.2005.06.003. [DOI] [PubMed] [Google Scholar]
- Kaufman J, Birmaher B, Brent D, Rao U, Flynn C, Moreci P, Williamson D, Ryan N. Schedule for Affective Disorders and Schizophrenia for School-Age Children-Present and Lifetime Version (K-SADS-PL): initial reliability and validity data. Journal of the American Academy of Child and Adolescent Psychiatry. 1997;36:980–988. doi: 10.1097/00004583-199707000-00021. [DOI] [PubMed] [Google Scholar]
- Kaur S, Sassi RB, Axelson D, Nicoletti M, Brambilla P, Monkul ES, Hatch JP, Keshavan MS, Ryan N, Birmaher B, Soares JC. Cingulate cortex anatomical abnormalities in children and adolescents with bipolar disorder. American Journal of Psychiatry. 2005;162:1637–1643. doi: 10.1176/appi.ajp.162.9.1637. [DOI] [PubMed] [Google Scholar]
- Kugaya A, Sanacora G. Beyond monoamines: glutamatergic function in mood disorders. CNS Spectrums. 2005;10:808–819. doi: 10.1017/s1092852900010403. [DOI] [PubMed] [Google Scholar]
- Matsuo K, Nicoletti MA, Peluso MA, Hatch JP, Nemoto K, Watanabe Y, Nery FG, Monkul ES, Zunta-Soares GB, Bowden CL, Soares JC. Anterior cingulate volumes associated with trait impulsivity in individuals with bipolar disorder. Bipolar Disorders. 2009;11:628–636. doi: 10.1111/j.1399-5618.2009.00732.x. [DOI] [PubMed] [Google Scholar]
- Mayer D, Spielman DM. Detection of glutamate in the human brain at 3 T using optimized constant time point resolved spectroscopy. Magnetic Resonance in Medicine. 2005;54:439–442. doi: 10.1002/mrm.20571. [DOI] [PubMed] [Google Scholar]
- McCullumsmith RE, Kristiansen LV, Beneyto M, Scarr E, Dean B, Meador-Woodruff JH. Decreased NR1, NR2A, and SAP102 transcript expression in the hippocampus in bipolar disorder. Brain Research. 2007;1127:108–118. doi: 10.1016/j.brainres.2006.09.011. [DOI] [PMC free article] [PubMed] [Google Scholar]
- Michael N, Erfurth A, Ohrmann P, Gossling M, Arolt V, Heindel W, Pfleiderer B. Acute mania is accompanied by elevated glutamate/glutamine levels within the left dorsolateral prefrontal cortex. Psychopharmacology (Berl) 2003;168:344–346. doi: 10.1007/s00213-003-1440-z. [DOI] [PubMed] [Google Scholar]
- Mitani H, Shirayama Y, Yamada T, Maeda K, Ashby CR, Jr, Kawahara R. Correlation between plasma levels of glutamate, alanine and serine with severity of depression. Progress in Neuro-psychopharmacology and Biological Psychiatry. 2006;30:1155–1158. doi: 10.1016/j.pnpbp.2006.03.036. [DOI] [PubMed] [Google Scholar]
- Moore CM, Biederman J, Wozniak J, Mick E, Aleardi M, Wardrop M, Dougherty M, Harpold T, Hammerness P, Randall E, Renshaw PF. Differences in brain chemistry in children and adolescents with attention deficit hyperactivity disorder with and without comorbid bipolar disorder: a proton magnetic resonance spectroscopy study. American Journal of Psychiatry. 2006a;163:316–318. doi: 10.1176/appi.ajp.163.2.316. [DOI] [PMC free article] [PubMed] [Google Scholar]
- Moore CM, Wardrop M, de BFB, Renshaw PF. Topiramate raises anterior cingulate cortex glutamine levels in healthy men; a 4.0 T magnetic resonance spectroscopy study. Psychopharmacology (Berl) 2006b;188:236–243. doi: 10.1007/s00213-006-0451-y. [DOI] [PubMed] [Google Scholar]
- Moore CM, Biederman J, Wozniak J, Mick E, Aleardi M, Wardrop M, Dougherty M, Harpold T, Hammerness P, Randall E, Lyoo IK, Renshaw PF. Mania, glutamate/glutamine and risperidone in pediatric bipolar disorder: a proton magnetic resonance spectroscopy study of the anterior cingulate cortex. Journal of Affective Disorders. 2007a;99:19–25. doi: 10.1016/j.jad.2006.08.023. [DOI] [PMC free article] [PubMed] [Google Scholar]
- Moore CM, Frazier JA, Glod CA, Breeze JL, Dieterich M, Finn CT, Frederick B, Renshaw PF. Glutamine and glutamate levels in children and adolescents with bipolar disorder: a 4.0-T proton magnetic resonance spectroscopy study of the anterior cingulate cortex. Journal of the American Academy of Child and Adolescent Psychiatry. 2007b;46:524–534. doi: 10.1097/chi.0b013e31802f5f2c. [DOI] [PMC free article] [PubMed] [Google Scholar]
- Olvera RL, Caetano SC, Fonseca M, Nicoletti M, Stanley JA, Chen HH, Hatch JP, Hunter K, Pliszka SR, Soares JC. Low levels of N-acetyl aspartate in the left dorsolateral prefrontal cortex of pediatric bipolar patients. Journal of Child and Adolescent Psychopharmacology. 2007;17:461–473. doi: 10.1089/cap.2007.0102. [DOI] [PubMed] [Google Scholar]
- Ongür D, Drevets WC, Price JL. Glial reduction in the subgenual prefrontal cortex in mood disorders. Proceedings of the National Academy of Sciences USA. 1998;95:13290–13295. doi: 10.1073/pnas.95.22.13290. [DOI] [PMC free article] [PubMed] [Google Scholar]
- Ongür D, Jensen JE, Prescot AP, Stork C, Lundy M, Cohen BM, Renshaw PF. Abnormal Glutamatergic Neurotransmission and Neuronal-Glial Interactions in Acute Mania. Biological Psychiatry. 2008;64:718–726. doi: 10.1016/j.biopsych.2008.05.014. [DOI] [PMC free article] [PubMed] [Google Scholar]
- Orrego F, Villanueva S. The chemical nature of the main central excitatory transmitter: a critical appraisal based upon release studies and synaptic vesicle localization. Neuroscience. 1993;56:539–555. doi: 10.1016/0306-4522(93)90355-j. [DOI] [PubMed] [Google Scholar]
- Palomino A, González-Pinto A, Aldama A, González-Gómez C, Mosquera F, González-García G, Matute C. Decreased levels of plasma glutamate in patients with first-episode schizophrenia and bipolar disorder. Schizophrenia Research. 2007;95:174–178. doi: 10.1016/j.schres.2007.06.012. [DOI] [PubMed] [Google Scholar]
- Patel NC, DelBello MP, Cecil KM, Adler CM, Bryan HS, Stanford KE, Strakowski SM. Lithium treatment effects on Myo-inositol in adolescents with bipolar depression. Biological Psychiatry. 2006;60:998–1004. doi: 10.1016/j.biopsych.2006.07.029. [DOI] [PMC free article] [PubMed] [Google Scholar]
- Patel NC, DelBello MP, Cecil KM, Stanford KE, Adler CM, Strakowski SM. Temporal change in N-acetyl-aspartate concentrations in adolescents with bipolar depression treated with lithium. Journal of Child and Adolescent Psychopharmacology. 2008;18:132–139. doi: 10.1089/cap.2007.0088. [DOI] [PubMed] [Google Scholar]
- Pavuluri MN, Birmaher B, Naylor MW. Pediatric bipolar disorder: a review of the past 10 years. Journal of the American Academy of Child and Adolescent Psychiatry. 2005;44:846–871. doi: 10.1097/01.chi.0000170554.23422.c1. [DOI] [PubMed] [Google Scholar]
- Pickard BS, Knight HM, Hamilton RS, Soares DC, Walker R, Boyd JK, Machell J, Maclean A, McGhee KA, Condie A, Porteous DJ, St. Clair D, Davis I, Blackwood DH, Muir WJ. A common variant in the 3′UTR of the GRIK4 glutamate receptor gene affects transcript abundance and protects against bipolar disorder. Proceedings of the National Academy of Sciences. 2008;105:14940–14945. doi: 10.1073/pnas.0800643105. [DOI] [PMC free article] [PubMed] [Google Scholar]
- Post RM. Promising avenues of therapeutics for bipolar illness. Dialogues in Clinical Neuroscience. 2008;10:193–201. doi: 10.31887/DCNS.2008.10.2/rmpost. [DOI] [PMC free article] [PubMed] [Google Scholar]
- Poznanski EO, Cook SC, Carroll BJ. A depression rating scale for children. Pediatrics. 1979;64:442–450. [PubMed] [Google Scholar]
- Provencher SW. Automatic quantitation of localized in vivo 1H spectra with LCModel. NMR Biomed. 2001;14:260–264. doi: 10.1002/nbm.698. [DOI] [PubMed] [Google Scholar]
- Sanacora G, Zarate CA, Krystal JH, Manji HK. Targeting the glutamatergic system to develop novel, improved therapeutics for mood disorders. Nature Reviews Drug Discovery. 2008;7:426–437. doi: 10.1038/nrd2462. [DOI] [PMC free article] [PubMed] [Google Scholar]
- Scarr E, Pavey G, Sundram S, MacKinnon A, Dean B. Decreased hippocampal NMDA, but not kainate or AMPA receptors in bipolar disorder. Bipolar Disorders. 2003;5:257–264. doi: 10.1034/j.1399-5618.2003.00024.x. [DOI] [PubMed] [Google Scholar]
- Shibuya-Tayoshi S, Tayoshi S, Sumitani S, Ueno S, Harada M, Ohmori T. Lithium effects on brain glutamatergic and GABAergic systems of healthy volunteers as measured by proton magnetic resonance spectroscopy. Prog Neuropsychopharmacol Biol Psychiatry. 2008;32:249–256. doi: 10.1016/j.pnpbp.2007.08.015. [DOI] [PubMed] [Google Scholar]
- Szabo ST, Machado-Vieira R, Yuan P, Wang Y, Wei Y, Falke C, Cirelli C, Tononi G, Manji HK, Du J. Glutamate receptors as targets of protein kinase C in the pathophysiology and treatment of animal models of Mania. Neuropharmacology. 2008 doi: 10.1016/j.neuropharm.2008.08.015. [DOI] [PMC free article] [PubMed] [Google Scholar]
- Tkáč I, Oz G, Adriany G, Uǧurbil K, Gruetter R. In vivo (1)H NMR spectroscopy of the human brain at high magnetic fields: Metabolite quantification at 4T vs 7T. Magnetic Resonance in Medicine. 2009 doi: 10.1002/mrm.22086. Epub Ahead of Print. [DOI] [PMC free article] [PubMed] [Google Scholar]
- Wang JF, Shao L, Sun X, Young LT. Increased oxidative stress in the anterior cingulate cortex of subjects with bipolar disorder and schizophrenia. Bipolar Disorders. 2009;11:523–529. doi: 10.1111/j.1399-5618.2009.00717.x. [DOI] [PubMed] [Google Scholar]
- Young RC, Biggs JT, Ziegler VE, Meyer DA. A rating scale for mania: reliability, validity and sensitivity. British Journal of Psychiatry. 1978;133:429–435. doi: 10.1192/bjp.133.5.429. [DOI] [PubMed] [Google Scholar]