

Summary
Seventeen tissue microarrays (TMAs) were generated containing over 1,200 vascular tissues to create a global survey of human vasculature. We validate these TMAs by comparing the disease characteristics in these representative sections to the larger vessels and through demonstrating correlations in staining for 3 separate immunohistochemical antibodies in duplicate sections.
Background
Tissue microarrays (TMAs) are collections of multiple tissue cores placed in parallel in a single acceptor block and traditionally used to investigate protein expression in neoplastic tissues. We validated the use of TMAs to investigate protein expression in vascular segments.
Methods
Vascular tissues were collected from 100 adult subjects undergoing autopsy. A diverse set of vessels were harvested and arrayed over 17 TMAs. 1,377 unique tissues, each with a 1.5 mm feature size were analyzed using histochemical and immunohistochemical (IHC) diaminobenzidine (DAB) methods.
Results
Histomorphometric analysis of vascular disease demonstrated the TMA features captured the majority of the vascular alterations (intimal hyperplasia and atherosclerosis) seen in the original blood vessel section. Measurements of IHC staining intensity based on color deconvolution were used to quantify antigen abundance in defined regions of interest (ROI). Validation was performed using antibodies to connective tissue growth factor (CTGF), receptor for advanced glycation end products (AGER/RAGE) and matrix metalloproteinase 3 (MMP-3). IHC staining was highly correlated between duplicate features from the same vascular site over these three proteins.
Conclusion
This study validates the use of TMA technology to investigate the vascular wall utilizing staining intensity data.
Keywords: immunohistochemistry, media, vascular disease, human arteries
Introduction
Immunohistochemical (IHC) evaluation of protein expression has long been a useful method of investigating protein expression, function and localization in vascular disease. When properly performed, IHC has some benefits, compared to western blotting and other protein quantification methods, because it provides information about cellular and subcellular location. As a quantitative technique, IHC is limited by a relatively small dynamic range, difficulties of quantification and reproducibility, and low throughput [1]. High throughput IHC techniques have yet to be applied to the analysis of vascular disease. Such techniques could significantly reduce current impediments including high costs and intensive time use, that limit large scale analysis of slides and tissues [2,3]. To overcome these hurdles, we proposed to use tissue microarray (TMA) technology to pursue a scaled-up evaluation of more than a thousand vascular tissues in a single experiment.
TMAs are created by removing small cores of tissue from paraffin-embedded tissue “donor” blocks and arraying them on a single acceptor block [4]. As such, it is a low cost, high-throughput technique similar to other “-omic” type investigations [5]. Arrays of 400 spots in a single acceptor block are routinely made. Few investigators have used TMAs to examine non-neoplastic tissues. To our knowledge, only two other blood vessel-based TMAs have been described. In one, 3 punches of aortic tissue were taken from each of 47 individuals undergoing thoracic aorta repair to investigate the expression of matrix metalloproteinases and their inhibitors [6]. A second group used a TMA to investigate arterial neovascularization, inflammation, and apolipoprotein deposits in 294 arterial wall sections from three vessels obtained from 49 subjects [7,8].
To date, IHC has not been used as a quantitative method in vascular disease study. IHC is mainly used to show the presence of a protein of interest, while other techniques are used to quantify alterations in protein or gene expression levels between disease states. There has also been little evaluation of global vascular protein expression, as studies have often been limited to a single vascular artery or bed, such as the coronary artery, aorta or renal microvasculature [9–11]. The lack of global protein data has resulted in an incomplete picture of disease-related expression levels as genes and proteins are differentially expressed between unique vascular beds [12–15].
In a proof of concept experiment, we chose to investigate 3 proteins known to be expressed in the vasculature. These are the receptor for advanced glycation end products (RAGE), connective tissue growth factor (CTGF) and matrix metalloproteinase 3 (MMP-3). RAGE, a well-described receptor for advanced glycation end products, S100A4 and other ligands, activates an arterial inflammatory response through NFκB signaling [16]. CTGF is activated by TGF-β and modulates both vascular cell turnover and ECM production and is altered in arterial disease states [17]. MMP-3 is also involved in ECM alterations and is thought to participate in atherosclerosis-induced vascular remodeling [18].
We undertook a project to evaluate the feasibility of large scale, quantitative analysis of protein expression in a global collection of human vascular tissues. We created a new, prospective vascular tissue collection from 100 adult autopsies, developed and validated a new quantitative IHC staining method, and demonstrated the validity of a 1.5 mm punch size for vascular disease research. In total, 17 TMAs were generated containing 1,683 unique spots. IHC was performed for RAGE, CTGF and MMP-3 to validate the TMAs, with particular emphasis on the evaluation of medial and global staining patterns.
Methods
Harvesting and processing of tissues
One hundred adult autopsies were harvested at The Johns Hopkins Hospital and Johns Hopkins Bayview Medical Center over a 3-year period. Harvesting was limited to cases that were not known to be infected with HIV, hepatitis B, hepatitis C or tuberculosis and had a post mortem interval (PMI) of 28 hours or less. An IRB exemption was granted for this study from the Johns Hopkins School of Medicine IRB and tissue retrieval for this research was permitted by the hospital’s autopsy consent form. Phenotypic information was collected for each subject as available from the patient’s electronic hospital record. Additional pathologic variables were documented at autopsy including the degree of overall coronary atherosclerosis and aortic atherosclerosis. Atherosclerosis was graded on a none, minimal, mild, moderate, or severe scoring scale by gross examination (Tables 1 and 2).
Table 1.
Patient characteristics, comorbidities and vascular disease present at autopsy (N=100).
| Measured Variable | Percentage | Mean |
|---|---|---|
| Age (years) | 64 | |
| Male | 59 | |
| African American | 20 | |
| Asian | 2 | |
| Caucasian | 76 | |
| Hispanic | 2 | |
| PMI (hours) | 17.8 | |
| Height (cm) | 174 | |
| Weight (kg) | 83 | |
| BMI (kg/m2) | 27.5 | |
| Diabetes | 30 | |
| Hypertension | 62 | |
| Smoking history | 38 | |
| Hyperlipidemia | 40 | |
| Previous myocardial infarction | 13 | |
| Previous stroke | 16 | |
| Reported ESRD & CRF | 14 | |
| Calculated GFR | 37 | |
| Aortic atherosclerosis | 46* | |
| Coronary artery atherosclerosis | 43* | |
| Stent or CABG | 9 | |
| ARB | 15 | |
| ACEi | 23 | |
| Statin | 22 | |
| Diuretic | 31 |
= moderate or severe disease, Terms: PMI = Post mortem interval, CABG = Coronary artery bypass graft, ESRD & CRF = End stage renal disease and chronic renal failure, GFR= Glomerular filtration rate, ARB= Angiotensin receptor blocker, ACEi = ACE inhibitor. GFR was calculated using the MDRD equation.
Table 2.
Collected phenotype data from each subject.
| Measured Variable | Missing (%) |
|---|---|
| Study number | 0 |
| Autopsy number | 0 |
| Postmortem interval | 0 |
| Age | 0 |
| Sex | 0 |
| Race | 0 |
| Height | 2 |
| Weight | 1 |
| BMI | 2 |
| Presence of diabetes | 0 |
| Presence of hypertension | 0 |
| Smoking history | 9 |
| Myocardial infarction history | 0 |
| Stroke history | 0 |
| Neuropathy history | 0 |
| Extremity amputation history | 0 |
| Renal failure history | 0 |
| Medications | 8 |
| HbA1C level | 70* |
| Creatinine clearance | 9 |
| C Reactive Protein level | 81 |
| Homocysteine level | 91 |
| LDL level | 62 |
| HDL level | 62 |
| Triglycerides level | 46 |
| Cholesterol level | 57 |
| Blood pressure measurements | 21 |
| Cause of death | 0 |
Completeness represents the percentage of patients on whom particular phenotype data was available.
= HbA1C data available for 67% of diabetic subjects
A history of hypertension was determined based on a clinical diagnosis from the chart review. There was no attempt to assign hypertension to subjects based on collected blood pressure readings, many of which were taken during acute disease processes. A history of diabetes was also based on chart review and was variable in both type (26 type 2 diabetes mellitus subjects, 3 steroid-induced diabetes subjects and 1 type 1 diabetes mellitus subject) and duration by individual (2 weeks – 37 years). A smoking history included any subject with a history of smoking (remote or current) including all forms of tobacco. Duration of smoking and pack years was only available on a subset of individuals. Hyperlipidemia was defined as an amalgam of any clinical history of hypercholesterolemia, hypertriglyceridemia or hyperlipidemia obtained by chart review. A history of myocardial infarction, stroke, end stage renal disease (ESRD) or chronic renal failure (CRF) was obtained from either the medical record or directly from the autopsy. The extent of atherosclerosis in the aorta and coronary vessels was based exclusively on autopsy findings. Glomerular filtration rate (GFR) was estimated using the Modification of Diet in Renal Disease (MDRD) equation taking into account age, race, gender and serum creatinine [19].
Roughly 1–2 cm segments of blood vessels or tissue were taken from each site of interest (Table 3). All tissues were immediately placed in 10% buffered formalin (Cardinal Health, Dublin, OH) overnight. The following day the formalin fixed tissues were further sectioned into 2–3 mm tall vascular rings for processing and paraffin-embedding. Heavily-calcified tissue was avoided where possible, however, approximately 5 iliac samples required overnight decalcification in Formical (Decal Chemical Corporation, Tallman, NY). A single hematoxylin & eosin (H&E) slide was cut superficially from each block containing all of the blood vessels segments and vascular tissues. This slide is later referred to as the “whole tissue slide.”
Table 3.
Location of harvested vascular tissues. Listed tissues were formalin fixed and paraffin embedded.
| Blood Vessel | Harvest Site |
|---|---|
| Carotid artery | Inferior to the carotid bulb |
| Coronary artery | Proximal left anterior descending artery |
| Dermal vessels | Left chest wall |
| Dorsalis pedis artery | Superficial ankle |
| Iliac artery | Just distal to the aortic bifurcation |
| Internal mammary artery | Mid-chest wall |
| Mesenteric artery | Superior, distal to the first bifurcation |
| Pulmonary artery | Just proximal to the lung |
| Pulmonary parenchyma | Random peripheral section |
| Renal artery | Midway between the aorta and kidney |
| Renal interlobar/arcuate artery | Renal cortex/medulla interface |
| Renal cortex | Random |
| Retinal vessels | Posterior globe adjacent to the optic nerve |
TMA Creation
All block information was entered into TMAJ, a Java-based tool for TMA creation and management [20]. A feature (punch) size of 1.5 mm was selected to capture the full-thickness vessel wall (tunica intima and tunica media), and a 99-spot TMA was assembled using a manual tissue arrayer (Beecher Instruments, Silver Spring, MD) (Fig. 1). Each TMA contained 9 control and 90 autopsy tissues (Table 3). The following cores were used from each subject’s blood vessels: one random core of pulmonary parenchyma; one skin core including epidermis and dermis; one core of each large blood vessel generally chosen to capture the area of worst disease, unless the area was heavily calcified, in which case an adjacent area was selected; two random cores of renal cortex; two cores of coronary artery - one to capture the most atherosclerotic (non-heavily calcified) area and the second to capture the least diseased area (Fig. 2). Control tissues included three cores of placenta, an endothelial cell line, a vascular smooth muscle cell line, and four replicated tissues (renal cortex, coronary artery, carotid, lung) from other TMAs for between-slide controls. Quadruplicate samplings from the same tissue block for the coronary artery, carotid artery, lung, renal artery, pulmonary artery, internal mammary artery and skin were placed on the final TMA. Four-micron thick sections were cut from each block and placed on slides stored in a sealed container at −20°C until use for IHC.
Fig. 1.

Method of global vascular collection and array. (A) Tissues were harvested from 13 sites (Table 3). (B) Whole vessels were formalin-fixed and embedded into paraffin blocks (200x original composite image of carotid artery and mesenteric artery). (C) 1.5 mm cores were taken from each donor block and arrayed into 17 99-core TMAs (2x image of TMA). (D) Representative images of blood vessels present on a TMA (200x original image of coronary artery and internal mammary artery).
Fig. 2.

Representative images of 1.5 mm feature sizes of collected blood vessels. From each tissue, a region of interest (media ± intima) is selected for analysis (circled region). The inset histogram shows DAB stain intensity on the x-axis (0–255 scale) and number of pixels on the y-axis. Left-shifted peaks and distributions are noted for lighter staining tissues. (A) Mesenteric artery stained for CTGF; (B) Coronary artery stained for CTGF; (C) Carotid artery stained for MMP-3; (D) Iliac artery stained for MMP-3; (E) Internal mammary artery stained for CTGF; (F) Arcuate artery stained for CTGF; (G) Dorsalis pedis artery stained for MMP-3, (H) Renal cortex stained for RAGE; (I) Renal artery stained for RAGE.
TMA and whole slide vascular disease measures
All blood vessels were evaluated for the presence of endothelial cells, calcifications, and vascular disease in both the whole slides and TMA spots. Only the coronary, iliac, and carotid arteries had sufficient atherosclerosis (versus arteriosclerosis) to be evaluated by the AHA atherosclerosis grading scale (I–VI) [21]. A novel vascular disease grading method, taking into account intimal thickening was developed and used to grade all blood vessels as: no disease (0), intimal hyperplasia <50% of the vessel wall (1), intimal hyperplasia >50% of the vessel wall or early atherosclerosis (small lipid cores or noncellular intimal expansion) (2), or marked atherosclerosis (large lipid cores, fibroatheromas, etc.) (3). Renal fibrosis was graded as minimal (0), mild (1), moderate (2), or marked (3) based on observer scoring of extracellular collagen between renal tubules on H&E stained slides. A separate Masson Trichrome stain was performed on each TMA in which % collagen (fibrosis) was determined by colorimetric analysis [22]. The presence of calcification and endothelium were recorded as present or absent. Endothelium was evaluated by H&E on all tissues and confirmed by CD31 IHC staining on a subset of 10 TMAs. All scoring was performed by a blinded cardiovascular pathologist (MKH).
Immunohistochemical staining
Antibodies were obtained from commercially available sources: CTGF ab6992 Abcam (Cambridge, MA), MMP-3 clone SL-1 Labvision (Fremont, CA), RAGE RDI-Fitzgerald (Concord, MA). These proteins were chosen to represent functional regulatory pathways in vascular tissues surmised to vary between individuals. All antibodies were validated in autolyzed vascular tissues which anticipated that postmortem interval (PMI) would not significantly affect stain intensity [23]. Antibody dilutions were 1:4,000 (RAGE), 1:20 (MMP-3) and 1:200 (CTGF). Antigen retrieval and all methods for antibody incubation and diaminobenzidine (DAB) staining were performed as previously described in detail [23]. Staining patterns were confirmed by comparison to images available from the Human Protein Atlas [24]. Staining for CD31 was performed on an automated Benchmark XT stainer using proprietary stains and reagents (Ventana Medical Systems, Tuscon, AZ).
Slide scanning and image analysis
All slides were scanned at 200X on a ScanScope CS (Aperio, Vista, CA) digital imaging system. TMA Lab, a companion software package, segmented each whole slide image into the component core images, outputting each as a separate TIFF image file. Regions of interest (ROI) were selected from each image through a markup algorithm in ImageJ [25,26]. For MMP-3 and CTGF, the vascular media alone was selected as the ROI due to variability in staining intensity differences between the media and intima. For RAGE, the intima and media were selected together as the ROI. Color deconvolution was used to separate the dye contribution at each pixel in a given image’s ROI [26,27]. A distribution of DAB stain intensity was generated for each ROI, from which a median intensity value was calculated using ImageJ based analysis macros [26]. The DAB stain intensity is a unitless value ranging between 0 and 255.
Data handling and statistical analysis
All image data were written to tab-delimited text files and stored and manipulated in Excel 2007 (Microsoft, Redmond, WA). χ2 analysis was used to compare TMA spot and “whole tissue slide” relationships for the presence of endothelium and degree of arteriosclerosis/atherosclerosis. Two-sample t-tests and Fisher’s exact tests were used to compare categorical calcification scores, AHA atherosclerosis scores and vascular disease scores. Bonferroni adjustments for multiple tests were performed. Multivariable logistic regression models were used to assess the association of clinical phenotypes with pathologic changes after multivariable adjustment. Pearson’s correlation and logistic regression were used to evaluate the relationship between IHC staining and PMI. Pairwise correlations were used to determine the relationship between duplicated TMA spots. Statistical analyses were performed using Stata 10 (Stata, Inc, College Station, TX).
Results
Population characteristics
For the 100 harvested cases, the average PMI was 17.8 hours (range: 4 to 28 hours). Thirty-six subjects had neither hypertension nor diabetes, 34 had hypertension alone and 30 subjects had diabetes. Of the diabetic subjects, 28 (93%) had concurrent hypertension. General subject characteristics are presented in Table 1. The top six causes of death in this study set (categories based on U.S. death statistics) were malignant neoplasms (39%), diseases of the heart (19%), ‘other’ (12%), influenza/pneumonia (9%), chronic lower respiratory diseases (5%) and chronic liver disease (5%), accounting for 89% of the cohort [28].
Measures of Completeness
Of the 1,500 expected tissues, 1,457 were collected (97%). Retinal vessels (21 cases) and dorsalis pedis artery (9 cases) were the tissues most frequently absent due to autopsy consents limited to the chest and abdomen and difficulty in procurement. The initial H&E-stained slides generated for each TMA identified 40 cores that were missing or of poor quality. Repeat punches of these tissues were added to later TMAs to fill holes missing from the incomplete collection. Microvascular skin and retinal vessels did not lend themselves to high-throughput analysis, and analyses of these cores were excluded from this project. Also, 31 tissues were noted to be extensively calcified, autolyzed or acellular and were excluded from diagnostic use. This left 1,377 subject samples to be evaluated and 86 staining controls (placenta and cell lines). Overall, 89% of these sample features were of sufficient quality to be analyzed for IHC staining (1,223 (89%) for CTGF, 1,218 (88%) for RAGE, and 1,242 (90%) for MMP-3).
Vascular tissue characteristics
A 1.5 mm core size allowed the analysis of the full thickness (tunica intima and tunica media) of over 97% of the vessels investigated (Fig. 2). Full thickness was achieved for nearly 100% of the smaller arteries (renal, pulmonary, mesenteric, dorsalis pedis, arcuate, and internal mammary). For the larger vessels, some of which had atherosclerotic plaques, full thickness cores were not achieved in 10%, 6% and 2% of the carotid, iliac and coronary arteries, respectively.
The presence of calcifications and the severity of atherosclerosis were assessed for each core. The percent of TMA spots with calcification was highest in the coronary (34%), iliac (18%), dorsalis pedis (8%), and carotid arteries (5%) and negligible (3% or less) in the remaining vessels. By AHA scoring, atheromatous plaques (IV–VI) were common in the coronary (67%), iliac (26%) and carotid arteries (8%) but negligible elsewhere. By our novel vascular scoring scale, severe atherosclerosis (grade 3) was also highest in the coronary (51%), iliac (16%), and carotid arteries (5%) and negligible (2% or less) for the remaining vessels.
Extent of vascular disease is mostly concordant between TMA and whole tissue slide scoring
The vascular disease scores and renal fibrosis score were determined for each TMA core and compared to the “whole tissue slide” scores to ascertain how successful the 1.5 mm features were at capturing information observed in the larger tissue sections. There was a highly significant agreement between the core and whole tissue slide score values for vascular disease (χ2 = 756.3, N = 968, df = 16, p < 0.0001). Sixty percent of tissues shared an identical score and 35% varied by a single scoring value. When scores were discordant, 77% were lower in the core relative to the whole tissue slide.
The AHA scoring system on the coronary, carotid and iliac arteries was segmented into preatheroma (AHA I–III) and atheroma (AHA IV–VI) scores. There was strong agreement between the TMA cores and whole tissue slides (χ2 = 101.77, N = 295, df = 4, p < 0.0001). Six percent of TMAs were scored as having atheroma not noted on the whole tissue slides.
There was strong agreement for the presence of calcifications in the whole tissues and TMAs despite an attempt to avoid sampling calcified regions of vessels in the TMAs (χ2 = 290.2, N = 869, df = 4, p < 0.0001). TMAs and whole tissue slides showed 88% concordance for calcification. In 99% of the discordant cases, calcification was only present in the whole tissue slide.
Renal fibrosis scoring was mostly concordant between TMA and whole tissue slide scoring
Renal fibrosis scores, based on H&E staining were compared to % collagen determinations made on Masson Trichrome stained TMA slides. Based on the % collagen values calculated using color picking software, it was determined that the minimal fibrosis score was between 2–17% collagen, mild fibrosis was between 17–28% collagen, moderate fibrosis was between 28–40% collagen and marked fibrosis was >40% collagen (χ2 =137, p<0.0001, df= 9, N=206). There was significant agreement between scores of renal fibrosis for TMA cores and whole tissue slides (χ2 = 56.7, N = 99, df = 16, p < 0.0001). Forty-eight percent had identical scores and 46% varied by a single scoring value.
Relationship between disease variables, vascular disease, and calcification in whole tissues and TMA cores
Phenotypic information including a subject’s age, sex, diabetes status, hypertension status, ethnicity, BMI, smoking history and presence of hyperlipidemia was evaluated in relation to vascular disease severity and presence of calcifications for both TMAs and whole tissue slides. We compared the associations between phenotypic variables and the grading of the two tissue sources. Overall, after bonferroni adjustment, 122 of the 128 measures demonstrated no correlation. Age was a significant predictor of iliac artery atherosclerosis and calcification in both the whole tissue slides and TMA slides (p≤0.001). A history of hypertension significantly associated with iliac artery calcification and AHA scored atheroma in the whole tissue slides (p≤0.002), but was not associated in the TMAs. Conversely, non-white ethnicity associated with increased carotid artery atheroma by AHA scoring in the TMAs (p=0.002), but not in the whole tissue slides. Thus among positive associations, 3/6 (50%) were concurrent between tissue sources.
We further investigated common risk factors for vascular disease in a multivariable logistic regression model in the TMA cores. In a multivariable logistic regression model of age, diabetes and hypertension, only age was found to be significantly associated with vascular calcification of the carotid, coronary, dorsalis pedis and iliac arteries (odds ratios 1.04–1.09 per 1 year increase in age). In a logistic regression model with age, diabetes and hypertension, diabetes was associated with more severe atherosclerosis in multiple vessels (arcuate, carotid, dorsalis pedis, mesenteric, pulmonary, renal arteries; odds ratios 1.5–6.2). Hypertension was not significantly associated with atherosclerosis in any of the arteries by multivariable analysis.
Effects of postmortem interval (PMI)
The contribution of PMI to the presence or absence of endothelium and the intensity of IHC staining was investigated. The presence of endothelial cells (ECs), as evaluated by CD31 staining was available on 60 cases and was similar to that observed on H&E stained slides (χ2 = 68.2, p < 0.0001), confirming the validity of EC determination by H&E only. Having a PMI interval of >15 hours was associated with the absence of ECs in all 9 blood vessels studied in the TMA spots (odds ratios 0.84–0.97, logistic regression). This value was statistically significant (p < 0.05) in all but 3 vessels (renal, pulmonary and dorsalis pedis). Overall, the percentage of blood vessels losing endothelial cells in a given subject correlated with PMI in both the TMA (r = 0.47) and in the whole tissue sample (r = 0.59).
Overall, 82% (27/33) of the vascular tissues had no significant correlation between PMI and median staining intensity by Pearson’s correlation (Table 4). Of the 6 statistically significant correlations, 3 correlated with enhanced staining intensity and 3 correlated with reduced staining intensity. Only for CTGF, was a trend of decreased staining intensity with PMI present across all tissues.
Table 4.
Pearson correlations (r) of staining intensity of RAGE, MMP-3 and CTGF (all in arbitrary units) with postmortem interval (hours) by vascular tissues types.
| RAGE |
MMP-3 |
CTGF |
||||
|---|---|---|---|---|---|---|
| Vascular Tissue | r | p | r | p | r | p |
| Carotid artery | 0.06 | 0.56 | −0.23 | 0.03 | −0.10 | 0.33 |
| Coronary artery | 0.03 | 0.75 | 0.11 | 0.27 | −0.15 | 0.14 |
| Dorsalis artery | 0.20 | 0.07 | 0.09 | 0.39 | −0.07 | 0.51 |
| Iliac artery | −0.12 | 0.31 | 0.00 | 0.97 | −0.26 | 0.03 |
| Internal mammary artery | 0.15 | 0.16 | 0.06 | 0.58 | −0.06 | 0.56 |
| Mesenteric artery | 0.11 | 0.29 | −0.02 | 0.78 | −0.10 | 0.34 |
| Pulmonary artery | 0.03 | 0.75 | 0.07 | 0.51 | −0.12 | 0.25 |
| Pulmonary parenchyma | −0.12 | 0.23 | 0.09 | 0.39 | −0.25 | 0.02 |
| Renal artery | 0.08 | 0.48 | 0.30 | 0.01 | 0.00 | 0.98 |
| Renal interlobar/arcuate artery | 0.29 | 0.02 | 0.16 | 0.15 | −0.14 | 0.25 |
| Renal cortex | 0.06 | 0.57 | 0.38 | 0.0001 | −0.11 | 0.28 |
Strong correlation of duplicate renal glomerular staining
The duplicate cores of renal cortex from a given individual on the same TMA, and the subset (N=17) of renal cortex samples placed on an additional TMA were evaluated for median glomerular ROI staining intensity variation. Both within and across slide variation in median staining intensity for glomerular ROI was identified. The within slide correlations were high for all three antibodies (r = 0.93, 0.85, and 0.92 for CTGF, RAGE, and MMP-3 respectively, Fig. 3a–c). When comparing across slides, the sample sizes were smaller (N<18), but the correlations remained generally robust (r = 0.38, 0.88 and 0.80 for CTGF, RAGE, and MMP-3 respectively, Fig. 3d).
Fig. 3.

Reproducibility of glomeruli staining. (A–C) Median intensity values correlate strongly between glomeruli taken from two renal cortex punches of tissue on the same TMA slide (CTGF, N = 84; RAGE, N = 86; MMP-3, N = 90). (D) Correlation of median intensity values of CTGF, RAGE and MMP-3 of renal glomeruli across multiple TMAs. Glomeruli A is one sample from the first TMA. Glomeruli C is the value taken from a second TMA (N = 17, 17, 15 for RAGE, MMP-3 and CTGF).
High reliability of the method demonstrated for each protein in repeated samples
We calculated the variance of the mean staining intensity in the carotid artery within and between individuals for RAGE, MMP-3, and CTGF. The within subject variance was estimated from the expression of five repeat samples from the carotid artery on the same subject across two TMAs. The between subject variance was estimated using 94 independent subjects with valid RAGE, MMP-3, and CTGF staining for the carotid artery. The within subject variability for each protein was substantially less than the between person variability, with non-overlapping 95% confidence intervals for the variance estimates, demonstrating high reliability of the method for all three proteins (Table 5, Fig. 4). Similar results were observed for the coronary, internal mammary and pulmonary arteries (data not shown).
Table 5.
Variance of the mean for staining of the carotid artery by three proteins. Duplicate samples taken from the same subject, “Within” (N=5), show significantly less variance than nonduplicated samples taken from the entire cohort, “Between” (N=94).
| Within |
Between |
|||||
|---|---|---|---|---|---|---|
| Protein | Variance | Lower CI | Upper CI | Variance | Lower CI | Upper CI |
| RAGE | 7.84 | 2.82 | 64.76 | 332.46 | 254.33 | 453.28 |
| MMP-3 | 27.20 | 9.76 | 224.56 | 392.15 | 299.98 | 534.66 |
| CTGF | 7.10 | 2.55 | 58.66 | 1051.45 | 804.34 | 1433.55 |
CI = 95% Confidence Intervals.
Fig. 4.

Histogram distributions of DAB stain intensity for RAGE carotid artery IHC. There is marked overlap between the duplicate “Within” carotid features from the same individual (A) which is not present in the “Between” features of the entire cohort (B).
The color deconvolution technique results in a wide dynamic range
The dynamic range of median intensities obtained from color deconvolution of IHC staining has never been described. In general the dynamic range of IHC staining is thought to be small. We evaluated the fold difference of median staining intensity for each antibody and tissue. The methodologic range of median intensity values is 0–255, however the actual range based on our data set was 21–248 (>10 fold). There was an average 3.9 fold range for the 8 vessels (arcuate, carotid, coronary, dorsalis pedis, iliac, internal mammary, mesenteric, pulmonary and renal) across all three proteins evaluated. The widest dynamic range of median intensity values was a 6.8 fold difference for the CTGF staining of the dorsalis pedis (36–247). The narrowest dynamic range was a 2.2 fold difference for the carotid artery stained for RAGE (39–87). Kidney and lung tissues had smaller dynamic ranges of median intensity across all 3 proteins (2.1 and 1.6, respectively) relative to the vascular tissues. The control tissues (placenta, endothelial cell line and smooth muscle cell line) had the smallest dynamic range with an overall 1.5 fold dynamic range for all 3 proteins.
Variability of median staining intensity by blood vessel
For each protein, the average of the median staining intensity between vessels was calculated to determine the variability across diverse tissues (Fig. 5). Generally, MMP-3 and CTGF stained this diverse set of tissues in a similar fashion, in contrast to RAGE. For MMP-3, the carotid artery (average = 95) and dorsalis pedis artery (average = 152) had the least similar staining intensity. For CTGF, the strongest and weakest staining blood vessels were the dorsalis pedis (average = 166) and the renal artery (average = 97). RAGE expression was relatively low in most blood vessels (average range of 72–103), but was strong in the kidney (average = 157) and lung parenchyma (average = 191).
Fig. 5.
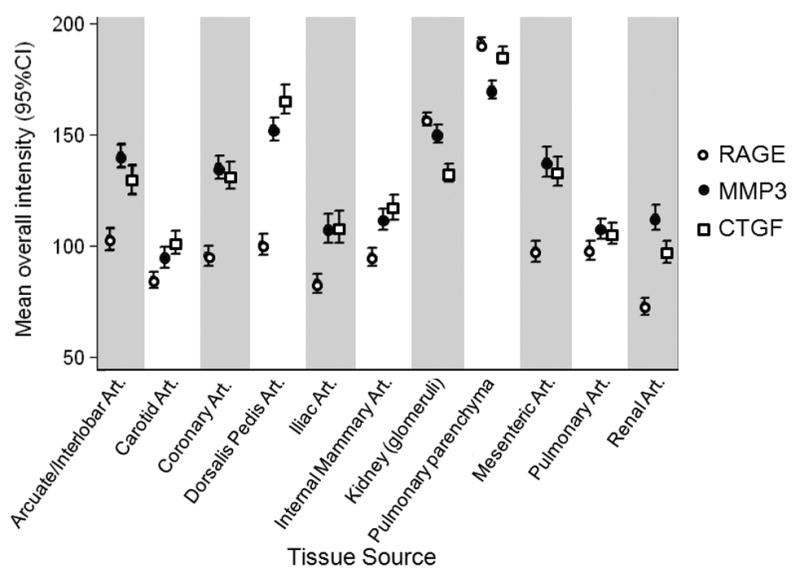
Average of median staining intensities for RAGE, MMP-3 and CTGF across 11 tissues. Error bars are 95% confidence intervals. Art. = Artery.
Discussion
This paper describes and validates useful parameters for the creation of vascular TMAs. We show that a 1.5 mm core size significantly captures the vascular disease present in the whole tissue slide and has concordant correlations with disease variables 97% of the time. A 1.5 mm core also captures the full thickness of a blood vessel >97% of the time. There is a trade off between core size and core density with smaller cores (0.6 mm) routinely being arrayed at ~400 cores/block and 2 mm cores being arrayed at ~60 cores/block. To maximize density and increase throughput, one should use the smallest diameter core possible to capture the greatest amount of information. In the cancer TMA literature, two to three 0.6 mm features per tumor case are considered necessary and/or sufficient due to heterogeneity of staining within a given tumor [29,30]. Our samples show similar median staining values between multiple features from the same individual’s blood vessel or multiple glomeruli from duplicate cores (Table 5, Fig. 4). We believe this low amount of heterogeneity obviates the need for multiple core replicates from each individual. Both by direct comparison of grading scales and by comparison to disease variables (age, hypertension, etc) the TMA core captured much of the vascular disease observed in the whole slide sections from the donor blocks (95% within one grade). Therefore, a single 1.5 mm core size should be sufficient for most vascular TMA studies.
The blood vessels selected for this study represent the major medium-to-large caliber vessels in the torso, with the exception of the aorta. They were specifically chosen to include both atherosclerosis-resistant (IMA, pulmonary) and atherosclerosis prone (coronary, iliac) tissues and allow us to determine global staining variability. Generally, the AHA atherosclerosis score is used to document vascular disease; however, for this study it could only be used on 3 vessels, necessitating the creation of our own scoring system that took into account the degree in intimal hyperplasia, short of the appearance of foam cells or lipid cores. Our new scoring system has not been validated and may have impacted on the general lack of associations with clinical phenotypes.
This study was designed to validate the creation and use of vascular TMAs. However, we also investigated the relationship of the three proteins evaluated in this study (MMP-3, CTGF and RAGE) with clinical variables. We found no significant associations of protein IHC staining with any of the phenotypic variables. We have subsequently used this set of TMAs to identify a correlation of tissue inhibitor of matrix metalloproteinase-3 (TIMP-3) staining and aging [31].
While autopsy tissues have been used for IHC study for decades, there has not been a proper evaluation of the role of PMI on IHC staining. Studies that mixed autopsy and surgical pathology tissues have hoped, rather than demonstrated, that PMI does not influence the observed variability. Our experiment provides strong evidence that autopsy tissues can be used for IHC study. We and others have shown certain classes of antibodies stain robustly in autolyzed surgical tissues, although this is not a perfect surrogate to autopsy tissues [23,32–34]. We now demonstrate that a reasonable PMI (~24 hours or less) has negligible effect on antibody staining in most blood vessels (94%). In those cases in which the PMI alters staining intensity, we found it both lowered and raised median staining intensity. In fact, the strongest correlation between PMI and staining intensity was an increase, not a decrease, in staining in renal glomeruli for MMP-3. As the body cools, the kidney, being retroperitoneal and surrounded by other organs and adipose, would likely cool slower that other areas of the body that have more exposure. We had anticipated that any impact of PMI would affect renal tissues more than other vascular sites and that held true.
This study identifies benefits and limitations of using TMAs for vascular research. We found the media to be the most homogenous part of the wall, being uniformly comprised of smooth muscle cells and therefore more representative of the wider blood vessel, than the more heterogeneous intima, which had a range of pathologic features. We found that the endothelial cell layer was too thin to reliably be selected for analysis. Also, the endothelium is known to slough off in autopsy tissues and was thus not apparent on many of our tissues with extended PMIs. Another limitation of the TMA is vessel caliber. As stated above, the small size of the skin and retinal vessels did not lend themselves to high-throughput methods and were excluded. A third limitation of our collection was the variability in procurement for certain vessels. For example, the iliac artery was routinely taken just beyond the aortic bifurcation, however in subjects with extensive calcification at this site, the iliac was sampled more distally. This also was true of the coronary artery, in which the left anterior descending artery was generally taken, but could vary due to extensive calcification or stent placement. Therefore, we knowingly did not capture the worst atherosclerosis in each individual, resulting in further intimal heterogeneity and affecting the relationship with phenotypic and clinical variables, as reported above . This may impact the evaluation of proteins or alterations that specifically occur in sites of atheromas rather than proteins found in the media and which change their expression more as a result of global alterations. Future TMAs that are designed to specifically investigate atheromas may need to approach the TMA design differently to maximize the evaluation of severe disease. The converse to altering harvesting locations is to collect heavily calcified tissues and use a decalcifying agent on it, which can also negatively affect IHC results [35].
We found useful heterogeneity in tissue staining values within this tissue collection. There was a wide dynamic range in the experimental vascular tissues (3.9 fold). Conversely, there was little variation (1.5 fold) between control tissue samples (placenta, endothelial cell line, smooth muscle cell line), indicating little IHC variation from slide to slide. Fig. 5 demonstrates the variability of the 3 proteins across the vascular tissues. Average staining for MMP-3 and CTGF varied widely by vascular site consistent with prior reports of gene expression variability between vessels [12]. Also, the average staining of MMP-3 and CTGF were similar in tissues, perhaps related to the known interaction between these two proteins [36]. Average vascular RAGE staining was generally constant between vessels, but increased markedly in the pulmonary parenchyma and renal glomeruli. This variation across the 3 proteins suggests correlation with known biological phenomenon indicating the usefulness of a TMA platform to detect biologically relevant associations that may vary by blood vessel.
From this experience, we believe vascular TMAs can be created from the stored pathologic tissues housed at most hospital-based institutions. Vessels can be collected from explanted heart, carotid endarterectomy, aortic repair, or extremity amputation specimens to investigate the presence and distribution of proteins of interest in these vascular beds for different vascular diseases.
In conclusion, this study demonstrates the first use of TMA technology to assess protein expression patterns in a global vascular collection. We show that a single 1.5 mm core is a sufficient representation of a given blood vessel and that a reasonable PMI has limited influence on IHC staining intensity. We also validate the use of color deconvolution as a measure of IHC staining intensity. TMAs can be a powerful new tool to address protein expression in vascular disease in a low cost, high-throughput fashion.
Acknowledgments
This work was supported by the American Diabetes Association (1-05-JF-20 to MKH) and by the NIH/NIDDK (K01 DK076595 to ES). The authors with to thank Dr. David Cutler for his ideas on quantitative analysis, Kristen Lecksell for her tireless scanning of TMAs, and Dr. Nispa Krongkaew for database assistance.
Funding and conflict of interest: Funding was provided for by a grant from the American Diabetes Association (1-05-JF-20 to MKH) and a grant from the NIH/NIDDK (K01 DK076595 to ES).
Footnotes
The authors report no conflict of interest.
References
- 1.Rimm DL. What brown cannot do for you. Nat Biotechnol. 2006;24:914–6. doi: 10.1038/nbt0806-914. [DOI] [PubMed] [Google Scholar]
- 2.Inoue K, Kawahara K, Biswas KK, Ando K, Mitsudo K, Nobuyoshi M, Maruyama I. HMGB1 expression by activated vascular smooth muscle cells in advanced human atherosclerosis plaques. Cardiovasc Pathol. 2007;16:136–43. doi: 10.1016/j.carpath.2006.11.006. [DOI] [PubMed] [Google Scholar]
- 3.Rutanen J, Leppanen P, Tuomisto TT, Rissanen TT, Hiltunen MO, Vajanto I, et al. Vascular endothelial growth factor-D expression in human atherosclerotic lesions. Cardiovasc Res. 2003;59:971–9. doi: 10.1016/s0008-6363(03)00518-2. [DOI] [PubMed] [Google Scholar]
- 4.Kononen J, Bubendorf L, Kallioniemi A, Barlund M, Schraml P, Leighton S, et al. Tissue microarrays for high-throughput molecular profiling of tumor specimens. Nat Med. 1998;4:844–7. doi: 10.1038/nm0798-844. [DOI] [PubMed] [Google Scholar]
- 5.Packeisen J, Korsching E, Herbst H, Boecker W, Buerger H. Demystified. tissue microarray technology. Mol Pathol. 2003;56:198–204. doi: 10.1136/mp.56.4.198. [DOI] [PMC free article] [PubMed] [Google Scholar]
- 6.Koullias GJ, Ravichandran P, Korkolis DP, Rimm DL, Elefteriades JA. Increased tissue microarray matrix metalloproteinase expression favors proteolysis in thoracic aortic aneurysms and dissections. Ann Thorac Surg. 2004;78:2106–10. doi: 10.1016/j.athoracsur.2004.05.088. [DOI] [PubMed] [Google Scholar]
- 7.Fleiner M, Kummer M, Mirlacher M, Sauter G, Cathomas G, Krapf R, Biedermann BC. Arterial neovascularization and inflammation in vulnerable patients: early and late signs of symptomatic atherosclerosis. Circulation. 2004;110:2843–50. doi: 10.1161/01.CIR.0000146787.16297.E8. [DOI] [PubMed] [Google Scholar]
- 8.Wyler von Ballmoos M, Dubler D, Mirlacher M, Cathomas G, Muser J, Biedermann BC. Increased apolipoprotein deposits in early atherosclerotic lesions distinguish symptomatic from asymptomatic patients. Arterioscler Thromb Vasc Biol. 2006;26:359–64. doi: 10.1161/01.ATV.0000198250.91406.6d. [DOI] [PubMed] [Google Scholar]
- 9.Zulli A, Burrell LM, Widdop RE, Black MJ, Buxton BF, Hare DL. Immunolocalization of ACE2 and AT2 receptors in rabbit atherosclerotic plaques. J Histochem Cytochem. 2006;54:147–50. doi: 10.1369/jhc.5C6782.2005. [DOI] [PubMed] [Google Scholar]
- 10.Garcia-Ramirez M, Martinez-Gonzalez J, Juan-Babot JO, Rodriguez C, Badimon L. Transcription factor SOX18 is expressed in human coronary atherosclerotic lesions and regulates DNA synthesis and vascular cell growth. Arterioscler Thromb Vasc Biol. 2005;25:2398–403. doi: 10.1161/01.ATV.0000187464.81959.23. [DOI] [PubMed] [Google Scholar]
- 11.Sun H, Zheng JM, Chen S, Zeng CH, Liu ZH, Li LS. Enhanced expression of ANGPTL2 in the microvascular lesions of diabetic glomerulopathy. Nephron Exp Nephrol. 2007;105:e117–23. doi: 10.1159/000100493. [DOI] [PubMed] [Google Scholar]
- 12.Qin M, Zeng Z, Zheng J, Shah PK, Schwartz SM, Adams LD, Sharifi BG. Suppression subtractive hybridization identifies distinctive expression markers for coronary and internal mammary arteries. Arterioscler Thromb Vasc Biol. 2003;23:425–33. doi: 10.1161/01.ATV.0000059303.94760.5C. [DOI] [PMC free article] [PubMed] [Google Scholar]
- 13.Adams LD, Geary RL, McManus B, Schwartz SM. A comparison of aorta and vena cava medial message expression by cDNA array analysis identifies a set of 68 consistently differentially expressed genes, all in aortic media. Circ Res. 2000;87:623–31. doi: 10.1161/01.res.87.7.623. [DOI] [PubMed] [Google Scholar]
- 14.Sage H, Pritzl P, Bornstein P. Secretory phenotypes of endothelial cells in culture: comparison of aortic, venous, capillary, and corneal endothelium. Arteriosclerosis. 1981;1:427–42. doi: 10.1161/01.atv.1.6.427. [DOI] [PubMed] [Google Scholar]
- 15.Aird WC. Phenotypic heterogeneity of the endothelium: I. Structure, function, and mechanisms. Circ Res. 2007;100:158–73. doi: 10.1161/01.RES.0000255691.76142.4a. [DOI] [PubMed] [Google Scholar]
- 16.Goldin A, Beckman JA, Schmidt AM, Creager MA. Advanced glycation end products: sparking the development of diabetic vascular injury. Circulation. 2006;114:597–605. doi: 10.1161/CIRCULATIONAHA.106.621854. [DOI] [PubMed] [Google Scholar]
- 17.Wang X, LeMaire SA, Chen L, Shen YH, Gan Y, Bartsch H, Carter SA, Utama B, Ou H, Coselli JS, Wang XL. Increased collagen deposition and elevated expression of connective tissue growth factor in human thoracic aortic dissection. Circulation. 2006;114:I200–205. doi: 10.1161/CIRCULATIONAHA.105.000240. [DOI] [PMC free article] [PubMed] [Google Scholar]
- 18.Ye S, Humphries S, Henney A. Matrix metalloproteinases: implication in vascular matrix remodelling during atherogenesis. Clin Sci (Lond) 1998;94:103–110. doi: 10.1042/cs0940103. [DOI] [PubMed] [Google Scholar]
- 19.Prigent A. Monitoring renal function and limitations of renal function tests. Semin Nucl Med. 2008;38:32–46. doi: 10.1053/j.semnuclmed.2007.09.003. [DOI] [PubMed] [Google Scholar]
- 20.Faith DA, Isaacs WB, Morgan JD, Fedor HL, Hicks JL, Mangold LA, Walsh PC, Partin AW, Platz EA, Luo J, De Marzo AM. Trefoil factor 3 overexpression in prostatic carcinoma: prognostic importance using tissue microarrays. Prostate. 2004;61:215–227. doi: 10.1002/pros.20095. [DOI] [PMC free article] [PubMed] [Google Scholar]
- 21.Stary HC, Chandler AB, Dinsmore RE, Fuster V, Glagov S, Insull W, Jr, Rosenfeld ME, Schwartz CJ, Wagner WD, Wissler RW. A definition of advanced types of atherosclerotic lesions and a histological classification of atherosclerosis. A report from the Committee on Vascular Lesions of the Council on Arteriosclerosis, American Heart Association. Circulation. 1995;92:1355–1374. doi: 10.1161/01.cir.92.5.1355. [DOI] [PubMed] [Google Scholar]
- 22.Cornish TC, De Marzo AM, Gurel B, Morgan J. Advancing Practice, Instruction and Innovation Through Informatics. Pittsburgh, PA: 2007. FRIDA: An open source framework for image dataset analysis. [Google Scholar]
- 23.Maleszewski J, Lu J, Fox-Talbot K, Halushka MK. Robust immunohistochemical staining of several classes of proteins in tissues subjected to autolysis. J Histochem Cytochem. 2007;55:597–606. doi: 10.1369/jhc.6A7152.2007. [DOI] [PubMed] [Google Scholar]
- 24.Uhlen M, Bjorling E, Agaton C, Szigyarto CA, Amini B, Andersen E, et al. A human protein atlas for normal and cancer tissues based on antibody proteomics. Mol Cell Proteomics. 2005;4:1920–1932. doi: 10.1074/mcp.M500279-MCP200. [DOI] [PubMed] [Google Scholar]
- 25.Rasband WS. ImageJ. National Institutes of Health; Bethesda, Maryland, USA: pp. 1997–2004. [Google Scholar]
- 26.Cornish TC, Halushka MK. Color deconvolution for the analysis of tissue microarrays. Anal Quant Cytol Histol. 2009 In Press. [PubMed] [Google Scholar]
- 27.Ruifrok AC, Johnston DA. Quantification of histochemical staining by color deconvolution. Anal Quant Cytol Histol. 2001;23:291–299. [PubMed] [Google Scholar]
- 28.Minino AM, Heron MP, Murphy SL, Kochanek KD. Deaths: final data for 2004. Natl Vital Stat Rep. 2007;55:1–119. [PubMed] [Google Scholar]
- 29.Hoos A, Urist MJ, Stojadinovic A, Mastorides S, Dudas ME, Leung DH, Kuo D, Brennan MF, Lewis JJ, Cordon-Cardo C. Validation of tissue microarrays for immunohistochemical profiling of cancer specimens using the example of human fibroblastic tumors. Am J Pathol. 2001;158:1245–1251. doi: 10.1016/S0002-9440(10)64075-8. [DOI] [PMC free article] [PubMed] [Google Scholar]
- 30.Zimpfer A, Schonberg S, Lugli A, Agostinelli C, Pileri SA, Went P, Dirnhofer S. Construction and validation of a bone marrow tissue microarray. J Clin Pathol. 2007;60:57–61. doi: 10.1136/jcp.2005.035758. [DOI] [PMC free article] [PubMed] [Google Scholar]
- 31.Macgregor AM, Eberhart CG, Fraig M, Lu J, Halushka MK. Tissue Inhibitor of Matrix Metalloproteinase-3 Levels in the Extracellular Matrix of Lung, Kidney, and Eye Increase With Age. J Histochem Cytochem. 2008 doi: 10.1369/jhc.2008.952531. In Press. [DOI] [PMC free article] [PubMed] [Google Scholar]
- 32.Pelstring RJ, Allred DC, Esther RJ, Lampkin SR, Banks PM. Differential antigen preservation during tissue autolysis. Hum Pathol. 1991;22:237–241. doi: 10.1016/0046-8177(91)90156-j. [DOI] [PubMed] [Google Scholar]
- 33.De Paepe ME, Mao Q, Huang C, Zhu D, Jackson CL, Hansen K. Postmortem RNA and protein stability in perinatal human lungs. Diagn Mol Pathol. 2002;11:170–176. doi: 10.1097/00019606-200209000-00008. [DOI] [PubMed] [Google Scholar]
- 34.Noutsias M, Seeberg B, Schultheiss HP, Kuhl U. Expression of cell adhesion molecules in dilated cardiomyopathy: evidence for endothelial activation in inflammatory cardiomyopathy. Circulation. 1999;99:2124–2131. doi: 10.1161/01.cir.99.16.2124. [DOI] [PubMed] [Google Scholar]
- 35.Mullink H, Henzen-Logmans SC, Tadema TM, Mol JJ, Meijer CJ. Influence of fixation and decalcification on the immunohistochemical staining of cell-specific markers in paraffin-embedded human bone biopsies. J Histochem Cytochem. 1985;33:1103–1109. doi: 10.1177/33.11.2414361. [DOI] [PubMed] [Google Scholar]
- 36.Hashimoto G, Inoki I, Fujii Y, Aoki T, Ikeda E, Okada Y. Matrix metalloproteinases cleave connective tissue growth factor and reactivate angiogenic activity of vascular endothelial growth factor 165. J Biol Chem. 2002;277:36288–36295. doi: 10.1074/jbc.M201674200. [DOI] [PubMed] [Google Scholar]