Abstract
We report here the development of a method for holding the focal plane in a fluorescence based biochip scanner. The fast readout of large (multiple cm2) glass slides as used in modern chip technology imposes severe constraints on the focal system. The limited focal depth of high-NA objectives together with the demand for single molecule sensitivity challenges traditional focus hold systems (FHS). Various long and short term effects disturb the often multiple hour long data acquisitioning process and cause blurred or unusable image data.
Traditional FHS's were often limited in terms of range, reaction time, sensitivity or demanded a large number of additional components. Our system utilizes the back reflected illumination beam always present in total internal reflection fluorescence (TIRF) microscopy to generate an error proportional electrical signal, which in turn drives an actuator correcting the objective – sample distance. The latter consists of a fast but range-limited piezo drive attached to the objective and a slower motor coupled to the microscope's z-drive. With this combination fast reaction times and virtually unlimited correction distances are possible.
We show the applicability by scanning DNA microarrays on 27×18 mm2 glass slides with single molecule sensitivity over the whole array. Single fluorescence dyes are imaged as diffraction limited spots.
Keywords: Focus hold system, single molecule microscopy, microarray, fluorescence
1. Introduction
Previously, we have introduced extensions of high-resolution fluorescence microscopy to large-area-scanning (Hesch et al., 2008; Hesse et al., 2006; Hesse et al., 2004; Schlapak et al., 2007). Such implementations require the readout system to keep a pre-set focal plane stable. The system demands are defined by the large size of e.g. whole genome microarrays, which extend over centimeters in space and may require scanning times of hours, and the maximally allowed defocusing of as few as hundred nanometers (Hecht, 1987). A number of factors leading to image defocusing may be present in a microchip-reader even if carefully selected high-quality components are used.
These include gravitational force of glass weight, mass of buffer solution covering the slide (and its evaporation during the measurement), adhesive forces caused by the immersion oil, uneven glass surface, ripples of the slide caused by mounting-tensions in the object carrier, thermal expansions/shrinks of the involved supporting structures, etc. A method to readjust the focal plane during the scanning process is described in (Hellen and Axelrod, 1990). The authors utilized an additional laser beam which is used to measure the objective-sample distance with the help of the beam-reflection at the glass-sample interface. If necessary the focus is corrected with the help of a motor attached to the microscope's z-drive. Disadvantages of this method include the need for additional optical components (relative high-powered laser source, dichroic mirrors, prism), a large backlash and the heavy masses which have to be moved. Accuracy of ±0.5 μm and a maximum range of ±10 μm were specified.
We introduced recently a focus-hold system which uses an additional laser beam in total internal reflection (TIR) configuration (Hesse et al., 2004). This allows the use of a weaker laser to gain comparable sensitivity. The motor/focus-knob/gear-assembly described in Hellen et al. (Hellen and Axelrod, 1990) was substituted for a piezo-actuator carrying the objective. With fewer masses to move and virtually no backlash this system is quite fast and accurate in its reaction to the provided error signal; but the range is limited (typically some tens of μm). This focus hold implementation is synergistic in view of the additional advantages of TIRF-microscopy to study samples located directly at the glass carrier surface.
During rapid scanning required for practical analysis of large microarrays, however, the effects leading to sample defocusing may occur with various time constants (ranging from fractions of a second to hours) and various amplitudes (from sub-μm to mm). This applies in particular when using high NA objectives in conjunction with thin coverslips for high-resolution and ultra-sensitive readout (Hesse et al., 2006). Therefore the applied FHS has to react fast and precise to errors. These two requirements are conflicting when designing a controller loop: a small residual error requires a high-gain loop on the controller which in turn lowers the cutoff frequency, causing slower reaction and increasing the tendency to oscillate. Indeed, up to 80% of the scan stripes (each representing a 0.2 mm wide region) have been impaired or even unusable due to defocusing. We describe here the implementation of a two-stage focus-hold system, which was optimized for rapid scanning of large coverslip surfaces at single molecule sensitivity. The performance of the system is demonstrated by scanning DNA microarrays on 27×18 mm2 glass coverslips at single molecule sensitivity; diffraction-limited signals are observable over the whole array.
2. Materials and Methods
The focus hold system was implemented on a single molecule biochip reader described in detail previously (Hesch et al., 2008; Hesse et al., 2006; Hesse et al., 2004). In brief, the reader was setup on an epifluorescence microscope (Axiovert 200M, Zeiss, Oberkochen, Germany). Complex cDNA was synthesized from 200 ng of total RNA from the equivalent of 104 cells of a human keratynocyte cell line (HaCat) and labeled with Alexa Fluor 647 (Molecular Probes, Invitrogen, Karlsruhe, Germany). The array consisted of 8000 spots of replicated printed 139 capture oligonucleotides (designed using OligoWiz 1.0, http://www.cbs.dtu.dk/services/OligoWiz-1.0/) on a 150 μm thick glass slide (Stoelzle, Koeflach, Austria). For excitation of the fluorophores we used the 647 nm line of a Krypton Laser (Innova 301, Coherent, Santa Clara, USA). Samples were illuminated in TIR configuration using a 100×/NA=1.45 objective (α Plan-Fluar, Zeiss). After appropriate filtering (Z514/647M, Chroma, Rockingham, USA), signals were detected on a back-illuminated CCD camera (NTE/CCD-1340/100-EMB, 20 μm pixel size, Roper Scientific, Trenton, USA) operated in Time-Delay-Integration (TDI) mode. The position of the back reflected excitation beam was detected on a two segment photodiode (S5980, Hamamatsu, Japan). Further signal processing was performed by a custom made proportional-integral-derivative (PID) controller (full schematics are available in the supplementary information on the journal's home page) which supplied the analogous correction signal to the z-piezo stage (E-509, E-505, O-527.1, Physik Instrumente, Karlsruhe, Germany).
3. Results
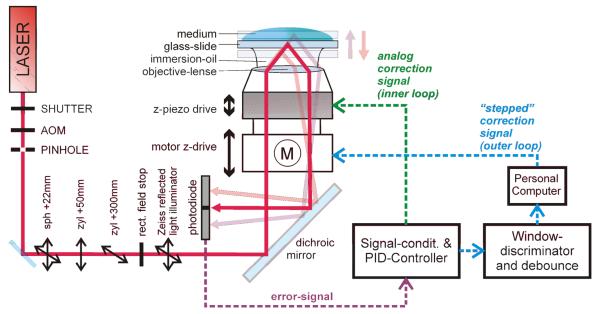
Fig. 1 shows a sketch of the two-stage focus hold system. Stage 1 (inner or analogous loop; indicated with the green arrow) uses the same approach as described in Hesse et al., 2004. The excitation laser-beam is coupled off-axis into the back focal plane of a high NA objective suitable for TIR excitation. The totally reflected beam is collected through the same objective and directed onto the two segment photodiode. A shift of the reflection point in z-direction (i.e. defocusing) causes a lateral beam shift in the objective's image plane, which in turn translates to an angle shift in the back focal plane. The tilted beam subsequently causes an unbalanced light distribution on the two segments of the photodiode which provide the electrical error signal.
Fig. 1.
Optical (left) and electrical (right) part of the two-stage focus hold system. Defocusing causes a shift in the laser's reflection point and in turn an unbalanced light distribution on the two-segments of the photodiode. The inner and outer control loops maintain the correct focal position based on the error signal of the optical part.
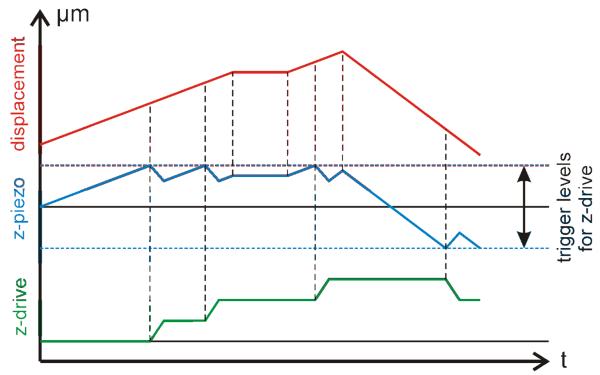
The error signal is further processed to move the objective. After amplification the signal is fed into the PID controller with a selectable low pass filter (fCRITICAL = 3.7, 7.2 Hz or off) at its output. This filter can be used to damp oscillations which might arise in the analogous control loop (inner loop in Fig. 1). The filtered signal supplies the analog correction signal for both the piezo stage and the window discriminator. The latter continuously monitors the error level; an out-of-range condition is signaled to the personal computer which controls the setup (see supplementary information on the journal's home page for a flowchart of the used LabView program). When the error-level exceeds a pre-selected threshold (about 40 % of the total piezo range in either direction), a software counter in the PC is started. After a debouncing time of 1000 ms the microscope's z-drive starts a movement in steps of 1 μm, thereby readjusting the piezo's working point (stepped correction signal in the outer loop; indicated with blue arrows in Fig. 1). The z-drive movement has to be counterbalanced by an adequate shift of the piezo to maintain focus (Fig. 2). Speed and speed-profile of the z-drive movement have to account for the speed limits of the piezo subsystem; here we used a trapezoid velocity profile with vmax=4.7 μm/ms and an acceleration a=0.018 μm/ms2.
Fig. 2.
Sketch of the response of the analogous z-piezo (blue) and the stepwise drive (green) to a displacement of the sample in reference to the initial position (red).
In order to prevent sample damage in case of a faulty error signal, the position of the objective is continuously monitored by the software. Whenever a preset threshold is reached, the z-drive movement is stalled.
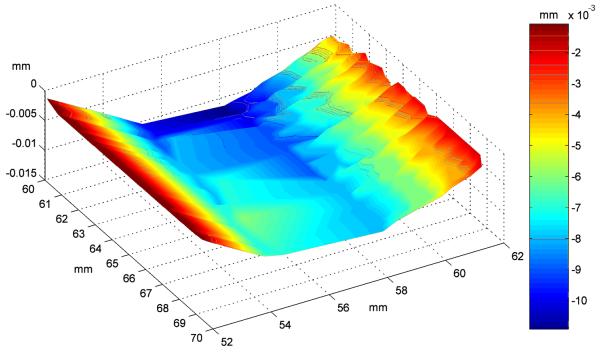
We first demonstrated the operation of the FHS by monitoring the error signal during the scanning process on our 150 μm thick glass coverslips (this glass type and thickness was chosen due to the preferential background signal and surface properties for aldehyde functionalization; c.f. Hesse et al., 2006). Fig. 3 shows a 10×10 mm2 area of the z-profile. A total deformation of 13 μm can be observed, which is mainly caused by adhesive forces from the immersion oil. Although z-corrections of a few tens of micrometers would lie in the working range of the inner-loop piezo system alone, the required high loop gain settings made previous systems highly susceptible to oscillations, yielding images blurred over areas up to mm2. Introducing the additional coarse objective adjustment as second stage we expected a more stable working of the FHS.
Fig. 3.
Typical deflection of a glass cover-slip. The image shows the central 10×10 mm2 surface area of a 150 μm thick glass slide. The z-deformation is derived from the stepped correction signal of the focus hold system. The slide is supported in the microscope's frame on the left and right edge.
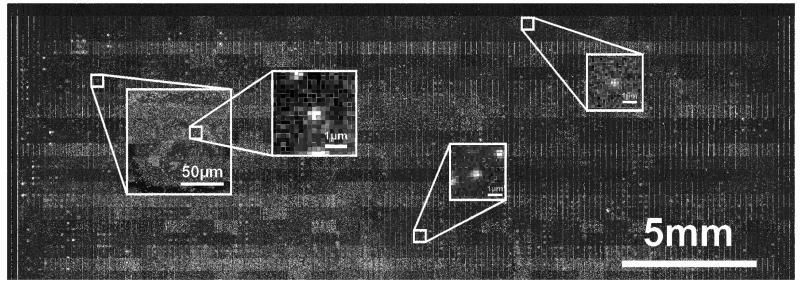
As an application, Fig. 4 shows the scan of a cDNA microarray with a size of 29.2 × 10.3 mm2 (146,000 × 51,300 pixel, 200 nm pixel size) containing 8000 spots with a diameter of 80 μm. The oligonucleotide array was hybridized with fluorescent HaKatcDNA, yielding spots of varying surface concentrations. We chose the concentrations low enough so that individual molecules can be identified as well separated diffraction-limited peaks in the image (Hesse et al., 2006). On randomly selected details of the microarray we show single molecule intensity profiles which were fitted with Gaussian functions characteristic for diffraction limited imaging. The full width at half maximum (FWHM) of the three peaks is given by (462/408), (494/403), and (522/432) nm in scanning and perpendicular to scanning direction, respectively. The slight broadening in scanning direction is caused by the discreet charge transfer on the CCD chip in contrast to the quasi continuous mechanical shifting process of the specimen over the chip. The obtained values for the FWHM compare well with the diffraction-limit of 450 nm determined on the same setup for single Cy5 molecules (Hesse et al., 2004).
Fig. 4.
Fluorescence scan of a 29×10 mm2 cDNA microarray. The leftmost square shows an 80 μm spot; the remaining inserts are zooms on randomly selected single dyes (pixel size = 200 nm).
The versatility of the new focus hold system in different measurement areas is currently being demonstrated for live cell micropatterning (Schwarzenbacher et al., 2008), ultra-sensitive readout of DNA microarrays or imaging of cell populations [publications in preparation]. While our previous one stage system was limited to the analysis of individual chip subregions, the new two-stage system enables unsupervised recording of the whole chip.
4. Acknowledgments
This work was supported by the Austrian Science Fund (FWF L422-N20 and Y250-B10) and the GEN-AU project of the Austrian Federal Ministry for Science and Research.
5. References
- Hecht E. Optics. Addison-Wesley; 1987. [Google Scholar]
- Hellen EH, Axelrod D. An automatic focus/hold system for optical microscopes. Rev. Sci. Instrum. 1990;61:3722–3725. [Google Scholar]
- Hesch C, Hesse J, Schütz GJ. Implementation of alternating excitation schemes in a biochip-reader for quasi-simultaneous multi-color single-molecule detection. Biosens Bioelectron. 2008;23:1891–1895. doi: 10.1016/j.bios.2008.02.019. [DOI] [PubMed] [Google Scholar]
- Hesse J, Jacak J, Kasper M, Regl G, Eichberger T, Winklmayr M, Aberger F, Sonnleitner M, Schlapak R, Howorka S, Muresan L, Frischauf AM, Schutz GJ. RNA expression profiling at the single molecule level. Genome Res. 2006;16:1041–1045. doi: 10.1101/gr.4999906. [DOI] [PMC free article] [PubMed] [Google Scholar]
- Hesse J, Sonnleitner M, Sonnleitner A, Freudenthaler G, Jacak J, Hoglinger O, Schindler H, Schutz GJ. Single-molecule reader for high-throughput bioanalysis. Anal Chem. 2004;76:5960–5964. doi: 10.1021/ac049300f. [DOI] [PubMed] [Google Scholar]
- Schlapak R, Kinns H, Wechselberger C, Hesse J, Howorka S. Sizing trinucleotide repeat sequences by single-molecule analysis of fluorescence brightness. Chemphyschem. 2007;8:1618–1621. doi: 10.1002/cphc.200700163. [DOI] [PubMed] [Google Scholar]
- Schwarzenbacher M, Kaltenbrunner M, Brameshuber M, Hesch C, Paster W, Weghuber J, Heise B, Sonnleitner A, Stockinger H, Schutz GJ. Micropatterning for quantitative analysis of protein-protein interactions in living cells. Nat Methods. 2008;5:1053–1060. doi: 10.1038/nmeth.1268. [DOI] [PubMed] [Google Scholar]


