

Abstract
Ligand–protein interactions are essential for biological processes, and precise characterization of protein binding sites is crucial to understand protein functions. MED-SuMo is a powerful technology to localize similar local regions on protein surfaces. Its heuristic is based on a 3D representation of macromolecules using specific surface chemical features associating chemical characteristics with geometrical properties. MED-SMA is an automated and fast method to classify binding sites. It is based on MED-SuMo technology, which builds a similarity graph, and it uses the Markov Clustering algorithm. Purine binding sites are well studied as drug targets. Here, purine binding sites of the Protein DataBank (PDB) are classified. Proteins potentially inhibited or activated through the same mechanism are gathered. Results are analyzed according to PROSITE annotations and to carefully refined functional annotations extracted from the PDB. As expected, binding sites associated with related mechanisms are gathered, for example, the Small GTPases. Nevertheless, protein kinases from different Kinome families are also found together, for example, Aurora-A and CDK2 proteins which are inhibited by the same drugs. Representative examples of different clusters are presented. The effectiveness of the MED-SMA approach is demonstrated as it gathers binding sites of proteins with similar structure-activity relationships. Moreover, an efficient new protocol associates structures absent of cocrystallized ligands to the purine clusters enabling those structures to be associated with a specific binding mechanism. Applications of this classification by binding mode similarity include target-based drug design and prediction of cross-reactivity and therefore potential toxic side effects.
Keywords: protein structures, ligand–protein interactions, binding sites, binding site classification, CDK2 and Aurora-A similarity, protein kinases
Introduction
The use of the protein sequence is the simplest approach to infer by analogy a protein function, for example, PSI-BLAST.1 In this research area, PROSITE is a recognized method, distinguishing protein family members from unrelated proteins.2,3 PROSITE patterns represent conserved motifs such as binding site regions. The PROSITE database scans sequences from the annotated UniProtKB/Swiss-Prot database4,5 and detects functional domains. Numerous other approaches exist, such as Pfam which uses a refined database of well-characterized protein domain families.6,7 The development of so many methods has led to the creation of meta-servers that measure consensus across multiple approaches, for example, JAFA.8
Functional protein properties can also be characterized in terms of three-dimensional (3D) structural information. This provides valuable information for determining and understanding precise mechanisms of proteins implicated in diseases.9–11 The combination of knowledge from 3D protein structures with hundreds of thousands of small-molecules can be used for structure and ligand-based drug design.12–17 For example, Crespo and Fernandez used the protein structure of a imatinib-resistant mutant18 to improve the anticancer drug by promoting stronger intermolecular nonbonded interactions than those bound by the original drug. In the same way, the resolution of the HIV-1 reverse transcriptase complex structure explained the potential application of anti-HIV drugs against resistance mutations. It also provided opportunities for understanding, with greater accuracy, inhibitor–protein interactions and to determine reliably the structural effects of resistance mutations.19
The Protein Data Bank (PDB20,21) gathers today more than 59,000 protein structures. About 3000 protein structures are not associated with a function. Proteins can be classified according to their folds,22–24 for example, SCOP (Structural Classification of Proteins).25,26 From simple structural classification of protein, these methods have become useful tools to infer protein structures functions and to detect functional relationships, for example, SCOP is now coupled with BLAST, whereas PSI-BLAST and RPS-BLAST are associated with Pfam domain search,1,6,27 even PROSITE motifs are now analyzed in 3D structures.28
However, a limitation of these classifications is their use of complete protein folds or protein domains. Similarity of fold does not imply a direct similarity of function. For example, the TIM Barrel fold is an alternation of eight α-helices and eight parallel β-strands along with the peptide backbone. It is ancient29 and shared by many different enzymes associated with at least 15 different functions.30 In SCOP, all such proteins are associated with the same cluster.
It is now established that looking specifically at the protein interactions can clarify biological functions, that is, ligand–protein and protein–protein interactions. Ligand–protein interactions are at the basis of many fundamental biological processes. It is also known that the activity of a protein is mediated by a small, highly conserved set of residues within the binding site.31,32 Consequently, being able to detect and compare binding sites is valuable for the assignment of predicted structural functional annotations.
During recent years, various methods to compare binding sites have been elaborated, based on diverse types of descriptor. The general aim is to create automated functional annotation methods independent from amino acid sequence or fold similarity.
Existing methods share common features. CavBase is based on the use of pseudo-centers, that is, 3D patterns corresponding to chemical properties of amino acids at the surface of proteins.33 It detects related cavities using a clique detection algorithm. Site similarity ranking occurs according to property-based surface patches shared by the clique solutions. CavBase was used to predict unexpected drug cross-reactivity among functionally unrelated target proteins.34–36 CavBase is restricted to cavity comparisons.
Like CavBase, SiteEngine37,38 also uses pseudo-centers. In SiteEngine, they are gathered into triangles which constitute vertices of graphs. The web version of the approach only enables the comparison of a single site versus another protein structure.39
Other methods exist, including FLAP,40 CPASS,41 and eF-seek.42,43 Some enable the automatic creation of 3D motifs associated with binding sites for given type of ligands44 or detect structural similarity to assign E.C. number,43 whereas others, use the detection of conserved residues to characterize binding sites. In this field, the evolutionary trace method is the most widespread.45–47 For example, it was used to identify residue positions important in diverse GPCRs,48 and this method bypasses the need for experimental knowledge of the catalytic mechanism.49 Thornton's group maintain the catalytic site atlas (CSA), containing assigned catalytic residues, and gives an additional homologous set, with annotations inferred by PSI-BLAST and sequence alignment to the original set.31 George et al. used the CSA to identify and segregate related proteins into those with a functional similarity and those where function differs.50 ProFunc is a metaserver using both sequence and structure prediction, although it does not provide any simple consensus output to use its results.51–54 Roterman's approach is innovative. It detects regions of significantly irregular hydrophobicity distribution in proteins which appear to be associated with specific functions.55–59 They propose a method to detect binding sites based on the hydrophobic distribution analysis in protein structures.59
All methods cited above can be used to annotate protein structures. CPASS41 and SiteEngine37 were presented with examples of functional annotation for hypothetical protein structures, while CavBase33 and Gilbert and co-workers44 illustrate their methods by classifying a protein structure dataset. Indeed, these types of classification are particularly relevant as they are not based on global fold alone. They provide structural functional classifications that can highlight links between proteins and that could be a good start for assigning predicted protein functions to hypothetical proteins.
In this research area, SuMo is a powerful technology to match similar local regions on protein surfaces.60 Each chemical interactions of a amino acid residue is represented by a pseudo-center, named a surface chemical feature (SCF) (see Fig. 1). These are gathered into triangles, the SuMo graph vertices. SCFs have heterogeneous geometrical properties, and these triangles have specific formation and superimposition rules (distance, angle), so the comparison heuristic is very fast. The comparison of a 3D motif against all binding sites of the PDB can be performed in a few minutes. The first demonstration of SuMo was the assignment of functional and nonfunctional lectins with a selectivity of 96%.61 MED-SuMo is the latest evolution of the SuMo software developed by MEDIT.62–64 Recent developments have improved the binding sites database, and functional annotation functionalities are now integrated. Hydrophobic chemical features were added to the SCF dictionary and a cavity-detection algorithm included, improving MED-SuMo's effectiveness for detecting unknown binding sites.
Figure 1.

MED-SuMo comparison procedure. (1) graph construction: (a) surface chemical features (SCFs) are displayed on the protein structure through a lexicographic analysis of the PDB files. (b) Their positions and orientations are checked to discard SCF potentially involved in internal interactions or associated with buried atoms. (c) SCFs are gathered in triplets. (d) The triplet network is then stored as a graph data structure with the triplets as vertices and with edge connecting adjacent triplets. (2) Graph comparison: (e) The query graph (in green color) is compared to the database graphs (in pink color), compatible triplets are detected, that is, they are formed by compatible SCFs. (f) Corresponding graphs are hits found by MED-SuMo. See Refs.60 and63 for more details. [Color figure can be viewed in the online issue, which is available at http://www.interscience.wiley.com.]
Here, we use MED-SuMo to detect and characterize local similarities for the purpose of classify binding sites. This extension is known as the MED-SuMo Multi Approach (MED-SMA). A complete dataset of purine binding protein structures was collected and classified using MED-SMA. Different clusters were generated. Their characteristics and their distributions across different annotations, for example, PROSITE, ligand distribution, functional annotations, were analyzed. MED-SuMo is able to group protein binding sites with the same or with related functions, that is, sites which binds similarly related ligands. However, with purine binding sites, what is interesting is how drugs can be developed to activate or inhibit the protein function on which they are located.
In this study, we present the classification of all purine binding sites of the PDB and demonstrate a method to enrich the clusters with purine binding protein structures not cocrystallized with any ligands. Protein kinase distribution in the clusters is analyzed in the “Discussion Section.”
Results
Distinct functions can be underlined by the fact that two proteins interact differently with the same class of molecules. MED-SuMo can differentiate these proteins' binding sites. For example, no structural or functional similarities are detected between an actin protein bound to ATP (PDB code: 1S22) and a myosin protein bound to ATP (PDB code: 1FMW).60,61,63,64 The classification tool MED-SMA was implemented to use this ability to classify datasets of binding sites.63 It operates through three main steps: (i) comparison of all the binding sites of a dataset using a pairwise comparison system, (ii) detection of matching regions in the binding sites to build a similarity graph, and (iii) classification of this graph with the Markov clustering algorithm (MCL).65 This clustering algorithm detects densely populated regions of the similarity graph associated with highly scored matching regions and gathers the similar subsites into clusters. Figure 2 illustrates the overall procedure and specific details of the heuristic are provided in the “Material and Methods Section.”
Figure 2.

MED-SuMo Classification Procedure. 1.Global steps of binding site classification heuristic. MED-SuMo_Multi approach (MED-SMA) can be divided in three major steps: pairwise comparison (purple box), similarity matrix construction (pink box) and the Markov cluster algorithm classification (Yellow box). 2. Six steps of the MED-SMA. (a) Dataset construction, here, five binding sites are shown. The black dots represent SCFs. (b) Common SCFs detected by the pairwise comparisons. They are linked by a colored line; each color stands for matching subsites. (c) Matching SCFs between pairs of binding sites are grouped in patch. A patch is a colored circle on the binding sites; some of them are overlapping. At this step, the network forms a graph structure where complex component are searched.(d) Parsing all patches from every component found, if overlapping patches have a certain amount of common SCFs (superior to a threshold value: parameter covering_factor), they are merged in multipatches (black bold circles). (e) MED-Sumo scores between multipatches are calculated to create a similarity matrix. (f) The similarity matrix is used by Markov clustering (MCL) algorithm to classify the dataset. Finally, Biolayout is used to visualize the cluster mainly in 2D. [Color figure can be viewed in the online issue, which is available at http://www.interscience.wiley.com.]
Purine binding sites classification
Purine binding proteins structures were selected from the PDB. Ligands all contain either adenosine or guanosine: AXP (ATP, ADP, AMP, ANP, and NAD) and GXP (GTP, GDP, GMP, and GNP) which only differ by two chemical groups, whereas NAD and AXP differ on the phosphoryl side. The 2229 selected protein structures contain 2322 purine binding sites which were used to create the same number of MED-SuMo graphs. The classification required 4 h on a bi-Xeon QuadCore 5335 machine, 3.5 h for the pairwise comparison step, and 30 min for the MCL classification. Two hundred and forty-seven clusters were created (see Supporting Information 1 and 2). These comprise 2115 binding sites, leaving 207 singletons associated with no binding site of the database. Each singleton is eliminated at the “patch merging” step represented on Figure 2.2(b) of the MED-SMA procedure (see Material and Method Part).
Global analysis
A total of 60% (148) of the clusters have fewer than 5 binding sites, 25% (62) have between 5 and 10 binding sites, and 5% (14) have more than 30 binding sites (see Supporting Information 3a). Thus, small clusters are important in quantity, but there is a notable distribution of larger clusters.
Ligands within the classified binding sites were analyzed. In Table I (The confusion matrix is about each specific kind of the 9 ligands), the number of times a ligand is found at least once in a cluster is shown. Even if purine ligands are very similar, many clusters contain only one type. For instance, 82 clusters contain only ATP, 42 clusters have ATP and ADP, and eight have ATP and NAD. Thus, for the AXP ligands, about 41% to 50% of their clusters contain just one type. These frequencies increase to ∼60% for GTP and GMP clusters. Despite the fact that their structures are very similar, only three clusters contain both ATP and GTP. This highlights the specific binding modes of those ligands. For the clusters containing several ligand types, the nucleotide is often the same (Adenine or Guanine). Table I (All adenine ligands are gathered in AXP, all guanine ligands in GXP, whereas NAD remains NAD) shows the same information as Table I (The confusion matrix is about each specific kind of the 9 ligands) except the ligands are grouped into three classes: AXP, GXP, and NAD. This table highlights the true diversity observed in the classification. A total of 83% of the AXP clusters contain only AXP ligand, 71% of GXP clusters only GXP, and 70% NAD clusters only NAD. The association of NAD and GXP is never observed, whereas 30% of the NAD ligand clusters also contain AXP ligands. Nearly 17% of AXP clusters are found with NAD and GXP ligands.
Table I.
Confusion Matrix of the Ligand Distribution Within the Clusters
| ATP | ADP | AMP | ANP | GTP | GDP | GMP | GNP | NAD | |
|---|---|---|---|---|---|---|---|---|---|
| (a) The confusion matrix is about each specific kind of the 9 ligands | |||||||||
| ATP | 80 | 42 | 21 | 28 | 3 | 3 | 0 | 2 | 8 |
| ADP | 42 | 104 | 14 | 47 | 1 | 6 | 1 | 3 | 8 |
| AMP | 21 | 14 | 56 | 8 | 1 | 1 | 5 | 0 | 6 |
| ANP | 28 | 47 | 8 | 61 | 0 | 2 | 0 | 3 | 0 |
| GTP | 3 | 1 | 1 | 0 | 14 | 4 | 0 | 0 | 0 |
| GDP | 3 | 6 | 1 | 2 | 4 | 21 | 3 | 1 | 0 |
| GMP | 0 | 1 | 5 | 0 | 0 | 3 | 13 | 0 | 0 |
| GNP | 2 | 3 | 0 | 3 | 0 | 1 | 0 | 6 | 0 |
| NAD | 8 | 8 | 6 | 0 | 0 | 0 | 0 | 0 | 53 |
| (b) All adenine ligands are gathered in AXP, all guanine ligands in GXP, whereas NAD remains NAD | |||||||||
| AXP | GXP | NAD | |||||||
| AXP | 303 | 31 | 22 | ||||||
| GXP | 31 | 76 | 0 | ||||||
| NAD | 22 | 0 | 53 | ||||||
PROSITE annotation in clusters
Two hundred and ninty-six different PROSITE patterns are associated with the proteins of the clusters. The pattern association is based on PDB identifiers. Therefore, as the chain corresponding to a pattern may not be the one where the purine binding site is located, manual checks were performed. A total of 30% of the MED-SuMo clusters (74/247) are not associated with any defined pattern, whereas 28% (70/247) are associated with only one pattern, and 3% (10/247) with more than five (see Supporting Information 3c upper part). The last category includes two types: the large sized clusters, for example, the clusters 40 and 157 which respectively contain 402 and 60 binding sites and are functionally very heterogeneous. The second type is clusters where structures are associated with many PROSITE patterns, for example, cluster 105 gathers 70 binding sites from actin structures and is functionally a very homogeneous cluster. Indeed, 93% of the structures are associated with the three accession numbers of pattern PDOC00340 (PS00406, PS00432, and PS01132) while some structures are also associated with other patterns. For example, an actin-DNase complex (PDB code 1ATN)66 is associated with two accession numbers of pattern PDOC00711 (PS00919 and PS00918) due to the DNA complex chain. For most of the PROSITE annotated clusters, a common pattern is shared by a majority of binding sites. Some other patterns may be present but only because other chains are cocrystallized in the PDB structures.
More than 190 PROSITE accession numbers are specific to only one cluster (see Supporting Information 3c, lower part). Sixty one are found in two clusters. Furthermore, seven accession numbers are found together in more than five clusters. The first three are from the protein kinase pattern PDOC00100; PS00107: a protein kinase ATP-binding region signature, PS00108: a serine/threonine protein kinase active-site signature, and PS50011: protein kinase domain profile. In the classification, 61 of the protein kinase are associated with these 3 accession numbers which are in five different clusters. A careful analysis of the protein kinase in the different clusters is provided later in this discussion. A clear observation is that patterns associated with protein kinase are always found together in the clusters.
Functional annotation in clusters
Precisely defining the function(s) of protein structures is a complicated task. Using the MOLECULE field of the PDB files, functional annotations were extracted for all the structures of the dataset. These assigned functions were subjected to extensive manual checks. The dataset collects 442 different functions. In this paragraph, a protein function is associated with a functional annotation extracted from the PDB files. The appraisal of the functional homogeneity in the clusters was made using the Neq index (equivalent number of states, presented in Ref.67 and demonstrated in Ref.68). This index is based on the Shannon entropy,69 and it gives an indication of the number of states (here functions) and their distribution within a cluster. For instance, if two functions each represent 50% of a cluster, the Neq equals two, if one represents 90% and the other 10%, the Neq is worth 1.13. The Neq equals 1 if only one function is observed in a cluster.
One hundred and sixty-three clusters are associated with only one function. About one third contain at least two functions. A total of 12% of the clusters (29) have a Neq value equals or greater than 2 (see Supporting Information 3d). Some clusters gather an important number of different functions (examples are presented below). As expected, the mean of the Neq generally increases with the cluster size (see Supporting Information 3e). However, there is no strong correlation. Small clusters have low Neq, but several big ones also have low Neq (see Supporting Information 4). Eight clusters have a Neq greater than 5, some are analyzed in the following paragraphs.
MED-SuMo cluster 4
The Neq equals 14.92 indicating it is a very heterogeneous cluster. It contains 27 different functions. Mostly, they are epimerases, dehydratases and dehydrogrenases, for example, hydroxysteroid dehydrogrenases, the cluster binds NAD except protein Arna (PDB code 1Z7E70) which binds ATP. Figure 3 shows a 3D superimposition of a dTDP-d-glucose 4,6-dehydratase (PDB code 1KEP71) with four binding sites from Cluster 4. The top-left hand figure, with UDP-glucose-4-epimerase (PDB code 2P5Y), shows a very good and complete superimposition. Pairs of SCFs are all around the ligands, that is, the binding sites have a strong similarity. The top-right hand one represents the superimposition of the nicotinamide binding site of 1KEP with a GDP-mannose-4,6-dehydratase (PDB code 1RPN72). Interestingly, the ligand is globally well superimposed, with only a small shift. However, a more detailed analysis yields the fact that pairs of SCFs are only on the bottom left region of the binding sites. Figure 3 shows that only subsites are similar, whereas the other side (top-right) is different. On the bottom left hand representation, the binding sites superimposition enables the overlap of the ligands NAD (from 1KEP) and ATP from the Arna protein binding site (PDB code 1Z7E) on their common regions (adenosine). The other side of the ligand is quite different as the left hand background of the binding site remains similar. This region of the binding site is highly conserved for all four proteins (1KEP, 2P5Y, 1RPN, and 1Z7E).
Figure 3.

Example of binding site superimposition. dTDP-d-Glucose 4,6-dehydratase (PDB code 1KEP) binding site is superimposed with three different binding sites of its cluster (MED-SuMo Cluster 4). Each has different functions and the superimposition involves different parts of the binding site. (1) Global superimposition between 1KEP and UDP-Glucose-4-epimerase (PDB code 2P5Y). (2) “Left” side of the NAD with GDP-mannose-4,6-dehydratase (PDB code 1RPN), and (3) the nucleotide side of 1KEP binding site with the ATP of Arna protein binding site (PDB code 1Z7E). (4) Superimposition with a “hypothetical protein” (PDB code 2D1Y). [Color figure can be viewed in the online issue, which is available at http://www.interscience.wiley.com.]
As this classification method is able to group binding site with similar sub pockets, we notice that this cluster is due to the left hand background sub pocket which is shared by functionally different proteins. This cluster also contains a protein annotated as “hypothetical protein” (code PDB 2D1Y). A recent study showed how MED-SuMo could help establish potential functions of proteins.64 Here, a function corresponds better with a functional mechanism used by the protein to express its function. Superimposition of this protein's binding site with other binding sites from Cluster 4 clearly illustrates a local similarity. The adjacency with the binding mode of the dTDP-d-glucose 4,6-dehydratase is illustrated in Figure 3(d) (bottom-right hand picture). More than ten pairs of SCFs are detected whereas the best sequence match found by PSI-BLAST1 using the SWISSPROT databank,73 has a sequence similarity score of 35%. This match is a 3-oxoacyl-[acyl-carrier-protein] reductase (SWISSPROT code Q9X248). Analysis of SCOP ids associated with each cluster shows various behaviors. Here, all the proteins belong to SCOP family of tyrosine-dependent oxidoreductases (c.2.1.2). Thus, proteins of this cluster have related folds; however, a weak sequence identity rate (15.4%) is calculated. It underlines clearly that our approach merges related local folds without regards to the sequence similarities, that is, the local 3D similarity of the protein interaction site directs the clustering.
MED-SuMo cluster 33
The Neq value is 8.53. However, the first observation is that the different functions of this cluster are linked to the transport through membrane, for example, cystic fibrosis transmembrane conductance, ABC (transmembrane) transporter. The cocrystallized ligands are homogeneous as only AXP ligands are present, mainly ATP and ADP. The common region is the phosphoryl part. Figure 4(a) shows the ligand superposition. It emphasizes that the binding similarities of the active sites cannot be around the nucleotide part as their positions are very different. The SCFs are mainly located around the phosphate groups. Some are also around the nucleotide part but as there are 25 superimposed SCFs pairs on the phosphoryl part, there are only 9 on the nucleotide part. Figure 4(b) shows the superimposition of 6 ligands from 6 proteins associated with different functions, that is, histidine permease (PDB code 1B0U74), maltose / maltodextrin transport ATP-binding (PDB code 1Q1275), cystic fibrosis transmembrane transductance (PDB code 1R0X76), multidrug resistance-associated protein (PDB code 2CBZ77), α-hemolysin translocation ATP-binding protein HLYB (PDB code 2FF778), and peptide transporter TAP1 (PDB code 1JJ779). Four of them are cocrystallized with ATP and two with ADP. Figure 4(b) gives another example of how similarities detected by MED-SuMo can concern only a part of a binding site. The SCFs circled in white highlight MED-SuMo's flexibility, that is, superimposition rules are loose enough to enable the superimposition in Figure 4b; both SCFs represent the same chemical propriety and they are oriented in a very similar direction; however, the separation distance is large (0.5 ´Å).
Figure 4.

Superimposition of 6 ligands from Cluster 33. Each ligand is taken from proteins with different functions. 4 ligands are ATP (taken from 2CBZ in gray color, 1B0U in orange color, 1R0X in blue, 1Q12 in green), and, 2 ADP (from 2FF7 in red and 1JJ7 in purple). (b) Superimposition of ligands from Cluster 33. (a) With and (b) without the SCFs. The phosphoryl groups are similarly arranged in each binding site, but the nucleotide region has two major conformations. [Color figure can be viewed in the online issue, which is available at http://www.interscience.wiley.com.]
The fact that many functions are in this cluster underlines that the binding of a phosphate ligand is not specific to one type of function. It is very common for the mechanism of transport through membrane proteins to require the energy of the phosphate transfer. Here, we can say that despite the fact that there are many functions in that cluster, all proteins structures use a similar binding mode, characterized by MED-cluster 33. As for the previous presented cluster, here also, these proteins belong to the same SCOP family, ABC transporter ATPase domain-like (c.37.1.12). As previously observed, they also share a low sequence identity rate (26.2%). Figure 4 shows the methodology can highlight that the common binding part of this family is on the phosphate side of binding site, and is directly linked to function.
Other examples
MED-SuMo Cluster 40 has the highest Neq, 53.36. It is also the biggest cluster of the classification with 402 binding sites from 386 proteins. It includes 279 Small GTPase (72% of the cluster), in fact, all the Small GTPases of the dataset, 40 “Elongation Factor 2” (10%): all the Elongation Factor 2 of the dataset. The high Neq comes from the 18% remaining; these proteins encompass a large number of functions which share the same mechanism and interact with GXP ligands. This cluster is associated with a huge SCOP superfamily (c.37.1) corresponding to different families, mainly c.37.1.8 (80%), but also c.37.1.10, c.37.1.1, c.37.1.20 and c.37.1.4. Some proteins have no SCOP ids, but based on CATH classification, they can be considered as members of this superfamily. The important region of this binding site is, as for MED-SuMo cluster 33, the phosphate side. Hence, our analysis underlines this similar behavior for proteins from the same SCOP family. But, it also highlights that sites from MED-SuMo Clusters 33 and 40 are clearly distinct, the first one corresponding to one superfamily and the second to four distinct superfamilies.
A few highly populated clusters also have low Neq value. For instance, Cluster 159 has a Neq value of 1.74, and it contains 28 binding sites all from HSP70 proteins. In reality, its Neq should be 1; but HSP70s are sometimes annotated differently. This verifies the fact that MED-SuMo is able to gather proteins with the same function. Cluster 105 has a Neq equals to 1.07, whereas it contains 70 binding sites. This cluster includes all actins of the dataset. These proteins all bind AXP and have very specific binding modes.
In summary, MED-SMA generates different types of cluster, some functionally very diverse while others functionally very homogeneous. Proteins with different functions that are in the same clusters; for example the small GTPase in Cluster 40 can share related inhibition processes. Another example concerns the actin family, all actin proteins are in the same cluster; molecules with specific binding modes are needed to inhibit or activate them.
Links between clusters
Two clusters are linked if they both contain a site inherited from the same binding sites. A part of a binding site can be related to a protein family and another part to another protein family. Under a certain fraction, (here, parameter covering_factor: 60%) overlapping SCFs are considered as part of 2 separate subsites. They reflect binding site flexibility.
Figure 5 shows an interesting network of clusters where Cluster 40, the biggest cluster of the classification, is in the centre (see Supporting Information 2). This network implies 11 clusters and it can be divided into two parts:
Figure 5.
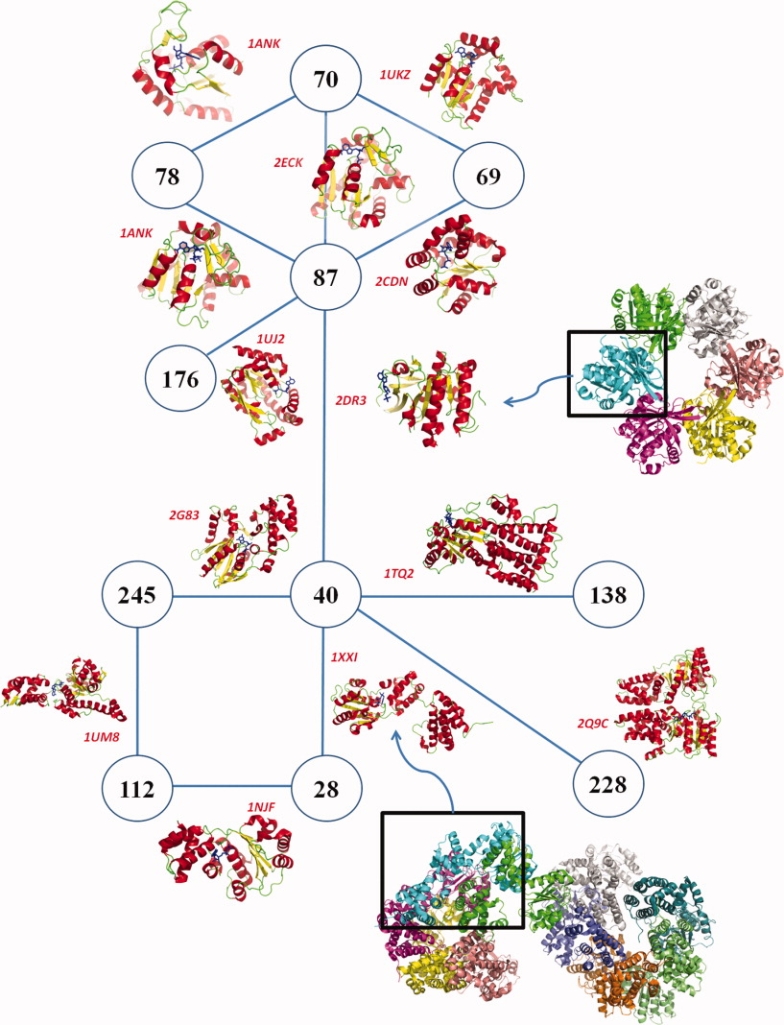
Representation of a network within the classification. Each circled numbers are cluster IDs. If two are connected, it means that they share a binding site. The protein structures represented on the lines are the ones containing the shared binding site. For example, 1XXI's ADP binding site is within Cluster 40 and 28. Here, 13 links are represented involving 11 clusters. Those links underline how MED-SMA highlights subpocket similarities (see Fig. 6). [Color figure can be viewed in the online issue, which is available at http://www.interscience.wiley.com.]
The upper part involves five clusters, each related to the biggest, Cluster 87 which is connected to Cluster 40: Cluster 70 (Neq = 1.6, size = 5), Cluster 69 (Neq = 1.0, size = 2) and Cluster 78 (Neq = 1.0, size = 2) are adenylate kinase clusters. Adenylate kinases are phosphotransferase enzymes that catalyze the interconversion of adenine nucleotides. They play an important role in cellular energy homeostasis.80 Cluster 87 (Neq = 6.5, size = 56) also contains adenylate kinase, but also more diverse functions. Different nucleotide kinases are present, for example, thymidylate kinase or uridylate kinase. Nevertheless, all those structures are from enzymes that catalyze the phosphate transfer from ATPs to the 5′ end of nucleotides. Cluster 176 (Neq = 2.3, size = 16) contains other nucleotide kinases, for example, deoxycytidine kinase (68%). Interestingly, these are not natural nucleotides. For example, the human deoxycytidine kinase is responsible for the phosphorylation of a number of clinically important nucleoside analog prodrugs.81
The lower part of the network incorporates 6 clusters, all connected to Cluster 40 except Cluster 113. Cluster 138 (Neq = 1.0, size = 2) is a GTPase cluster. Cluster 228 (Neq = 1.0, size = 1) is a conserved active site with residues in the GTPase domains common to both signal recognition particle and conjugate receptor.82 Cluster 28 (Neq = 1.9, size = 3) is small cluster of DNA polymerase III. The DNA polymerase III holoenzyme is the first enzyme complex involved in prokaryotic DNA replication.83 Cluster 112 (Neq = 1.0, size = 15) gathers heat shock locus (HSL) proteins (87%), a DNA polymerase III, and CLP protease proteins. HSL and CLP have chaperone activities, being implicated in the formation of protein complexes. Cluster 245 (Neq = 5.9, size = 33) is a heterogeneous cluster that gathers mostly F1 Atpase, with RecA proteins and even a myosin protein. More interestingly, a hypothetical protein from Aquifex aeolicus (O67745_AQUAE) is associated with this cluster.84
The thirteen links are represented Figure 5. Cluster 40 is connected to 5 clusters, (e.g., cluster 87), Cluster 70 to 3 clusters, 5 other clusters have two links and the 3 remaining, only one. All links can be illustrated with superimposition using the MED-SuMo 3D viewer. Figure 6 illustrates 2 links between 3 clusters: Cluster 245, 40, and 28. Hence, we selected 3 protein structures (PDB codes 1UM8,851SXJ,86 and 1XXI87). A very low sequence identity is found between the different sequences (4.4%). Thus, as expected, the global structures are quite different (see Fig. 6, left). However, Figure 6 (right) shows that local similarity is important. The ligands, one ATP and two ADP, are closely superimposed. The bottom parts of the 3 binding sites are very similar which is highlighted by several SCFs. However, the reason why these proteins are not in the same cluster is that the similarities are only local; only SCFs on the bottom of the binding sites are well superimposed. This underlines a subpocket similarity which could lead to the fact that this part of the binding site could interact with the same binding modes.
Figure 6.

Illustration of two interclusters links. On the left is represented a 3D superimposition of three structures from Clusters 40, 112, and 245; PDB codes 1UM8 (blue), 1SXJ (red), and 1XXI (green). These proteins have a very low sequence identity, and they have very different fold. On the right, a closer view is represented, delimited by the yellow box on the left. Ligands, 1 ATP and 2 ADP are very well superimposed and the local similarities of the binding sites are highlighted by several SCFs and are very distinct. These proteins are not in the same cluster as their similarities are very local, only SCFs on the bottom of the binding sites are well superimposed. This is a typical example of subpocket similarity. [Color figure can be viewed in the online issue, which is available at http://www.interscience.wiley.com.]
Classification enrichment
Nonetheless, a crucial question is if the protein structure has no purine ligand bound, can MED-SuMo still identify the purine ligand binding property of the protein? Using the ExPASy website for PROSITE, proteins with a purine binding patterns were selected. As PROSITE highlights interesting regions of the protein sequences, binding sites are not always structurally defined with a ligand. The nine purine ligands were used as queries to get a protein structure list. 3515 structures were collected, of which only 880 were common to the classified PDB dataset. A total of 1492 are cocrystallized with nonpurine ligands, whereas 1143 are not cocrystallized with any. In these three subsets, we chose to associate the 1143 apo-structures to one of the 247 clusters. For this purpose, a particular MED-SuMo mode was used, it enables the comparison of whole protein surfaces to every purine binding site already classified (2115). Two filters were applied to ensure the quality of results from this strategy: (1) a high MED-SuMo score (value 5.5) and (2) a value of covering_factor equivalent to the one used in the MED-SMA merging step [see Fig. 2.2(c)] of 0.6. This value ensures at least 60 % of the SCFs are in common with the corresponding binding site of the cluster.
When applying the first filter only, clusters would be enriched by 1038 potential new binding sites associated with 567 of the 1143 structures without ligands (∼50%). With the second filter, clusters are enriched by 203 potential binding sites issued from 196 protein structures. Here, 7 structures are associated with more than one cluster. A single protein structure can have several purine-binding sites, and a protein structure can be associated with two linked clusters. For instance, the human tyrosine kinase c-Src (PDB code 1FMK88), not cocrystallized with any ligands, can be associated with two protein kinase clusters, Clusters 157 and 211.
Fifty six clusters are expanded in this protocol. Cluster 40, the biggest, gains 19 binding sites from 19 structures (from SCOP c.37.1.8 and c.37.1.10 families as the rest of the cluster). Protein kinase Clusters 157 and 211 are, respectively, enriched by 26 and 9 of those apo-structures. It can be noted that at least 371 other structures have high similarities with purine binding sites but were discarded by these very stringent parameters. A closer study could determine whether they should be included in the clusters or not, some being clearly positive hints.
Discussion
Methods to compare binding sites
The detection of functional sites on protein surface is important for the identification of biological activity. Most protein structures are implicated in, at least, one ligand–protein interaction, and they are implicated in the majority of critical biological processes. However, without known related sequences or structures their detection is difficult.89 Innovative novel approaches have been proposed, that is, the use of hydrophobicity distribution on protein structures using the fuzzy oil drop model,59 the destabilization of limited protein regions,90 phylogenomic classification of protein sequences,91 or the classification of known protein catalytic sites.92 Prediction of protein functional sites is an important step in identifying small-molecule interactions for drug discovery93 and to optimize the drugs targeting these sites.94 Another valuable application is as a preprocessing step to reduce search space for rigorous computational docking algorithms.
Methods to compare binding sites have been developed using various kinds of structural descriptors, for example, CavBase uses pseudo-centers, and the strong hypothesis that chemical similarity and activity are linked.95 In this field, MED-SuMo is an efficient approach based on SCFs. Each SCF represents a pertinent chemical property and is described with appropriate geometric rules. The search of equivalent binding sites is performed by detecting similar graphs where the vertices represent triangles of SCFs. The specific geometric rules of each SCF enable the heuristic to be fast. So, MED-SuMo offers an interesting and original approach to detect structural and functional similarities between protein binding sites.
Here, it is applied in a clustering approach where ligand environments are classified. An application to a particular protein family, the purinome, is presented. AXP, NAD, and GXP are simple ligands composed with related nucleotides and phosphoryl groups. Nevertheless, they are quite flexible and can adopt very different conformations within a binding site.96
Direct comparison with other classification methods is difficult. Nebel et al. report a method to automatically generate 3D motifs from protein structure binding sites based on consensus atom positions and evaluate these with a set of adenine based ligands.44 Their methodology was validated by generating automatically 18 different 3D patterns for the main adenine based ligands. Our study encompasses a larger set of proteins. The different classes presented in this study are found again by MED-SMA. Nonetheless, the classification has some differences. Hence, concerning the ADP4 pattern example (see Fig. 3 of Ref.44 and associated text), three proteins of ADP4 out of five (PDB code 1EHI, 1E4E, 1GSA, 1KJQ, and 1IAH) are associated with the same MED-SuMo cluster number 5 (PDB code 1EHI, 1E4E, 1KJQ). For two proteins (1GSA and 1IAH), they are associated with other clusters. In these cases, the common pattern is on the adenine binding region. The remainders of both datasets are quite different. Each cluster was systematically analyzed in terms of PROSITE and SCOP ids distribution and of sequence identities.
Classification of purine binding sites
The classification of all the cocrystallized binding sites of our dataset generates 247 distinct clusters. The clustering is quite robust as an average number of 48 SCFs are found in each subsites. They are mainly H-bond interactions SCF. An average of more than 80% of the binding sites' SCFs, are found in the sub-sites. Interestingly, numerous clusters consist of binding sites linked to various kinds of ligands. However, even if AXP and GXP only differ by two chemical groups and NAD and AXP have a region strictly similar, most of the clusters are specific to one or another.
An extensive and difficult manual annotation of the protein structures was also undertaken, based on a specific PDB field. This functional annotation shows that one half of the clusters are associated with only one function and 12% with more than two. The main reason is that purine binding sites are not specific to the function of the protein but are related to an activation/inhibition mechanism. Binding sites in the same clusters could be targeted by similar drug molecules. We have presented and carefully analyzed examples of the eight clusters with high Neq. Cluster 40 has the highest Neq (53). It contains binding sites from 279 Small GTPase and is associated with almost a hundred different functional annotations. However, interestingly, it comprises all small GTPases of the dataset, all sharing the same functional (inhibition and activation) mechanism through the binding of phosphate side of the purine ligand and the P-loop. SCOP superfamily c.37.1 is well represented here by SCOP family c.37.1.8. The presentation of links between clusters emphasizes the complexity of this approach. Indeed, a link is represented by a binding site for which constituent subsites are found in two different clusters. A region of a binding site is found in one cluster and another region is in another one, potentially, slightly overlapping (the overlapping must be less than the covering_factor threshold). This property is not only a difference due to protein flexibility but it is a true distinction in protein binding sites which can highlight subpocket similarities.
PROSITE patterns
A pertinent result of this study is from the analysis of distribution of PROSITE patterns. Even when numerous clusters have some different PROSITE patterns, they may remain quite homogeneous as most have redundant common patterns or related patterns. Our work also extends the creative works of Kasuya and Thornton made on the 3D-structure analysis of PROSITE patterns.97 They found numerous PROSITE patterns with common three-dimensional structure characteristics which could be used to create templates defining 3D functional patterns. Wu et al.98 recently improved on a previous study99 showing that 3D information is significantly more relevant than PROSITE patterns. Our work suggests that common and distinct characteristics can be associated with a given pattern and that distinct patterns share common local features. In the same way, our analysis highlights the interest in enriching PROSITE annotations for related protein sequences and structures. Indeed one third of proteins from our dataset are not annotated with PROSITE patterns. We have also demonstrated that this binding site classification can be further enriched by apo-structures. Indeed, MED-SuMo can be used to first detect their binding sites and then SCFs signature can be compared to those within the clusters.
Protein kinase
They play a central role in cell regulation pathways in eukaryotes species.100 As they represent the second largest drug target family for pharmaceutical companies, a chemogenomics concept, called kinomics,101 has been deeply explored. Although they essentially catalyze the same phosphoryl transfer reaction, they are involved with a remarkable number of different substrates, structures, and cell pathways. Analysis and classification of protein kinases have been made at the genomic sequence level with elegant approaches, such as KinG102 which allowed the identification of novel kinases as in Plasmodium vivax genome leading to new classifications. Some kinase studies have combined sequence and structure classification. Inhibition of kinase activities has been treated at the genomic level and analyzed with respect to these classifications.103
In 2002, Manning et al.104 established a standard protein kinase classification, the Kinome. This classification is sequence based and it highlights seven main families: TK: tyrosine kinase, TKL: tyrosine kinase-like, STE: Homologs of yeast Sterile, CK1; Casein Kinase 1, AGC; Protein kinase A, C, G, CAMK: Calcium/calmodulin-dependent protein kinase, CMGC: containing CDK, MAPK, GSK3, CLK families. An atypical kinase protein family was also described, containing all uncategorized kinase proteins. A point of interest in this analysis is the distance used in the classification which is solely based on local 3D similarity while the Kinome is based on complete sequences.
In the classification we present, protein kinases are present in seven clusters (46 (Neq = 2.14, size = 11), 100 (Neq = 2, size = 2), 121 (Neq = 2, size = 2), 155 (Neq = 1.96, size = 5), 157 (Neq = 17.71, size = 60), 183 (Neq = 6.41, size = 21), 211 (Neq = 11.29, size = 23)). The analysis of the populated clusters (size > 5) highlights particular aspects of the classification:
The most homogeneous cluster of this particular analysis is the MED-cluster 46. However, it does not contain only one type of kinase: 9 proteins are from the AGC and one from PTK family.
Cluster 211 has a high Neq but a more detailed analysis shows that it is very pure cluster with respect to the Kinome classification. Almost all its binding sites are from two branches of the kinome tree, the PTK and CMGC. Only one other protein is from another small distinct branch between PTK and CMGC (PDB code 2A19105). Other members of this kinome family are also found in Cluster 157.
Cluster 157 has a high Neq value, and 59 out of 60 binding sites are from protein kinase. However, they are from three different Kinome families (CMGC, TK, and CAMK) and from one atypical. Even if their sequences are different (which is why they are in three distinct families), their ATP binding sites have strong local structural and functional similarities detected by MED-SMA. To understand the disparity of the protein kinase families in this cluster, the ATP binding site of a cell division kinase 2 (CDK2, PDB code 1B38106) from the CMGC family was compared with the remainder of Cluster 157 using MED-SuMo. Figure 7 represents the 35 first hits of this MED-SuMo analysis. The first observation is that all CDK2 of the dataset are found by MED-SuMo (dark blue). The second observation is that protein kinases from the same family (CMGC) are also in the hit list (light blue). With only 23.54 % sequence identity, CDK2 and glycogen synthase kinase 3-BETA (GSK3β) are gathered the same kinome family (CMGC). A SAR study on protein kinase structures available in the PDB in 2004101 found similarities between activities of proteins from those 2 families. MED-SuMo detects local structural and functional similarities and MED-SMA classifies them in the same cluster. It underlines the functional interest of our classification approach. The final point concerning this cluster derives from the observed presence of other colors shown in Figure 7: PTK (green), CAMK (pink), TKL (gray), or atypical protein kinase (light red). The ANP binding site of a protein tyrosine kinase, Aurora-A (PDB code 2DWB) has higher score than some of the CDK2. Thus, the binding sites of 2DWB and 1B38 are more similar than 1B38 and other CDK2s (e.g. τ-protein kinase I: PDB code 1J1B107). This highlights surprising structural and functional similarities between a CDK2 and a aurora-A tyrosine kinase, whereas they are not in the same kinome family. An experimental study realized by Pevarello et al. show that CDK2 and Aurora-A activities can be inhibited by the same molecule classes; 1,4,5,6-tetrahydropyrrolo[3,4-c]pyrazoles.108 If they bind the same types of molecules, it implies that they are inhibited or activated by the same drugs, sharing binding modes of those molecules. MED-SMA clearly highlights this same fact by showing similar structural and functional properties gathered at those binding sites in the cluster.
Figure 7.

Comparison of a cyclin dependent kinase 2 to all binding sites of the classified dataset. Analysis of the MED-SuMo results of the comparison of the ATP binding site of a cyclin dependent kinase 2 (CDK2) (PDB code 1B38) to all purine binding sites of the dataset. The query line is yellow. Each color corresponds to a kinase protein family: CMGC (dark blue are CDK2, light blue are other kind of CMGC); PTK (green); CAMK (pink), TKL (gray) or atypical protein kinase (light red). The white lines are non-human kinase proteins; they are not associated with any Kinome families. [Color figure can be viewed in the online issue, which is available at http://www.interscience.wiley.com.]
The final remark on protein kinases concerns the enrichment protocol results. Many clusters have increased their number. For instance, Cluster 157 and Cluster 211 are, respectively, both enriched by 26 and 9 apo-protein structures. Hence, protein kinases sharing other types of ligand might also be associated with MED-clusters if the rest of the PROSITE dataset had been added to this enrichment protocol. Classification of datasets, with or without ligands, follow similar rules. Thus, the classification of protein kinases is often quite similar to the Kinome described by Manning et al.104 which is logical as related sequences share functional similarities. Nonetheless, some striking exceptions are grouped in the same cluster, protein structures from different part of the Kinome. This is also logical as MED-SMA clusters local 3D surface similarities and not sequences. Moreover, experimental results support these associations, reflecting functional similarity across the Kinome.
MED-SMA utility
This type of relationship between families is very interesting and their detection is a direct application for MED-SMA. In this classification, we chose to fix a high MED-SuMo minimal score (5.5 corresponding to at least 10 superimposable SCFs) to obtain functionally pure clusters. Other potential uses for this classification method are: deduction of enzymatic mechanism of poorly studied or newly discovered proteins, or in other cases, protein function deduction. Thus, we can validate the assertion that functions can be assigned to unknown proteins by finding which cluster(s) are best matches for the concerned structures. Matching to clusters rather than single structures will diminish a significant amount of the noise. All described applications are based on a potential presence of better known binding sites in the same cluster. Other applications are planned, a complete protein kinase classification with no ligand type filter. We are also studying the results of a classification of all binding sites of the PDB which is a fairly substantial undertaking.
Link
One last interesting link is observed between Cluster 56 (Neq = 1.76, size = 12) and Cluster 121 (Neq = 1, size = 2). Cluster 56's main function is DNA topoisomerase II, whereas cluster 120 contains a “histidine kinase.” The link is due to the presence of a “histidine kinase” in Cluster 56. A review109 outlines the fact that similarities are found between diverse ATP binding proteins. In fact, they report that histidine kinases are related to the superfamily GHKL ATPase (Gyrase, Hsp90, Histidine Kinase, and MutL). Other studies report that they are inhibited by the same drug, the radicicol. In a previous study,63 MED-SMA underlines these local similarities by collecting binding sites from these four families into a single cluster and illustrates them with a 3D view of their superimpositions around the drug radicicol (see Fig. 8 of Ref.63).
Figure 8.

MED-SuMo Graphical User Interface. Four different windows are shown: (1) the 3D viewer is at the top left of the Figure, here three elements are superimposed: the protein binding sites, the corresponding cocrystallized ligands, represented in stick and finally, the SCFs that enabled that superimposition. The viewer is an ActiveX control that allows the user to move the structures, for example, rotate, translate to visualize the hits as desired. (2) The result table window: the first line corresponds to the query name and its corresponding SCF signature. All other lines correspond to hits found by MED-SuMo. They are originally sorted by decreasing MED-SuMo score (8th column). Different elements are accessible, for example, 2D representation of the cocrystallized ligand, MED-SuMo score, quantity of common SCFs, ligand name, structure header. The most important column contains the list of common SCF between the query and the hits: the SCF signature. Each SCF is represented by a colored rectangle, for example, light blue is for HBond donor, dark blue for positive charges. The most important characteristic of these SCFs is that they each stand for 3D functional similarities. (3) The mini-viewer window enables the user to set graphically the depth cueing and clipping. (4) The result table contains the common SCF signature between the query and the hits. MED-SuMo GUI enables the user to classify the hits according their SCF signatures. The 4th window contains a dendrogram where all hits are present. The number of clusters can be selected by moving the yellow bar. [Color figure can be viewed in the online issue, which is available at http://www.interscience.wiley.com.]
Materials and Methods
Protein structure database
The dataset was built using the PDB.20 X-ray protein structures cocrystallized with ATP, ADP, AMP, ANP, GTP, GDP, GMP, GNP, or NAD were extracted. The final PDB dataset contains 2229 protein structures. To avoid a too large database, we chose to include only one binding site per type of ligand for each structure file. At the end, the MED-SuMo database contains 2322 binding sites.
The PROSITE database3 was also considered as it gathers protein domains, families or functional sites through more than 4300 sequence patterns or profiles. Each ligand name was used as a query to regroup related PROSITE patterns and profiles on the ExPASy website.110 For example, “ATP” is associated with the pattern PDOC00017. It corresponds to “ATP/GTP-binding site motif A (P-loop).” The PDB structures containing those patterns or profiles were used to gather a secondary dataset of 3515 protein structures. As most of purine binding proteins are not cocrystallized with purine ligands, only 880 protein structures are in both datasets.
MED-SuMo algorithm
MED-SuMo is designed to localize similar regions associated with a defined function.16,60,61,64 Its main advantage is to detect binding sites with similar or related binding modes which could not be identified using rigid (or even flexible) superimposition approaches. Its heuristic is based on a 3D representation of macromolecule structures using precise Structural Chemical Features (SCFs). For MED-SuMo, a protein structure is represented by a set of functional groups: unbound hydrogen bond (Hbond) donors or acceptors, accessible sides of aromatic rings and carboxylate groups, primary amide, guanidinium, hydroxyl, imidazole, thioether, and thiol groups. Each feature associates its chemical characteristics to precise geometrical properties. MED-SuMo comparison methodology (see Fig. 1) can be divided into two major steps:
The graph formation
SCFs are displayed on the protein structure through a lexicographic analysis of the atoms in the PDB files, that is, for each residue type, a list of predefined SCFs is specified [see Fig. 1(a)]. For example, a phenylalanine is represented by two H-bond acceptors, one H-bond donor, one aromatic and three hydrophobics. Once all SCFs are assigned, their positions and orientations are filtered to discard those likely to be involved in intra protein interactions and those too buried to interact with a potential ligand (see Fig. 1). Remaining SCFs are assembled into triangles with specific geometric characteristics, for example, edge sizes, perimeter, and angles [see Fig. 1(c)]. The triangle network is represented as a graph data structure where triangles are vertices and edges connect adjacent triangles. All graphs are stored in the MED-SuMo database [see Fig. 1(d)].
The graph comparison
To compare two graphs, MED-SuMo detects compatible triangles made of compatible SCFs [see Fig. 1(e)]. Compatible triangles are called comparison “seeds.” When a seed is detected, MED-SuMo extends the comparisons to the neighborhood vertices, until no more similarities are found. This list of compatible triangles is then used to create a list of SCFs pairs which are called “patches” and which represent the MED-SuMo hits. Those hits are then organized according to their score60 [see Fig. 1(f)]. Angle tolerance between the pairs of compatible triangles enables MED-SuMo to include flexibility in the comparison.
Comparisons are usually made between a query and a database of precompiled graphs. Three kinds of MED-SuMo databases exist: the binding site database made of the small protein regions characterized by cocrystallized ligands and small peptides. The full surface database which contains whole surfaces of the protein structures and the MED-Portions database also containing small protein regions but where characterized by chemical fragments detected in the ligands or peptides from the PDB.16,17
The original version of SuMo is available on the internet,61 but the latest improvements are only included in the MED-SuMo software distributed by MEDIT SA.62 These improvements concern the definition and conception of protein databases and as well as the heuristic itself. One of the most important new features is the Graphical User Interface (GUI). Indeed, the MED-SuMo GUI offers a simple, yet powerful, front-end to MEDIT's technology. To start a MED-SuMo search, the user loads its query protein in a 3D viewer. The binding sites are automatically detected by the presence of cocrystallized ligand or peptides. It is possible to either select one binding site or to define a manual selection. Once the selection is made, the user can launch the search on a one of the three available databases (binding sites, full surface or MED-Portions). The hits detected by MED-SuMo are displayed in a result table with columns containing the ligand 2D structure, the MED-SuMo score, the SCF signature, the RMSD of the corresponding SCF, and other features (see Fig. 8). The protein structures and the cocrystallized ligands can be superimposed in the 3D viewer thanks to the transformation matrix calculated by MED-SuMo for each hit.
Classification of protein binding sites
As noted, MED-SuMo has an interesting and original approach to detect structural and functional similarities between protein binding sites. Its ability is now used to classify datasets of structures and this method is called MED-SuMo_Multi Approach (MED-SMA). It operates in three major steps: comparison of all the binding sites of a dataset using a pairwise comparison system. Detection of matching regions in the binding sites to build a similarity graph, and finally, classification of this graph with the MCL.65 Figure 2.1 illustrates the global procedure, and Figure 2.2 depicts the six consecutive steps of the algorithm.
Algorithm description
To begin, a list of proteins is selected (see protein database paragraph). To build the MED-SuMo database, two strategies can be adopted: (i) the database contains all binding sites of the selected proteins, (i.e., binding sites where the cocrystallized ligands obey predefined rules including maximum (or minimum) number of atoms, number of residues if it is a small peptide; (ii) the database contains only specified binding sites, for example, only purine binding sites. Once the database is created, the comparison is launched using MED-SuMo pairwise comparison procedure [see Figs. 1 and 2.2(a)]. The main parameter at this step is the minimal score tolerated by MED-SuMo, that is, score_min. These comparisons highlight pairs of compatible SCFs between pairs of binding sites. At this step, if binding sites are isolated, that is, they do not match with any other binding sites of the dataset; they are considered as the singletons of the classification and thus won't be included in the clusters (see Fig. 2.2(b)]. The detected SCF groups are called patches [see Fig. 2.2(c)]. A binding site can contain several patches which associates itself to several binding sites. For each binding site, all of its patches are parsed. If two patches from the same binding site share enough SCFs, they are merged in multipatch. If two merged patches are associated with two distinct binding sites, the multipatch (subsites) underlines common SCFs between the considered binding sites and the two concerned binding sites. The threshold that defines the number of common SCFs needed is the parameter covering_factor. This is set to 0.6, meaning that 60% of the SCFs must be shared. A multipatch is a set of SCFs common to several binding sites of the dataset; they are named subsites in this publication. They represent the true meaningful common regions of binding sites. They ensured two properties: (i) enough SCFs are in common, that is, binding sites are structurally and functionally related and (ii) they can underline sub-pocket similarity. To compute the similarity graph, the MED-SuMo score between matching subsites is calculated [see Fig. 2.2(e)]. At the end, MCL interprets the graph and classifies the protein binding site dataset into clusters of subsites [see Fig. 2.2(f)]. A 2D plot of the clusters can be visualized using dedicated tools such as Biolayout.111,112
Classification analysis
A critical question when considering clustering methods is the quality of the data association within the clusters. For protein classification, anticipated results are different between sequence classifications, structural classifications, and different again with functional classifications.103,113–115 PDB files have many extractable annotations. The HEADER field, for example, can give specific information about the protein function. However, we used the MOLECULE field as it gives more precise information regarding functional annotations of the protein structures. For example, protein kinase (e.g., PDB code 1B38, 1QMZ) are annotated as “TRANSFERASE” in the HEADER field, whereas the MOLECULE field specifies “CELL DIVISION PROTEIN KINASE 2.” To evaluate the cluster homogeneity, an entropy-derived function is calculated for each cluster and then globally for the whole classification. This index is named Neq for “equivalent number of states.”69 It assesses the conditional equivalent number of the predicted states given the observed states. In our study, it is equivalent to the equivalent number of functions per cluster. First, the entropy of the cluster c, H(c), is computed. Then, the Neq is calculated, its expression is the exponential of Shannon entropy,116 H(c).
 |
(1) |
where p(ic) is the probability of the function i in the cluster c, and F is the count of observed functions. So, Neq(c) varies between 1 (i.e., only one function in the cluster) and F (i.e., each structure function is different). The Neq calculation is made on the MOLECULE fields of all the PDB files which were manually checked extensively and on which a few manual fixes were made.
Average sequence identity has been computed for each cluster thanks to CLUSTALW software.117
Classification enrichment
Our PROSITE dataset is also composed with purine binding protein structures. It contains 3515 structures of three types: 1492 are not cocrystallized with purine ligands, 880 are common to the PDB dataset, and are already included in our clusters and 1143 are apo-structures (protein structures with no ligands). Apo-structure proteins are hard to study as they require the analysis of their whole surfaces. Moreover, MED-SMA has only been used with binding sites. However, an interesting functionality of MED-SuMo is that it can deal with whole surfaces and is able to localize interesting binding regions on full protein surfaces.64 To do so, MED-SuMo compared the full surface of a protein to a binding site database composed with experimentally defined binding sites from the PDB. As mentioned earlier, the classified MED-SuMo database is made with all purine binding sites from the PDB. To localize purine binding sites on those PROSITE apo-structures and to identify in which cluster they could belong to, we arranged the following enrichment protocol in three steps: (1) all full surfaces of the protein structures are compared to the purine binding sites database. (2) Results are filtered according to the MED-SuMo score (value 5.5, same as the parameter score_min in the classification protocol). (3) SCF signature analysis; a structure enriches a cluster only if it shares 60% of its SCFs with at least one binding site of the cluster. For computation reasons, huge PDB files were excluded. Based on 1143 structures, 1130 MED-SuMo runs were launched.
Implementation
MED-SuMo server is written in OCaml. This language is suited for large-scale software engineering.116 External libraries are used, including MLsqlite: a sqlite wrapper for OCaml; zmarshall, a compression file manager; findlib: a package management system for Ocaml.
MED-SuMo is a client-server application and uses a scripting language to process calculations requested by the remote interfaces. A Lua interpreter is embedded in the MED-SuMo code, using the Lua-ML library.118 It enables the use of MED-SuMo's internal functions through very simple Lua scripts. The MED-SuMo_Multi module was added to MED-SuMo core and enables the classification of any binding site dataset. Lua scripts are used to create the database for the classifications. MED-SuMo jobs can be parallelized for several CPUs of multiprocessor computers and recent development at MEDIT has enabled MED-SuMo to be distributed across a HPC (High-Performance Computing) cluster. Ongoing development is concerned with parallelization of the entire classification method.
Software availability and requirements
The standard MED-SuMo mode to query 3D interaction surfaces against binding sites databases or full surface databases is commercially available with the MED-SuMo GUI. For the moment, MED-SMA is only available in a command line mode for integration with wider workflows. However, a web-based interface was developed to interactively explore the generated clusters. This will be available freely on the internet during the year 2010. MED-SuMo is commercial software, and further information is available at http://www.medit-pharma.com/. Parties interested in commercial evaluation of this technology can contact MEDIT SA to obtain free temporary licenses (info@medit.fr).
Conclusions
This approach is clearly embedded in the structural genomics field. It is fast and, as noted by Ferrè et al.,119 functional patches associated with a large collection of protein surface cavities can be used to provide functional clues to protein with unknown structures. This observation is relevant to the present study. Thus, MED-SMA is an approach that may improve the efficiency and effectiveness of early stage drug discovery steps, involving the initial lead selection, improving poor leads, or, multivariate optimization, as it was used in a previous study.17 This study demonstrates that MED-SuMo is a particularly well suited tool to both annotate protein structures and to enable structural functional classification. Finally, its effectiveness at dealing with the entire PDB shows that MED-SuMo is well-suited to large-scale applications.
Researcher from the INSERM Institute UMR-S 665 has no financial interests in MEDIT SA and collaborates with this company only for the present project. Therefore, MEDIT SA has the exclusivity for MED-SuMo sales.
Acknowledgments
The authors are indebted to S. Adcock for useful comments on the manuscript and to all researchers who deposit their structures in the PDB. MEDIT SA retains all rights on the presented methodology.
References
- 1.Altschul SF, Madden TL, Schaffer AA, Zhang J, Zhang Z, Miller W, Lipman DJ. Gapped BLAST and PSI-BLAST: a new generation of protein database search programs. Nucleic Acids Res. 1997;25:3389–3402. doi: 10.1093/nar/25.17.3389. [DOI] [PMC free article] [PubMed] [Google Scholar]
- 2.Sigrist CJ, Cerutti L, Hulo N, Gattiker A, Falquet L, Pagni M, Bairoch A, Bucher P. PROSITE: a documented database using patterns and profiles as motif descriptors. Brief Bioinform. 2002;3:265–274. doi: 10.1093/bib/3.3.265. [DOI] [PubMed] [Google Scholar]
- 3.Hulo N, Bairoch A, Bulliard V, Cerutti L, De Castro E, Langendijk-Genevaux PS, Pagni M, Sigrist CJ. The PROSITE database. Nucleic Acids Res. 2006;34:D227–D230. doi: 10.1093/nar/gkj063. [DOI] [PMC free article] [PubMed] [Google Scholar]
- 4.de Castro E, Sigrist CJ, Gattiker A, Bulliard V, Langendijk-Genevaux PS, Gasteiger E, Bairoch A, Hulo N. ScanProsite: detection of PROSITE signature matches and ProRule-associated functional and structural residues in proteins. Nucleic Acids Res. 2006;34:W362–W365. doi: 10.1093/nar/gkl124. [DOI] [PMC free article] [PubMed] [Google Scholar]
- 5.Gattiker A, Gasteiger E, Bairoch A. ScanProsite: a reference implementation of a PROSITE scanning tool. Appl Bioinform. 2002;1:107–108. [PubMed] [Google Scholar]
- 6.Sonnhammer EL, Eddy SR, Durbin R. Pfam: a comprehensive database of protein domain families based on seed alignments. Proteins. 1997;28:405–420. doi: 10.1002/(sici)1097-0134(199707)28:3<405::aid-prot10>3.0.co;2-l. [DOI] [PubMed] [Google Scholar]
- 7.Finn RD, Mistry J, Schuster-Bockler B, Griffiths-Jones S, Hollich V, Lassmann T, Moxon S, Marshall M, Khanna A, Durbin R, Eddy SR, Sonnhammer EL, Bateman A. Pfam: clans, web tools and services. Nucleic Acids Res. 2006;34:D247–D251. doi: 10.1093/nar/gkj149. [DOI] [PMC free article] [PubMed] [Google Scholar]
- 8.Friedberg I, Harder T, Godzik A. JAFA: a protein function annotation meta-server. Nucleic Acids Res. 2006;34:W379–W381. doi: 10.1093/nar/gkl045. [DOI] [PMC free article] [PubMed] [Google Scholar]
- 9.Todd AE, Marsden RL, Thornton JM, Orengo CA. Progress of structural genomics initiatives: an analysis of solved target structures. J Mol Biol. 2005;348:1235–1260. doi: 10.1016/j.jmb.2005.03.037. [DOI] [PubMed] [Google Scholar]
- 10.Wendt KU, Weiss MS, Cramer P, Heinz DW. Structures and diseases. Nat Struct Mol Biol. 2008;15:117–120. doi: 10.1038/nsmb0208-117. [DOI] [PMC free article] [PubMed] [Google Scholar]
- 11.de Brevern AG. New opportunities to fight against infectious diseases and to identify pertinent drug targets with novel methodologies. Infect Disord Drug Targets. 2009;9:246–247. doi: 10.2174/1871526510909030246. [DOI] [PMC free article] [PubMed] [Google Scholar]
- 12.Guido RV, Oliva G, Andricopulo AD. Virtual screening and its integration with modern drug design technologies. Curr Med Chem. 2008;15:37–46. doi: 10.2174/092986708783330683. [DOI] [PubMed] [Google Scholar]
- 13.Rollinger JM, Stuppner H, Langer T. Virtual screening for the discovery of bioactive natural products. Prog Drug Res. 2008;65:211–249. doi: 10.1007/978-3-7643-8117-2_6. [DOI] [PMC free article] [PubMed] [Google Scholar]
- 14.Shaikh SA, Jain T, Sandhu G, Latha N, Jayaram B. From drug target to leads—sketching a physicochemical pathway for lead molecule design in silico. Curr Pharm Des. 2007;13:3454–3470. doi: 10.2174/138161207782794220. [DOI] [PubMed] [Google Scholar]
- 15.Waszkowycz B. Towards improving compound selection in structure-based virtual screening. Drug Discov Today. 2008;13:219–226. doi: 10.1016/j.drudis.2007.12.002. [DOI] [PubMed] [Google Scholar]
- 16.Moriaud F, Doppelt-Azeroual O, Martin L, Oguievetskaia K, Koch K, Vorotyntsev A, Adcock SA, Delfaud F. Computational fragment-based approach at PDB scale by protein local similarity. J Chem Inf Model. 2009;49:280–294. doi: 10.1021/ci8003094. [DOI] [PubMed] [Google Scholar]
- 17.Oguievetskaia K, Martin-Chanas L, Vorotyntsev A, Doppelt-Azeroual O, Brotel X, Adcock SA, de Brevern AG, Delfaud F, Moriaud F. Computational fragment-based drug design to explore the hydrophobic sub-pocket of the mitotic kinesin Eg5 allosteric binding site. J Comput Aided Mol Des. 2009;23:571–582. doi: 10.1007/s10822-009-9286-z. [DOI] [PubMed] [Google Scholar]
- 18.Crespo A, Fernandez A. Induced disorder in protein-ligand complexes as a drug-design strategy. Mol Pharm. 2008;5:430–437. doi: 10.1021/mp700148h. [DOI] [PubMed] [Google Scholar]
- 19.Das K, Bauman JD, Clark AD, Jr, Frenkel YV, Lewi PJ, Shatkin AJ, Hughes SH, Arnold E. High-resolution structures of HIV-1 reverse transcriptase/TMC278 complexes: strategic flexibility explains potency against resistance mutations. Proc Natl Acad Sci USA. 2008;105:1466–1471. doi: 10.1073/pnas.0711209105. [DOI] [PMC free article] [PubMed] [Google Scholar]
- 20.Berman HM, Westbrook J, Feng Z, Gilliland G, Bhat TN, Weissig H, Shindyalov IN, Bourne PE. The Protein Data Bank. Nucl Acids Res. 2000;28:235–242. doi: 10.1093/nar/28.1.235. [DOI] [PMC free article] [PubMed] [Google Scholar]
- 21.Bernstein FC, Koetzle TF, Williams GJ, Meyer EF, Jr, Brice MD, Rodgers JR, Kennard O, Shimanouchi T, Tasumi M. The Protein Data Bank: a computer-based archival file for macromolecular structures. J Mol Biol. 1977;112:535–542. doi: 10.1016/s0022-2836(77)80200-3. [DOI] [PubMed] [Google Scholar]
- 22.Jefferson ER, Walsh TP, Barton GJ. A comparison of SCOP and CATH with respect to domain-domain interactions. Proteins. 2008;70:54–62. doi: 10.1002/prot.21496. [DOI] [PubMed] [Google Scholar]
- 23.Hadley C, Jones DT. A systematic comparison of protein structure classifications: SCOP, CATH and FSSP. Structure. 1999;7:1099–1112. doi: 10.1016/s0969-2126(99)80177-4. [DOI] [PubMed] [Google Scholar]
- 24.Getz G, Vendruscolo M, Sachs D, Domany E. Automated assignment of SCOP and CATH protein structure classifications from FSSP scores. Proteins. 2002;46:405–415. doi: 10.1002/prot.1176. [DOI] [PubMed] [Google Scholar]
- 25.Murzin AG, Brenner SE, Hubbard T, Chothia C. SCOP: a structural classification of proteins database for the investigation of sequences and structures. J Mol Biol. 1995;247:536–540. doi: 10.1006/jmbi.1995.0159. [DOI] [PubMed] [Google Scholar]
- 26.Andreeva A, Howorth D, Chandonia JM, Brenner SE, Hubbard TJ, Chothia C, Murzin AG. Data growth and its impact on the SCOP database: new developments. Nucleic Acids Res. 2008;36:D419–D425. doi: 10.1093/nar/gkm993. [DOI] [PMC free article] [PubMed] [Google Scholar]
- 27.Altschul SF, Gish W, Miller W, Myers EW, Lipman DJ. Basic local alignment search tool. J Mol Biol. 1990;215:403–410. doi: 10.1016/S0022-2836(05)80360-2. [DOI] [PubMed] [Google Scholar]
- 28.Yoon S, Ebert JC, Chung EY, De Micheli G, Altman RB. Clustering protein environments for function prediction: finding PROSITE motifs in 3D. BMC Bioinform. 2007;8:S10. doi: 10.1186/1471-2105-8-S4-S10. [DOI] [PMC free article] [PubMed] [Google Scholar]
- 29.Ma BG, Chen L, Ji HF, Chen ZH, Yang FR, Wang L, Qu G, Jiang YY, Ji C, Zhang HY. Characters of very ancient proteins. Biochem Biophys Res Commun. 2008;366:607–611. doi: 10.1016/j.bbrc.2007.12.014. [DOI] [PubMed] [Google Scholar]
- 30.Harrison A, Pearl F, Mott R, Thornton J, Orengo C. Quantifying the similarities within fold space. J Mol Biol. 2002;323:909–926. doi: 10.1016/s0022-2836(02)00992-0. [DOI] [PubMed] [Google Scholar]
- 31.Porter CT, Bartlett GJ, Thornton JM. The Catalytic Site Atlas: a resource of catalytic sites and residues identified in enzymes using structural data. Nucleic Acids Res. 2004;32:D129–D133. doi: 10.1093/nar/gkh028. [DOI] [PMC free article] [PubMed] [Google Scholar]
- 32.Bartlett GJ, Porter CT, Borkakoti N, Thornton JM. Analysis of catalytic residues in enzyme active sites. J Mol Biol. 2002;324:105–121. doi: 10.1016/s0022-2836(02)01036-7. [DOI] [PubMed] [Google Scholar]
- 33.Schmitt S, Kuhn D, Klebe G. A new method to detect related function among proteins independent of sequence and fold homology. J Mol Biol. 2002;323:387–406. doi: 10.1016/s0022-2836(02)00811-2. [DOI] [PubMed] [Google Scholar]
- 34.Weber A, Casini A, Heine A, Kuhn D, Supuran CT, Scozzafava A, Klebe G. Unexpected nanomolar inhibition of carbonic anhydrase by COX-2-selective celecoxib: new pharmacological opportunities due to related binding site recognition. J Med Chem. 2004;47:550–557. doi: 10.1021/jm030912m. [DOI] [PubMed] [Google Scholar]
- 35.Kuhn D, Weskamp N, Hullermeier E, Klebe G. Functional classification of protein kinase binding sites using Cavbase. ChemMedChem. 2007;2:1432–1447. doi: 10.1002/cmdc.200700075. [DOI] [PubMed] [Google Scholar]
- 36.Kuhn D, Weskamp N, Schmitt S, Hullermeier E, Klebe G. From the similarity analysis of protein cavities to the functional classification of protein families using cavbase. J Mol Biol. 2006;359:1023–1044. doi: 10.1016/j.jmb.2006.04.024. [DOI] [PMC free article] [PubMed] [Google Scholar]
- 37.Shulman-Peleg A, Nussinov R, Wolfson HJ. Recognition of functional sites in protein structures. J Mol Biol. 2004;339:607–633. doi: 10.1016/j.jmb.2004.04.012. [DOI] [PMC free article] [PubMed] [Google Scholar]
- 38.Mintz S, Shulman-Peleg A, Wolfson HJ, Nussinov R. Generation and analysis of a protein-protein interface data set with similar chemical and spatial patterns of interactions. Proteins. 2005;61:6–20. doi: 10.1002/prot.20580. [DOI] [PubMed] [Google Scholar]
- 39.Shulman-Peleg A, Nussinov R, Wolfson HJ. SiteEngines: recognition and comparison of binding sites and protein-protein interfaces. Nucleic Acids Res. 2005;33:W337–W341. doi: 10.1093/nar/gki482. [DOI] [PMC free article] [PubMed] [Google Scholar]
- 40.Baroni M, Cruciani G, Sciabola S, Perruccio F, Mason JS. A common reference framework for analyzing/comparing proteins and ligands. Fingerprints for Ligands and Proteins (FLAP): theory and application. J Chem Inf Model. 2007;47:279–294. doi: 10.1021/ci600253e. [DOI] [PubMed] [Google Scholar]
- 41.Powers R, Copeland JC, Germer K, Mercier KA, Ramanathan V, Revesz P. Comparison of protein active site structures for functional annotation of proteins and drug design. Proteins. 2006;65:124–135. doi: 10.1002/prot.21092. [DOI] [PubMed] [Google Scholar]
- 42.Kinoshita K, Murakami Y, Nakamura H. eF-seek: prediction of the functional sites of proteins by searching for similar electrostatic potential and molecular surface shape. Nucleic Acids Res. 2007;35:W398–W402. doi: 10.1093/nar/gkm351. [DOI] [PMC free article] [PubMed] [Google Scholar]
- 43.Standley DM, Kinjo AR, Kinoshita K, Nakamura H. Protein structure databases with new web services for structural biology and biomedical research. Brief Bioinform. 2008;9:276–285. doi: 10.1093/bib/bbn015. [DOI] [PubMed] [Google Scholar]
- 44.Nebel JC, Herzyk P, Gilbert DR. Automatic generation of 3D motifs for classification of protein binding sites. BMC Bioinform. 2007;8:321. doi: 10.1186/1471-2105-8-321. [DOI] [PMC free article] [PubMed] [Google Scholar]
- 45.Lichtarge O, Bourne HR, Cohen FE. An evolutionary trace method defines binding surfaces common to protein families. J Mol Biol. 1996;257:342–358. doi: 10.1006/jmbi.1996.0167. [DOI] [PubMed] [Google Scholar]
- 46.Mihalek I, Res I, Lichtarge O. Evolutionary trace report_maker: a new type of service for comparative analysis of proteins. Bioinformatics. 2006;22:1656–1657. doi: 10.1093/bioinformatics/btl157. [DOI] [PubMed] [Google Scholar]
- 47.Morgan DH, Kristensen DM, Mittelman D, Lichtarge O. ET viewer: an application for predicting and visualizing functional sites in protein structures. Bioinformatics. 2006;22:2049–2050. doi: 10.1093/bioinformatics/btl285. [DOI] [PubMed] [Google Scholar]
- 48.Madabushi S, Gross AK, Philippi A, Meng EC, Wensel TG, Lichtarge O. Evolutionary trace of G protein-coupled receptors reveals clusters of residues that determine global and class-specific functions. J Biol Chem. 2004;279:8126–8132. doi: 10.1074/jbc.M312671200. [DOI] [PubMed] [Google Scholar]
- 49.Kristensen DM, Ward RM, Lisewski AM, Erdin S, Chen BY, Fofanov VY, Kimmel M, Kavraki LE, Lichtarge O. Prediction of enzyme function based on 3D templates of evolutionarily important amino acids. BMC Bioinform. 2008;9:17. doi: 10.1186/1471-2105-9-17. [DOI] [PMC free article] [PubMed] [Google Scholar]
- 50.George RA, Spriggs RV, Bartlett GJ, Gutteridge A, MacArthur MW, Porter CT, Al-Lazikani B, Thornton JM, Swindells MB. Effective function annotation through catalytic residue conservation. Proc Natl Acad Sci USA. 2005;102:12299–122304. doi: 10.1073/pnas.0504833102. [DOI] [PMC free article] [PubMed] [Google Scholar]
- 51.Laskowski RA, Watson JD, Thornton JM. From protein structure to biochemical function? J Struct Funct Genomics. 2003;4:167–177. doi: 10.1023/a:1026127927612. [DOI] [PubMed] [Google Scholar]
- 52.Laskowski RA, Watson JD, Thornton JM. ProFunc: a server for predicting protein function from 3D structure. Nucleic Acids Res. 2005;33:W89–W93. doi: 10.1093/nar/gki414. [DOI] [PMC free article] [PubMed] [Google Scholar]
- 53.Morris RJ, Najmanovich RJ, Kahraman A, Thornton JM. Real spherical harmonic expansion coefficients as 3D shape descriptors for protein binding pocket and ligand comparisons. Bioinformatics. 2005;21:2347–2355. doi: 10.1093/bioinformatics/bti337. [DOI] [PubMed] [Google Scholar]
- 54.Watson JD, Sanderson S, Ezersky A, Savchenko A, Edwards A, Orengo C, Joachimiak A, Laskowski RA, Thornton JM. Towards fully automated structure-based function prediction in structural genomics: a case study. J Mol Biol. 2007;367:1511–1522. doi: 10.1016/j.jmb.2007.01.063. [DOI] [PMC free article] [PubMed] [Google Scholar]
- 55.Brylinski M, Konieczny L, Roterman I. Hydrophobic collapse in late-stage folding (in silico) of bovine pancreatic trypsin inhibitor. Biochimie. 2006;88:1229–1239. doi: 10.1016/j.biochi.2006.03.008. [DOI] [PubMed] [Google Scholar]
- 56.Konieczny L, Brylinski M, Roterman I. Gauss-function-Based model of hydrophobicity density in proteins. In Silico Biol. 2006;6:15–22. [PubMed] [Google Scholar]
- 57.Brylinski M, Konieczny L, Roterman I. Ligation site in proteins recognized in silico. Bioinformation. 2006;1:127–129. doi: 10.6026/97320630001127. [DOI] [PMC free article] [PubMed] [Google Scholar]
- 58.Jurkowski W, Brylinski M, Konieczny L, Wiiniowski Z, Roterman I. Conformational subspace in simulation of early-stage protein folding. Proteins. 2004;55:115–1127. doi: 10.1002/prot.20002. [DOI] [PubMed] [Google Scholar]
- 59.Brylinski M, Prymula K, Jurkowski W, Kochanczyk M, Stawowczyk E, Konieczny L, Roterman I. Prediction of functional sites based on the fuzzy oil drop model. PLoS Comput Biol. 2007;3:e94. doi: 10.1371/journal.pcbi.0030094. [DOI] [PMC free article] [PubMed] [Google Scholar]
- 60.Jambon M, Imberty A, Deleage G, Geourjon C. A new bioinformatic approach to detect common 3D sites in protein structures. Proteins. 2003;52:137–145. doi: 10.1002/prot.10339. [DOI] [PubMed] [Google Scholar]
- 61.Jambon M, Andrieu O, Combet C, Deleage G, Delfaud F, Geourjon C. The SuMo server: 3D search for protein functional sites. Bioinformatics. 2005;21:3929–3930. doi: 10.1093/bioinformatics/bti645. [DOI] [PubMed] [Google Scholar]
- 62.MEDIT-SA. Available at: http://medit-pharma.com/ Accessed on 5 march 2010.
- 63.Doppelt-Azeroual O, Moriaud F, Delfaud F, de Brevern AG. Analysis of HSP90 related folds with MED-SuMo classification approach. Drug Des Dev Therapy. 2009;3:59–72. doi: 10.2147/dddt.s4706. [DOI] [PMC free article] [PubMed] [Google Scholar]
- 64.Doppelt O, Moriaud F, Bornot A, de Brevern AG. Functional annotation strategy for protein structures. Bioinformation. 2007;1:357–359. doi: 10.6026/97320630001357. [DOI] [PMC free article] [PubMed] [Google Scholar]
- 65.van Dongen S. Graph clustering by flow simulation. University of Utrecht; 2000. p. 173. PhD Thesis. [Google Scholar]
- 66.Kabsch W, Mannherz HG, Suck D, Pai EF, Holmes KC. Atomic structure of the actDNase I complex. Nature. 1990;347:37–44. doi: 10.1038/347037a0. [DOI] [PubMed] [Google Scholar]
- 67.De Brevern AG, Etchebest C, Hazout S. Bayesian probabilistic approach for predicting backbone structures in terms of protein blocks. Proteins. 2000;41:271–287. doi: 10.1002/1097-0134(20001115)41:3<271::aid-prot10>3.0.co;2-z. [DOI] [PubMed] [Google Scholar]
- 68.Hazout S. Entropy-derived measures for assessing the accuracy of N-state prediction algorithms. In: de Brevern AG, editor. In recent advances in structural bioinformatics. Trivandrum, India: Research signpost; 2007. pp. 395–417. [Google Scholar]
- 69.Shannon C. A mathematical theory of communication. Bell Syst Tech J. 1948;27:379–423. [Google Scholar]
- 70.Gatzeva-Topalova PZ, May AP, Sousa MC. Structure and mechanism of ArnA: conformational change implies ordered dehydrogenase mechanism in key enzyme for polymyxin resistance. Structure. 2005;13:929–942. doi: 10.1016/j.str.2005.03.018. [DOI] [PMC free article] [PubMed] [Google Scholar]
- 71.Allard ST, Beis K, Giraud MF, Hegeman AD, Gross JW, Wilmouth RC, Whitfield C, Graninger M, Messner P, Allen AG, Maskell DJ, Naismith JH. Toward a structural understanding of the dehydratase mechanism. Structure. 2002;10:81–92. doi: 10.1016/s0969-2126(01)00694-3. [DOI] [PubMed] [Google Scholar]
- 72.Webb NA, Mulichak AM, Lam JS, Rocchetta HL, Garavito RM. Crystal structure of a tetrameric GDP-D-mannose 4,6-dehydratase from a bacterial GDP-D-rhamnose biosynthetic pathway. Protein Sci. 2004;13:529–539. doi: 10.1110/ps.03393904. [DOI] [PMC free article] [PubMed] [Google Scholar]
- 73.Bairoch A, Boeckmann B, Ferro S, Gasteiger E. Swiss-Prot: Juggling between evolution and stability. Brief Bioinform. 2004;5:39–55. doi: 10.1093/bib/5.1.39. [DOI] [PubMed] [Google Scholar]
- 74.Hung LW, Wang IX, Nikaido K, Liu PQ, Ames GF, Kim SH. Crystal structure of the ATP-binding subunit of an ABC transporter. Nature. 1998;396:703–707. doi: 10.1038/25393. [DOI] [PubMed] [Google Scholar]
- 75.Chen J, Lu G, Lin J, Davidson AL, Quiocho FA. A tweezers-like motion of the ATP-binding cassette dimer in an ABC transport cycle. Mol Cell. 2003;12:651–661. doi: 10.1016/j.molcel.2003.08.004. [DOI] [PubMed] [Google Scholar]
- 76.Lewis HA, Buchanan SG, Burley SK, Conners K, Dickey M, Dorwart M, Fowler R, Gao X, Guggino WB, Hendrickson WA, Hunt JF, Kearins MC, Lorimer D, Maloney PC, Post KW, Rajashankar KR, Rutter ME, Sauder JM, Shriver S, Thibodeau PH, Thomas PJ, Zhang M, Zhao X, Emtage S. Structure of nucleotide-binding domain 1 of the cystic fibrosis transmembrane conductance regulator. EMBO J. 2004;23:282–293. doi: 10.1038/sj.emboj.7600040. [DOI] [PMC free article] [PubMed] [Google Scholar]
- 77.Ramaen O, Leulliot N, Sizun C, Ulryck N, Pamlard O, Lallemand JY, Tilbeurgh H, Jacquet E. Structure of the human multidrug resistance protein 1 nucleotide binding domain 1 bound to Mg2+/ATP reveals a non-productive catalytic site. J Mol Biol. 2006;359:940–949. doi: 10.1016/j.jmb.2006.04.005. [DOI] [PubMed] [Google Scholar]
- 78.Zaitseva J, Oswald C, Jumpertz T, Jenewein S, Wiedenmann A, Holland IB, Schmitt L. A structural analysis of asymmetry required for catalytic activity of an ABC-ATPase domain dimer. EMBO J. 2006;25:3432–3443. doi: 10.1038/sj.emboj.7601208. [DOI] [PMC free article] [PubMed] [Google Scholar]
- 79.Gaudet R, Wiley DC. Structure of the ABC ATPase domain of human TAP1, the transporter associated with antigen processing. EMBO J. 2001;20:4964–4972. doi: 10.1093/emboj/20.17.4964. [DOI] [PMC free article] [PubMed] [Google Scholar]
- 80.Beis I, Newsholme EA. The contents of adenine nucleotides, phosphagens and some glycolytic intermediates in resting muscles from vertebrates and invertebrates. Biochem J. 1975;152:23–32. doi: 10.1042/bj1520023. [DOI] [PMC free article] [PubMed] [Google Scholar]
- 81.Iyidogan P, Lutz S. Systematic exploration of active site mutations on human deoxycytidine kinase substrate specificity. Biochemistry. 2008;47:4711–4720. doi: 10.1021/bi800157e. [DOI] [PMC free article] [PubMed] [Google Scholar]
- 82.Reyes CL, Rutenber E, Walter P, Stroud RM. X-ray structures of the signal recognition particle receptor reveal targeting cycle intermediates. PLoS ONE. 2007;2:e607. doi: 10.1371/journal.pone.0000607. [DOI] [PMC free article] [PubMed] [Google Scholar]
- 83.Kornberg T, Gefter ML. Deoxyribonucleic acid synthesis in cell-free extracts. IV. Purification and catalytic properties of deoxyribonucleic acid polymerase III. J Biol Chem. 1972;247:5369–5375. [PubMed] [Google Scholar]
- 84.Oganesyan V, Adams PD, Jancarik J, Kim R, Kim SH. Structure of O67745_AQUAE, a hypothetical protein from Aquifex aeolicus. Acta Cryst. 2007;63:369–374. doi: 10.1107/S1744309107018945. [DOI] [PMC free article] [PubMed] [Google Scholar]
- 85.Kim DY, Kim KK. Crystal structure of ClpX molecular chaperone from Helicobacter pylori. J Biol Chem. 2003;278:50664–50670. doi: 10.1074/jbc.M305882200. [DOI] [PubMed] [Google Scholar]
- 86.Bowman GD, O'donnell M, Kuriyan J. Structural analysis of a eukaryotic sliding DNA clamp-clamp loader complex. Nature. 2004;429:724–730. doi: 10.1038/nature02585. [DOI] [PubMed] [Google Scholar]
- 87.Kazmirski SL, Podobnik M, Weitze TF, O'Donnell M, Kuriyan J. Structural analysis of the inactive state of the Escherichia coli DNA polymerase clamp-loader complex. Proc Natl Acad Sci USA. 2004;101:16750–16755. doi: 10.1073/pnas.0407904101. [DOI] [PMC free article] [PubMed] [Google Scholar]
- 88.Xu W, Harrison SC, Eck MJ. Three-dimensional structure of the tyrosine kinase c-Src. Nature. 1997;385:595–602. doi: 10.1038/385595a0. [DOI] [PubMed] [Google Scholar]
- 89.Goldsmith-Fischman S, Honig B. Structural genomics: computational methods for structure analysis. Protein Sci. 2003;12:1813–1821. doi: 10.1110/ps.0242903. [DOI] [PMC free article] [PubMed] [Google Scholar]
- 90.Dessailly BH, Lensink MF, Wodak SJ. Relating destabilizing regions to known functional sites in proteins. BMC Bioinform. 2007;8:141. doi: 10.1186/1471-2105-8-141. [DOI] [PMC free article] [PubMed] [Google Scholar]
- 91.Brown DP, Krishnamurthy N, Sjolander K. Automated protein subfamily identification and classification. PLoS Comput Biol. 2007;3:e160. doi: 10.1371/journal.pcbi.0030160. [DOI] [PMC free article] [PubMed] [Google Scholar]
- 92.Mao L, Wang Y, Liu Y, Hu X. Molecular determinants for ATP-binding in proteins: a data mining and quantum chemical analysis. J Mol Biol. 2004;336:787–807. doi: 10.1016/j.jmb.2003.12.056. [DOI] [PubMed] [Google Scholar]
- 93.Niefind K, Putter M, Guerra B, Issinger OG, Schomburg D. GTP plus water mimic ATP in the active site of protein kinase CK2. Nat Struct Biol. 1999;6:1100–1103. doi: 10.1038/70033. [DOI] [PubMed] [Google Scholar]
- 94.Yde CW, Ermakova I, Issinger OG, Niefind K. Inclining the purine base binding plane in protein kinase CK2 by exchanging the flanking side-chains generates a preference for ATP as a cosubstrate. J Mol Biol. 2005;347:399–414. doi: 10.1016/j.jmb.2005.01.003. [DOI] [PubMed] [Google Scholar]
- 95.Sotriffer C, Klebe G. Identification and mapping of small-molecule binding sites in proteins: computational tools for structure-based drug design. Farmaco. 2002;57:243–251. doi: 10.1016/s0014-827x(02)01211-9. [DOI] [PubMed] [Google Scholar]
- 96.Wei L, Altman RB. Recognizing protein binding sites using statistical descriptions of their 3D environments. Pac Symp. 1998:497–508. [PubMed] [Google Scholar]
- 97.Kasuya A, Thornton JM. Three-dimensional structure analysis of PROSITE patterns. J Mol Biol. 1999;286:1673–1691. doi: 10.1006/jmbi.1999.2581. [DOI] [PubMed] [Google Scholar]
- 98.Wu S, Liang MP, Altman RB. The SeqFEATURE library of 3D functional site models: comparison to existing methods and applications to protein function annotation. Genome Biol. 2008;9:R8. doi: 10.1186/gb-2008-9-1-r8. [DOI] [PMC free article] [PubMed] [Google Scholar]
- 99.Halperin I, Glazer DS, Wu S, Altman RB. The FEATURE framework for protein function annotation: modeling new functions, improving performance, and extending to novel applications. BMC Genomics. 2008;9:S2. doi: 10.1186/1471-2164-9-S2-S2. [DOI] [PMC free article] [PubMed] [Google Scholar]
- 100.Manly CJ, Chandrasekhar J, Ochterski JW, Hammer JD, Warfield BB. Strategies and tactics for optimizing the Hit-to-Lead process and beyond—a computational chemistry perspective. Drug Discov Today. 2008;13:99–109. doi: 10.1016/j.drudis.2007.10.019. [DOI] [PubMed] [Google Scholar]
- 101.Vieth M, Higgs RE, Robertson DH, Shapiro M, Gragg EA, Hemmerle H. Kinomics-structural biology and chemogenomics of kinase inhibitors and targets. Biochim Biophys Acta. 2004;1697:243–257. doi: 10.1016/j.bbapap.2003.11.028. [DOI] [PubMed] [Google Scholar]
- 102.Krupa A, Abhinandan KR, Srinivasan N. KinG: a database of protein kinases in genomes. Nucleic Acids Res. 2004;32:D153–D155. doi: 10.1093/nar/gkh019. [DOI] [PMC free article] [PubMed] [Google Scholar]
- 103.Cheek S, Ginalski K, Zhang H, Grishin NV. A comprehensive update of the sequence and structure classification of kinases. BMC Struct Biol. 2005;5:6. doi: 10.1186/1472-6807-5-6. [DOI] [PMC free article] [PubMed] [Google Scholar]
- 104.Manning G, Whyte DB, Martinez R, Hunter T, Sudarsanam S. The protein kinase complement of the human genome. Science. 2002;298:1912–1934. doi: 10.1126/science.1075762. [DOI] [PubMed] [Google Scholar]
- 105.Dar AC, Dever TE, Sicheri F. Higher-order substrate recognition of eIF2alpha by the RNA-dependent protein kinase PKR. Cell. 2005;122:887–900. doi: 10.1016/j.cell.2005.06.044. [DOI] [PubMed] [Google Scholar]
- 106.Brown NR, Noble ME, Lawrie AM, Morris MC, Tunnah P, Divita G, Johnson LN, Endicott JA. Effects of phosphorylation of threonine 160 on cyclin-dependent kinase 2 structure and activity. J Biol Chem. 1999;274:8746–8756. doi: 10.1074/jbc.274.13.8746. [DOI] [PubMed] [Google Scholar]
- 107.Aoki M, Yokota T, Sugiura I, Sasaki C, Hasegawa T, Okumura C, Ishiguro K, Kohno T, Sugio S, Matsuzaki T. Structural insight into nucleotide recognition in tau-protein kinase I/glycogen synthase kinase 3 beta. Acta Cryst. 2004;60:439–446. doi: 10.1107/S090744490302938X. [DOI] [PubMed] [Google Scholar]
- 108.Pevarello P, Fancelli D, Vulpetti A, Amici R, Villa M, Pittala V, Vianello P, Cameron A, Ciomei M, Mercurio C, Bischoff JR, Roletto F, Varasi M, Brasca MG. 3-Amino-1,4,5,6-tetrahydropyrrolo[3,4-c]pyrazoles: a new class of CDK2 inhibitors. Bioorg Med Chem Lett. 2006;16:1084–1090. doi: 10.1016/j.bmcl.2005.10.071. [DOI] [PubMed] [Google Scholar]
- 109.Dutta R, Inouye M. GHKL, an emergent ATPase/kinase superfamily. Trends Biochem Sci. 2000;25:24–28. doi: 10.1016/s0968-0004(99)01503-0. [DOI] [PubMed] [Google Scholar]
- 110.Gasteiger E, Gattiker A, Hoogland C, Ivanyi I, Appel RD, Bairoch A. ExPASy: the proteomics server for in-depth protein knowledge and analysis. Nucleic Acids Res. 2003;31:3784–3788. doi: 10.1093/nar/gkg563. [DOI] [PMC free article] [PubMed] [Google Scholar]
- 111.Enright AJ, Ouzounis CA. BioLayout—an automatic graph layout algorithm for similarity visualization. Bioinformatics. 2001;17:853–854. doi: 10.1093/bioinformatics/17.9.853. [DOI] [PubMed] [Google Scholar]
- 112.Goldovsky L, Cases I, Enright AJ, Ouzounis CA. BioLayout(Java): versatile network visualisation of structural and functional relationships. Appl Bioinform. 2005;4:71–74. doi: 10.2165/00822942-200504010-00009. [DOI] [PubMed] [Google Scholar]
- 113.Cheek S, Zhang H, Grishin NV. Sequence and structure classification of kinases. J Mol Biol. 2002;320:855–881. doi: 10.1016/s0022-2836(02)00538-7. [DOI] [PubMed] [Google Scholar]
- 114.Panek J, Eidhammer I, Aasland R. A new method for identification of protein (sub)families in a set of proteins based on hydropathy distribution in proteins. Proteins. 2005;58:923–934. doi: 10.1002/prot.20356. [DOI] [PubMed] [Google Scholar]
- 115.Henrick K, Feng Z, Bluhm WF, Dimitropoulos D, Doreleijers JF, Dutta S, Flippen-Anderson JL, Ionides J, Kamada C, Krissinel E, Lawson CL, Markley JL, Nakamura H, Newman R, Shimizu Y, Swaminathan J, Velankar S, Ory J, Ulrich EL, Vranken W, Westbrook J, Yamashita R, Yang H, Young J, Yousufuddin M, Berman HM. Remediation of the protein data bank archive. Nucleic Acids Res. 2008;36:D426–D433. doi: 10.1093/nar/gkm937. [DOI] [PMC free article] [PubMed] [Google Scholar]
- 116.OCaml Available at: http://caml.inria.fr/ Accessed on 5 march 2010.
- 117.Higgins D, Gibson TJ, Thompson JD, Higgins DG, Gibson TJ. CLUSTAL W: improving the sensitivity of progressivemultiple sequence alignment through sequence weighting, position-specific gap penalties and weight matrix choice. Nucleic Acids Res. 1994;22:4673–4680. doi: 10.1093/nar/22.22.4673. [DOI] [PMC free article] [PubMed] [Google Scholar]
- 118.Lua ML. Available at: http://caml.inria.fr/cgi-bin/hump.en.cgi?contrib=321Accessed on 5 march 2010.
- 119.Ferre F, Ausiello G, Zanzoni A, Helmer-Citterich M. Functional annotation by identification of local surface similarities: a novel tool for structural genomics. BMC Bioinform. 2005;6:194. doi: 10.1186/1471-2105-6-194. [DOI] [PMC free article] [PubMed] [Google Scholar]