Abstract
Introduction
Our aim was to implement standards for quality assurance of IGRT devices used in our department and to compare their performances with that of a CT simulator.
Materials and methods
We investigated image quality parameters for three devices over a period of 16 months. A multislice CT was used as a benchmark and results related to noise, spatial resolution, low contrast visibility (LCV) and uniformity were compared with a cone beam CT (CBCT) at a linac and simulator.
Results
All devices performed well in terms of LCV and, in fact, exceeded vendor specifications. MTF was comparable between CT and linac CBCT. Integral nonuniformity was, on average, 0.002 for the CT and 0.006 for the linac CBCT. Uniformity, LCV and MTF varied depending on the protocols used for the linac CBCT. Contrast-to-noise ratio was an average of 51% higher for the CT than for the linac and simulator CBCT. No significant time trend was observed and tolerance limits were implemented.
Discussion
Reasonable differences in image quality between CT and CBCT were observed. Further research and development are necessary to increase image quality of commercially available CBCT devices in order for them to serve the needs for adaptive and/or online planning.
Keywords: IGRT, Quality assurance, Image quality, Long-term stability, CBCT
The main objective of recently developed image-guided radiotherapy (IGRT) in the treatment room was to increase the geometric accuracy of radiotherapy delivery by using soft tissue and volumetric anatomic imaging information [1–3]. Advanced radiotherapy techniques that apply higher conformality, such as intensity-modulated radiotherapy (IMRT) and stereotactic body radiotherapy (SBRT), use these imaging devices in order to manage both inter-fraction motion and intra-fraction motion. Most vendors of linear accelerators implemented tools for IGRT and so various systems are commercially available for online 2D/3D-imaging.
A cone beam computed tomography (CBCT) approach with a kV-source and a flat-panel detector mounted orthogonally to the MV beam is mostly used. The kV-system produces a high number of projections during gantry rotation. The principle was investigated by Siewerdsen and Jaffray [4,5] and implemented by several linac vendors (XVI™ from Elekta AB, Crawley, UK and OBI™ from Varian, Paolo Alto, CA). For the reconstruction of a series of 2D radiographs the Feldkamp algorithm is used [6]. In contrast to kV imaging the Tomotherapy™ device uses the MV-treatment beam, albeit with a reduced energy, for imaging [7,8]. Siemens developed a device which combines kV- and MV-CBCT with the linear accelerator [9,10].
For image-guided beam delivery, where for example reference structures from the CBCT are compared with the ones visible on the planning CT, good image quality is mandatory for manual or automatic registration. The radiation oncologist makes decisions which influence patient therapy based on those images. This makes it imperative that quality assurance of IGRT equipment is integrated into the quality management of a radiotherapy department [11–13]. Furthermore, new treatment concepts such as adaptive radiotherapy (ART) and online planning are heavily dependent on information acquired with IGRT equipment. For example, an offline protocol was developed by Nijkamp et al. [14] where CBCT of the first six fractions of prostate patients were used to calculate the mean position of the prostate and rectum to construct a new plan with reduced safety margins. The volume information generated by IGRT devices was used to define a target. Therefore, ART requires a special procedure to monitor the performance of image quality. The same applies to the concept of online planning as proposed by Létourneau et al. [15], which is based on imaging information from integrated CBCT devices.
Up to now, no standards for quality assurance of new IGRT technology have been set, but several institutions have recently reported their experiences [16–18]. It was our aim to implement such procedures at our institute. In addition we wanted to quantify the obvious differences in image quality as seen in our daily clinical routine depending on which system is used for the imaging of patients. Various image quality parameters of recently installed devices were compared with those of a typical multislice CT used for treatment planning. The CT acted as reference for the determination of all quantitative parameters. If image quality decreases with time, a reduction in positioning or registration accuracy can be expected. Therefore, assessment of the long-term stability of the investigated devices (CT and CBCT) was an integral part of this study.
Materials and methods
Imaging devices
CBCT at the linac
Measurements were performed with a CBCT, type XVI™ (Elekta AB, Crawley, UK) attached to a linear accelerator (Synergy™, Elekta AB, Crawley, UK). The detector-source distance was 153.6 cm. The imaging panel size was 41 × 41 cm2 and provided an image size of 1024 × 1024 with 16-bit pixel depth. The primary filtration of the X-ray tube was 3.6 mm Al equivalence. Presets and settings that were used for evaluating the image quality are summarised in Table 1. The amount of mA per frame as well as the time per frame was increased from low- to high-quality protocols. In addition, a different reconstruction algorithm with a higher resolution was used for the high-quality protocol. Therefore the reconstruction time was also increased. To enable a larger field of view (FoV) the detector was positioned off-center for the medium-quality protocol and we tried to determine any possible influence of this detector position on the results.
Table 1.
Settings used for the evaluation of the image quality of the CBCT at the linac and simulator as well as of CT.
| Reconstruction filter | kV | mA/ frame |
ms/ frame |
mAs | Arc (°) |
Clinical site | FOV (cm) |
Pixel dimensions in axial slice (mm) |
|
|---|---|---|---|---|---|---|---|---|---|
| CBCT linac Low quality (A) |
FDK algorithm with Wiener filter |
100 | 10 | 10 | 36 | 200 | Head and neck |
26 | 1 |
| Medium quality (B) | 120 | 25 | 40 | 650 | 360 | Pelvis | 42 | 1 | |
| Medium quality with bow-tie filter (C) |
120 | 40 | 40 | 1040 | 360 | Pelvis | 42 | 1 | |
| High quality (D) | 120 | 40 | 40 | 1040 | 360 | QA | 26 | 0.5 | |
| High quality with bow-tie filter (E) |
120 | 40 | 40 | 1040 | 360 | QA | 26 | 0.5 | |
| CBCT simulator | FDK algorithm with Wiener filter |
100 | 4.5 | 30 | 69 | 360 | Head | 27 | 0.5 |
| CT | H30s | 120 | 300 mAs | Head | 24 | 0.46 |
FDK – Feldkamp–Davis–Kress.
FOV – field of view.
QA – protocol used for quality assurance only.
To compensate for larger central patient thickness, a so-called bow-tie filter can be used in the XVI system to shape the kV beam. The bow-tie filter reduces the X-ray photon flux in the periphery of an object. The reduction of the dose to the periphery removes the most dominant contributor to the overall scatter. This should also result in improved photon flux homogeneity at the flat-panel detector and a more homogenous signal-to-noise ratio throughout the full field of view [19]. The influence of the bow-tie filter on image quality was evaluated for the medium- and high-quality protocols.
CBCT at the simulator
The second cone beam device that was considered in the study was a therapy simulator with a CBCT option (Simulix Evolution™, Nucletron, Veenendal, Netherland). The detector-source distance was 152 cm. The amorphous silicon detector size was 41 × 41 cm2 and it provided a resolution of 1024 × 1024, 16-bit. For CBCT acquisition the simulator used a wedge to balance the X-ray intensity on the detector, comparable to the bow-tie filter described in the previous paragraph. The FOV can vary from 15 cm to 47.5 cm. There are different scanning protocols available for CBCT mode, all applying 100 kV. In this study only one clinical protocol was used (see Table 1). The length of the FOV for this protocol was 20.4 cm with a diameter of 27 cm. For planar imaging, a scatter grid at the flat-panel imager was applied. In CBCT mode, which was mostly used, the grid was removed. Scatter correction in CBCT mode was performed by software.
Multislice CT (4 slices)
For benchmarking the CBCT devices, a “standard” multislice CT used for radiotherapy planning and CT simulation (Siemens Somatom Plus 4 Volume Zoom, Siemens, Erlangen, Germany) with an adaptive detector array was used. The detector consisted of elements of different sizes in the longitudinal direction. The inner four rows were used for 1 mm collimation, while rows located at the edge got symmetrically wider. For our quality assurance purposes, a spiral head protocol with 120 kV, 300 mAs, a collimation of 2 × 1 mm, a pitch 1, and a reconstruction FOV of 24 cm with 512 × 512 pixels were applied (see Table 1).
Phantoms
The Catphan 503 (The Phantom Laboratory, Salem, NY, US) was used for the evaluation of image quality (see Measurement and evaluation protocol). The phantom had a cylindrical shape with a diameter of 20 cm. It consisted of different inserts for evaluating the geometric accuracy with defined distances in axial and longitudinal directions, a section with uniform material and a density close to water for spatial uniformity determination, a section featuring a resolution pattern in an axial plane arranged cylindrically (1 through 21 line pairs per centimeter), and two point markers (tungsten-carbide bead, 0.28 mm diameter) embedded into a uniform material. In addition, a section with inserts of different densities such as polystyrene, low density polyethylene (LDPE), acrylic, air and Teflon was implemented for electron density to CT number conversion testing. The alignment marks on the surface of the phantom were used to position the phantom for each imaging device with the in-room laser system.
Measurement and evaluation protocol
The CatPhan phantom was scanned 10 times at intervals of 6– 7 weeks over a 16-month period on all three devices. The same imaging protocols were always used for each device. This was done to get a measure of the long-term stability of the devices in order to be able to implement routine check intervals and tolerance limits for the different parameters investigated. A period of more than one year was considered as sufficient to confirm the stability. Recalibration of the devices at least every 12 months is also recommended by the vendors.
The XVI-software (Elekta AB, Crawley, UK) was used for image evaluation and all imaging data from the simulator and the CT were transferred via a DICOM-interface to the XVI workstation. The slice with the tungsten beads in the phantom was exported to a DICOM server (e.g. treatment planning computer). The specific file was transferred to the data analysis unit. The modulation transfer function (MTF) as an indicator for spatial resolution was then calculated using a Matlab (The MathWorks, MA, US) tool.
Low contrast visibility (LCV)
Low contrast visibility (LCV) as a measure for soft tissue contrast was determined by using the polystyrene and the LDPE insert. LCV was determined according to the acceptance protocol of the linac vendor [20] as follows:
| (1) |
where
is the mean pixel value of a squared region of interest (0.16 cm2) inside the polystyrene insert,
is the mean pixel value of a squared region of interest (0.16 cm2) inside the LDPE insert,
σROI,p is the standard deviation of a squared region of interest (0.16 cm2) inside the polystyrene insert, and
σROI,l is the standard deviation of a squared region of interest (0.16 cm2) inside the LDPE insert.
According to Eq. (1), LCV becomes smaller with less noise present. The materials chosen for this type of evaluation were polystyrene with a mass density of 1.05 g/cm3 and LDPE with 0.92 g/cm3. Hence the smaller the LCV, the better one can differentiate between regions with small differences in density and pixel value, and a good contrast is present. If other inserts are chosen, the factor 2.75 must be changed according to the difference in CT numbers. For the evaluation, five locations in the above-mentioned inserts were selected and the mean ± 1 standard deviation (SD) of the LCV was calculated.
Modulation transfer function (MTF)
In order to specify spatial resolution in an observer-independent and highly reproducible manner, the calculation of the modulation transfer function (MTF) is the method of choice [21]. In summary, the MTF determines how the spatial frequencies, which make up an object, are transferred by the imaging system. For that purpose the tungsten-carbide bead inserts (diameter of 0.28 mm) in the phantom were used to extract a point spread function (PSF), from which a MTF can be generated by applying the fast Fourier transformation (FFT). MatLab was used to support this type of evaluation. As the bead is of subpixel size, it is not necessary to compensate for its size. The MTFs normalized to 1 at zero spatial frequency were reported at 50% (f50) and 10% (f10) signal modulation for each device.
Uniformity
The third parameter investigated was the spatial uniformity. First, we calculated the mean pixel value of a 1-cm square in the center of the uniformity probe as well as at three randomly selected peripheral locations (region of interest (ROI)). In order to evaluate uniformity, the integral nonuniformity was calculated according to the specifications of [17]:
| (2) |
where refers to the mean pixel value of the ROI with the highest value and refers to the mean pixel value of the ROI with the smallest value at the three peripheral positions in the uniformity probe.
The uniformity can also be described by the Uniformity Index (UI) as presented in [17]. It was defined by the maximum percentage difference between each of the peripheral areas and the central area:
| (3) |
In this case, the variables refer to the mean pixel values of the center ROI or the peripheral ROIs.
Image noise
A parameter indicating the noise is the so-called signal-to-noise ratio (SNR). It compares the level of a signal to the level of noise [10]:
| (4) |
where σROI,insert refers to the standard deviation and refers to the mean pixel value in a squared ROI (0.16 cm2) inside an insert of the LCV module of the phantom containing seven different inserts with varying density, and hence, varying CT numbers.
A further parameter used was the contrast-to-noise ratio (CNR) [10]:
| (5) |
where σROI,insert and σROI,background refer to the standard deviations and and refer to the mean pixel value in a squared ROI (0.16 cm2) inside an insert and the background of the LCV module of the phantom, respectively.
Results
Low contrast visibility (LCV)
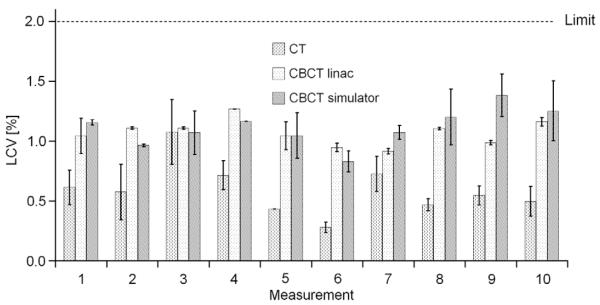
Fig. 1 shows the results of the LCV for the three devices over a 16-month period. The error bars represent the standard deviation (SD) for LCV calculated at five different locations in the insert.
Fig. 1.
Low contrast visibility (LCV) investigated over a period of 16 months for all three devices (10 measurements each for 6–7 weeks for each device). The error bars indicate the first standard deviation for the evaluation at five different locations in the inserts. Protocols used for the CT, CBCT at linac and simulator were head protocol, high-quality protocol without bow-tie filter (D) and the head protocol. The limit was set to 2% according to the specification of the linac vendor.
The imaging protocols used for the repeated measurements were the high-quality protocol for the CBCT at the linac and a head protocol at the simulator and at the CT. No time trend was observed and the LCV of all devices was below 2% [20], according to the specification of the linac vendor. As expected, superior results were obtained for the CT compared with both CBCTs. For the CT, the LCV was between 1.1% and 0.3%, with a mean of 0.6%. We derived tolerances based on these data (mean value plus 99% confidence interval), as shown in Table 2.
Table 2.
Tolerance limits for low contrast visibility (LCV), modulation transfer function (MTF), integral nonuniformity (IN) and contrast-to-noise ratio (CNR) for the LDPE insert calculated by the mean value plus or minus the 99% confidence interval (three times the standard deviation). For example, the mean value for LCV at the CBCT at the linac is 1.07% and the 99% confidence interval results in 0.31%, the tolerance for LCV for this device would be 1.38%. Depending on the parameter the lower or upper limit was used.
| Device | LCV (%) – upper limit | MTF f50 (lp/cm) – lower limit | MTF f10 (lp/cm) – lower limit | IN – upper limit | CNR – lower limit |
|---|---|---|---|---|---|
| CT | 1.24 | 2.45 | 4.28 | 0.005 | 29.8 |
| CBCT linac | 1.38 | 3.36 | 7.35 | 0.017 | 13.9 |
| CBCT simulator | 1.58 | 0.98 | 4.55 | – | 11.0 |
For comparison, we additionally made measurements for all different protocols used at the IGRT linac. The LCV for different imaging protocols is shown in Table 3. The worst results were obtained with the low-quality protocol. For this imaging protocol the LCV was 3% because of the low number of projections and reduced tube loading (mAs). Medium- and high-quality protocols showed very similar results without any significant impact using a bow-tie filter or not.
Table 3.
Low contrast visibility (LCV), integral nonuniformity (IN) and uniformity index (UI) for the CBCT at the linac using different protocols and the bow-tie filter. The protocols used were: A – low-quality protocol; B – medium-quality protocol; C – medium-quality protocol with bow-tie filter; D – high-quality protocol; E – high-quality protocol with bow-tie filter.
| Protocol | LCV (%) | IN | UI (%) |
|---|---|---|---|
| A | 3.0 | 0.007 | −0.36 |
| B | 1.7 | 0.031 | −4.46 |
| C | 1.4 | 0.068 | −6.01 |
| D | 1.1 | 0.006 | −0.63 |
| E | 1.3 | 0.004 | 0.62 |
Modulation transfer function (MTF)
The 3D spatial resolution showed comparable results for the three devices with slightly worse results for the simulator, see Fig. 2a. Employing the high-quality scan protocol for the CBCT at the linac provided good results, with f50 values of 4.43 ± 0.34 lp/cm (mean ± 1SD) and f10 of 8.49 ± 0.37 lp/cm. For the CT, the results were f50 = 4.31 ± 0.62 lp/cm and f10 = 8.60 ± 1.44 lp/cm. Corresponding results for the simulator CBCT were 3.01 ± 0.68 lp/cm for f50 and 6.71 ± 0.72 lp/cm for f10.
Fig. 2a.
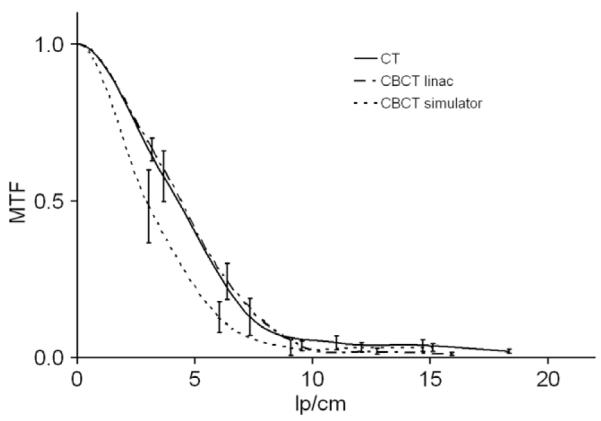
Modulation transfer function (MTF) for all three devices. The error bars indicate the variation (calculated with first standard deviation) obtained during a period of 16 months (10 measurements each for 6–7 weeks for each device). Protocols used for the CT, CBCT at linac and simulator were head protocol, high-quality protocol without bow-tie filter (D) and the head protocol
For image quality QA of the CBCT at the linac, the vendor suggested the high-quality protocol using a high-resolution reconstruction algorithm. However, this mode cannot be used in clinical situations because of the high mA per frame and low reconstruction speed. Therefore we repeated these measurements with the clinically used medium-quality protocol. These results were worse, as expected, even when compared to the ones obtained with the CBCT at the simulator. A representation of the MTF for different protocols can be seen in Fig. 2b. The respective values for f50 and f10 are 1.25 and 4.43 for protocol B and 4.25 and 7.89 for protocol E. CT spatial resolution is comparable with the high-quality protocol of the linac but when clinically used protocols (e.g. B) were used, CT proved superior. Regarding temporal stability no time trend could be observed. Again, we derived tolerances based on these data (see Table 2). The low tolerance limit for the CT at f10 was caused by a high standard deviation.
Fig. 2b.
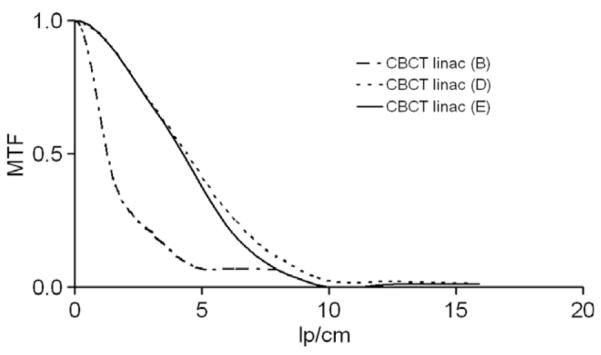
Modulation transfer function (MTF) for three different protocols at the CBCT of the linac. The protocols used were: B – medium-quality protocol; D – high-quality protocol; E – high-quality protocol with bow-tie filter.
Uniformity
Results related to the uniformity are shown in Fig. 3. The variations in the uniformity measurements for the simulator over the evaluation period were quite high because of the application of an incorrect, inherent software scatter correction algorithm. The long-term stability results of the simulator were therefore not representative and have been excluded from Fig. 3. After choosing a correct scatter correction algorithm, the uniformity of the CBCT at the simulator was almost identical to the CT results. The scan protocols used were high-quality for the linac and head protocol for the CT. Neither of the two devices showed any significant temporal variation. Estimated tolerance limits are shown in Table 2, and for comparison, Table 3 shows the influence of the protocols used for the CBCT at the linac. It can be seen that the bow-tie filter had an unexpectedly negative impact on the uniformity for the medium-quality protocol. This was not the case for the high-quality protocol when used with the bow-tie filter.
Fig. 3.
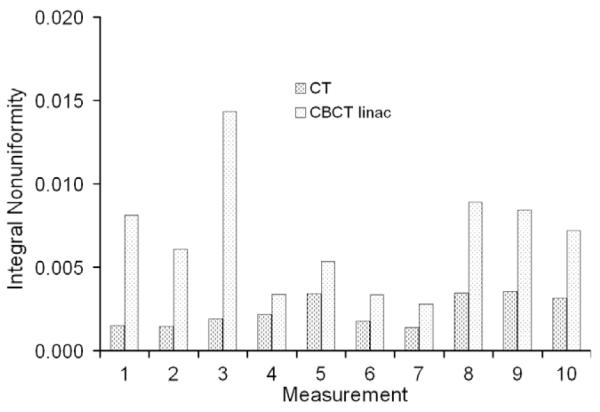
Integral nonuniformity investigated for two devices over a period of 16 months (10 measurements each for 6–7 weeks for each device). Protocols used for the CT and CBCT at linac were head protocol and high-quality protocol without bow-tie filter (D).
Results related to the uniformity index are shown in Fig. 4 and Table 3. Again, worse results were observed for protocols B and C. In both protocols, ring artifacts were identified which did not disappear after a re-calibration of the system. In most cases, capping (indicated by a negative uniformity index), and not cupping, was observed for the two devices.
Fig. 4.
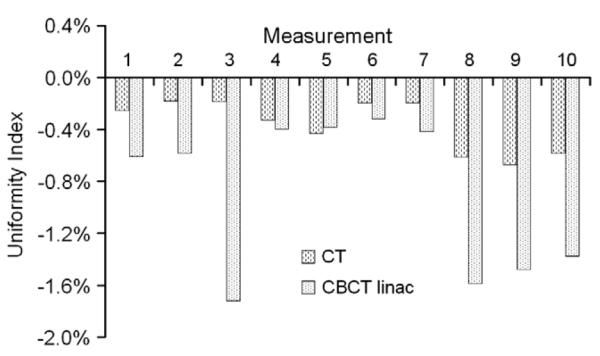
Uniformity Index (UI) for two devices over a period of 16 months (10 measurements each for 6–7 weeks for each device). Protocols used for the CT and CBCT at linac were head protocol and high-quality protocol without bow-tie filter (D).
Again, CT performed better than the CBCT device. The uniformity of CBCTs is influenced by the known artifacts resulting from scatter, beam hardening, and detector nonlinearity [15].
Image noise
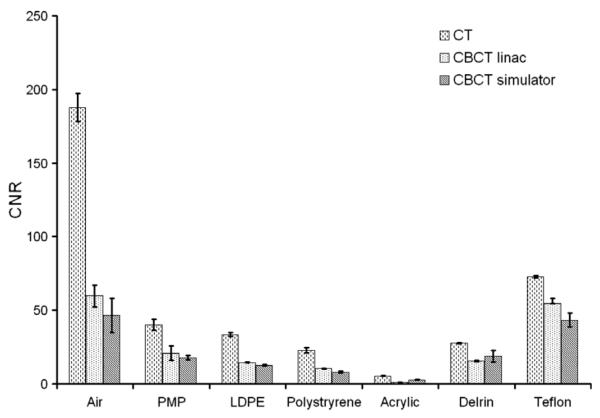
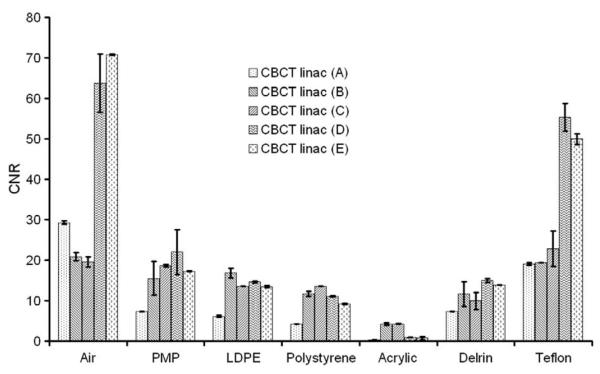
The CT also performed better here than the CBCT. The CNRs for the different density inserts and all devices are displayed in Fig. 5 when applying the head protocols for the CT and for the simulator, and the high-quality protocol for the linac. Signal-to-noise ratio was, on average, 26% less for the linac CBCT and 25% less for the simulator CBCT compared with the multislice CT for inserts with a density higher than air. Results for different protocols of the CBCT at the linac in terms of CNR can be seen in Fig. 6. The measurements were performed at three different locations in the insert. Contrast-to-noise ratios were on average 51.1% and 50.5% higher for the CT compared to linac and simulator CBCT for inserts with a density higher than air, respectively. No time trend was observed for the CNR and SNR. Tolerance limits related only to the LDPE insert as an indicator are shown in Table 2.
Fig. 5.
Contrast-to-noise ratio (CNR) for the different materials with increasing density inserts scanned with CBCT and CT. The error bars indicate deviations observed during the 16-month period (10 measurements each for 6–7 weeks for each device). Protocols used for the CT, CBCT at linac and simulator were head protocol, high-quality protocol without bow-tie filter (D) and the head protocol.
Fig. 6.
Contrast-to-noise ratio (CNR) for the CBCT at the linac using different protocols and the bow-tie filter. The protocols used were: A – low-quality protocol; B – medium-quality protocol; C – medium-quality protocol with bow-tie filter; D – high-quality protocol; E – high-quality protocol with bow-tie filter. The error bars indicate the standard deviation for the three different locations of ROIs.
Discussion
Quality measures were applied to quantitatively define technical image quality and tolerance limits for our recently installed IGRT devices. We compared these with a standard CT simulator. Due to the inherent imaging geometry of CBCT technology, the imaging quality is inferior compared to CT devices and our study explored differences in terms of LCV, uniformity, MTF and noise. After the determination of tolerance limits for each device, we performed sensitivity tests of our evidence-based QA limits. By altering some parameters in the imaging protocol D (e.g. decreasing mA or kV settings) for the CBCT at the linac, we simulated tube aging. Geometrical inaccuracies were simulated by using a flexmap from another linac CBCT (see Table 4). Most of the errors were detected by our tolerance limits. For example, the drop of the tube output from 40 mA per frame to 20 mA per frame or to low voltage ended up in a higher LCV as well as in lower uniformity. An increase in mA to 64 mA is not an error which would cause bad image quality and therefore this was not detected by the tolerance limits. If such an error would appear in clinical practice, it would lead to a higher imaging dose. The use of a bad pixel map from another detector caused lower uniformity and a slight increase in LCV. This error was not detected by the MTF limits as the bad pixels were not in the area of the CATphan phantom where the MTF is evaluated. The implementation of a flexmap from another device decreased the spatial resolution which, in turn, was detected by all our tolerance limits. A multilevel gain calibration used from another device did not have that much of an impact maybe because both devices were quite similarly calibrated. The misaligned tube in longitudinal direction was on the border of detection. Perhaps a misalignment perpendicular to the rotation axis would have had a more significant impact, especially on the MTF.
Table 4.
Sensitivity tests with different errors implemented in protocol D for the CBCT at the linac. Cursive values are beyond our tolerance limits and could therefore detect deviations correctly
| Altered parameter in protocol D | LCV (%) | IN | MTF f50 (lp/cm) | MTF f10 (lp/cm) |
|---|---|---|---|---|
| 80 kV instead of 120 kV | 2.35 | 0.028 | 3.9 | 7.6 |
| 100 kV instead of 120 kV | 1.85 | 0.025 | 4.5 | 8.6 |
| 20 mA per frame instead of 40 mA | 2.32 | 0.023 | 4.2 | 8.2 |
| 64 mA per frame instead of 40 mA | 1.09 | 0.015 | 4.8 | 8.9 |
| Implementation of flexmap from another device | 1.70 | 0.021 | 1.8 | 4.8 |
| Multilevel gain calibration from another device | 1.20 | 0.020 | 4.3 | 8.4 |
| Implementation bad pixel map correction from another device | 1.42 | 0.017 | 4.1 | 8.0 |
| Misaligned tube in longitudinal axis by 10 pixels | 1.36 | 0.021 | 4.5 | 7.4 |
Ongoing developments in software and hardware (e.g. bow-tie filter, scatter grids, and nonlinear scatter correction algorithms) [10,15] should further improve image quality of CBCT devices and therefore balance the adverse imaging geometry, such as large X-ray-source to patient distance and increased scatter to primary signal ratio. The behaviour of the bow-tie filter and its impact on the uniformity was unexpected for the medium-quality protocol of the CBCT at the linac and will be further investigated. Algorithms detecting and removing ring artifacts will be of great interest in the near future and can improve image quality by suppressing systematic imaging deficiencies.
When defining QA protocols for a particular imaging device or when comparing different devices, special attention must be paid to scanning protocols. This becomes even more important when comparing between very different beam qualities [10]. For instance, the high-quality protocol for the CBCT at the linac, as suggested by the vendor for image quality assessment, does not reflect the clinically recommended scan protocols. It uses a reconstruction algorithm with a much higher resolution (as seen in the evaluation of the MTF) and a high tube loading (mAs). In daily clinical practice such a scan protocol would result in rather long reconstruction times and unnecessary high patient dose from imaging (approximately 30 times more dose than low-quality protocol). In addition, the FoV would be too small for IGRT applications in the pelvic region. Degraded image quality of clinically used protocols in terms of LCV, CNR (protocol A), uniformity (protocol B, C) and MTF (protocol B) were pointed out. The mAs settings, and as a result the imaging dose too, were substantially different between the devices and also between the different protocols for the linac (as can be seen in Table 1). This has to be taken into account when comparing these results to other literatures.
The long-term stability of the devices during the evaluation period was promising. Based on the presented results we evaluate image quality parameters every 3–6 months. This can be combined with regular checks of the linear accelerator and performing these image quality tests does not require an excessive amount of time. We will take the calculated tolerance limits into account in our ongoing QA. Wherever possible an observer-independent analysis is preferred, such as in MTF determination for specifying spatial resolution. Furthermore it is important to be aware that any visual test is influenced, for example, by the window settings which might compromise reproducibility of results. For this reason no visual tests were included in this study.
Quantifiable parameters based on phantom measurements were applied for image quality assessment in IGRT imaging modalities. However imaging of patients is largely influenced by additional parameters that can deteriorate image quality, such as motion and streak artifacts or ghosting. Therefore, it is difficult to draw direct conclusions concerning image quality of patient data from results presented in this study. Nevertheless, if IGRT devices are used for adaptive radiotherapy and online planning, special attention must be paid to image quality and the ongoing, regular checking of imaging equipment.
Conclusion
Clear differences between the devices (Multislice CT, CBCT at linac and simulator) were found in terms of image quality parameters. A CT simulator has still better characteristics and further research in software and hardware is necessary to improve CBCT devices with respect to image quality, which is highly desirable for adaptive radiotherapy and online planning. The determined tolerance limits are sensitive to variations in the long-term performance and can help to detect errors as shown by our analysis.
Acknowledgements
The study was partly supported by the Austrian Science foundation FWF Projects P19931, L503 and OeNB Project No. 12972. We wish to thank Neil Dodd and Johannes Hopfgartner for their contribution during the implementation of the sensitivity tests.
References
- [1].Oldham M, Létourneau D, Watt L, et al. Cone-beam-CT guided radiation therapy: a model for on-line application. Radiother Oncol. 2005;75:271–8. doi: 10.1016/j.radonc.2005.03.026. [DOI] [PubMed] [Google Scholar]
- [2].Létourneau D, Martinez AA, Lockman D, et al. Assessment of residual error for online cone-beam CT-guided treatment of prostate cancer patients. Int J Radiat Oncol Biol Phys. 2005;62:1239–46. doi: 10.1016/j.ijrobp.2005.03.035. [DOI] [PubMed] [Google Scholar]
- [3].Smitsmans MH, de Bois J, Sonke JJ, et al. Automatic prostate localization on cone-beam CT scans for high precision image-guided radiotherapy. Int J Radiat Oncol Biol Phys. 2005;63:975–84. doi: 10.1016/j.ijrobp.2005.07.973. [DOI] [PubMed] [Google Scholar]
- [4].Jaffray DA, Drake DG, Moreau M, et al. A radiographic and tomographic imaging system integrated into a medical linear accelerator for localization of bone and soft-tissue targets. Int J Radiat Oncol Biol Phys. 1999;45:773–89. doi: 10.1016/s0360-3016(99)00118-2. [DOI] [PubMed] [Google Scholar]
- [5].Siewerdsen JH, Jaffray DA. Cone-beam computed tomography with a flat-panel imager: effects of image lag. Med Phys. 1999;26:2635–47. doi: 10.1118/1.598803. [DOI] [PubMed] [Google Scholar]
- [6].Feldkamp LA, Davis LC, Kress JW. Practical cone-beam algorithm. J Opt Soc Am A. 1984;1:612–9. [Google Scholar]
- [7].Mackie TR, Kapatoes J, Ruchala K, et al. Image guidance for precise conformal radiotherapy. Int J Radiat Oncol Biol Phys. 2003;56:89–105. doi: 10.1016/s0360-3016(03)00090-7. [DOI] [PubMed] [Google Scholar]
- [8].Meeks SL, Harmon JF, Jr, Langen KM, et al. Performance characterization of megavoltage computed tomography imaging on a helical tomotherapy unit. Med Phys. 2005;32:2673–81. doi: 10.1118/1.1990289. [DOI] [PubMed] [Google Scholar]
- [9].Oelfke U, Tücking T, Nill S, et al. Linac-integrated kV-cone beam CT: technical features and first applications. Med Dosim. 2006;31:62–70. doi: 10.1016/j.meddos.2005.12.008. [DOI] [PubMed] [Google Scholar]
- [10].Stützel J, Oelfke U, Nill S. A quantitative image quality comparison of four different image guided radiotherapy devices. Radiother Oncol. 2008;86:20–4. doi: 10.1016/j.radonc.2007.10.035. [DOI] [PubMed] [Google Scholar]
- [11].Sharpe M, Brock KK. Quality assurance of serial 3D image registration, fusion, and segmentation. Int J Radiat Oncol Biol Phys. 2008;71:33–7. doi: 10.1016/j.ijrobp.2007.06.087. [DOI] [PubMed] [Google Scholar]
- [12].Balter JM, Antonuk LE. Quality assurance for kilo- and megavoltage in-room imaging and localization for off- and online setup error correction. Int J Radiat Oncol Biol Phys. 2008;71:48–52. doi: 10.1016/j.ijrobp.2007.06.080. [DOI] [PMC free article] [PubMed] [Google Scholar]
- [13].Saw CB, Yang Y, Li F, et al. Performance characteristics and quality assurance aspects of kilovoltage cone-beam CT on medical linear accelerator. Med Dosim. 2007;32:80–5. doi: 10.1016/j.meddos.2007.01.003. [DOI] [PubMed] [Google Scholar]
- [14].Nijkamp J, Pos FJ, Nuver TT, et al. Adaptive radiotherapy for prostate cancer using kilovoltage cone-beam computed tomography: first clinical results. Int J Radiat Oncol Biol Phys. 2008;70:75–82. doi: 10.1016/j.ijrobp.2007.05.046. [DOI] [PubMed] [Google Scholar]
- [15].Létourneau D, Wong R, Moseley D, et al. Online planning and delivery technique for radiotherapy of spinal metastases using cone-beam CT: image quality and system performance. Int J Radiat Oncol Biol Phys. 2007;67:1229–37. doi: 10.1016/j.ijrobp.2006.09.058. [DOI] [PubMed] [Google Scholar]
- [16].Yoo S, Kim GY, Jr, Hammoud R, et al. A quality assurance program for the on-board imager®. Med Phys. 2006;33:4431–47. doi: 10.1118/1.2362872. [DOI] [PubMed] [Google Scholar]
- [17].Bissonnette JP, Moseley DJ, Jaffray D. A quality assurance program for image quality of cone-beam CT guidance in radiation therapy. Med Phys. 2008;35:1807–15. doi: 10.1118/1.2900110. [DOI] [PubMed] [Google Scholar]
- [18].Sykes JR, Lindsay R, Dean CJ, et al. Measurement of cone beam CT coincidence with megavoltage isocentre and image sharpness using the QUASAR Penta-Guide pantom. Phys Med Biol. 2008;53:5275–93. doi: 10.1088/0031-9155/53/19/002. [DOI] [PubMed] [Google Scholar]
- [19].Mail N, Moseley DJ, Siewerdsen JH, et al. The influence of bowtie filtration on cone-beam CT image quality. Med Phys. 2009;36:22–32. doi: 10.1118/1.3017470. [DOI] [PubMed] [Google Scholar]
- [20].Lehmann J, Perks J, Semon S, et al. Commissioning experience with cone-beam computed tomography for image-guided radiation therapy. J Appl Clin Med Phys. 2007;8:21–36. doi: 10.1120/jacmp.v8i3.2354. [DOI] [PMC free article] [PubMed] [Google Scholar]
- [21].White DR, Speller RD, Taylor PM. Evaluating performance characteristics in computerized tomography. Br J Radiol. 1981;54:221–31. doi: 10.1259/0007-1285-54-639-221. [DOI] [PubMed] [Google Scholar]


