Abstract
Previous experiments on behavioral momentum have shown that relative resistance to extinction of operant behavior in the presence of a discriminative stimulus depends upon the baseline rate or magnitude of reinforcement associated with that stimulus (i.e., the Pavlovian stimulus-reinforcer relation). Recently, we have shown that relapse of operant behavior in reinstatement, resurgence, and context renewal preparations also is a function of baseline stimulus-reinforcer relations. In this paper we present new data examining the role of baseline stimulus-reinforcer relations on resistance to extinction and relapse using a variety of baseline training conditions and relapse operations. Furthermore, we evaluate the adequacy of a behavioral-momentum based model in accounting for the results. The model suggests that relapse occurs as a result of a decrease in the disruptive impact of extinction precipitated by a change in circumstances associated with extinction, and that the degree of relapse is a function of the pre-extinction baseline Pavlovian stimulus-reinforcer relation. Across experiments, relative resistance to extinction and relapse were greater in the presence of stimuli associated with more favorable conditions of reinforcement and were positively related to one another. In addition, the model did a good job in accounting for these effects. Thus, behavioral momentum theory may provide a useful quantitative approach for characterizing how differential reinforcement conditions contribute to relapse of operant behavior.
Keywords: behavioral momentum theory, resistance to change, extinction, relapse, reinstatement, resurgence, context renewal, priming, review
1. Introduction
Preclinical researchers use animal models to delineate biological and environmental factors contributing to the persistence of behavior (see Boulougouris et al., 2009; Stafford et al., 1998). Behavioral momentum theory provides a framework from which to understand how relations between environmental stimulus contexts and reinforcement impact the persistence of operant behavior. According to behavioral momentum theory, persistence is defined as the resistance to change of discriminated operant behavior when disrupted by extinction or some other operation (Nevin and Grace, 2000). Decreases in response rates relative to pre-disruption response rates (i.e., proportion of baseline) provide a measure of resistance to change. Responses that decrease less relative to baseline rates are considered more resistant to change or possessing greater response strength. When resistance to change is assessed across two discriminative stimuli that alternate within an experimental session (i.e., multiple schedules), responses maintained by higher rates or larger magnitudes of reinforcement typically are more resistant to change (see Nevin, 1992).
According to behavioral momentum theory, resistance to change and response rates are separable aspects of operant behavior. Response rates are governed by the operant contingency between responding and reinforcement (i.e., response-reinforcer relation; Herrnstein, 1970). Resistance to change, on the other hand, is governed by the Pavlovian relation between discriminative stimuli and reinforcement obtained in the presence of those stimuli (i.e., stimulus-reinforcer relation). The relation between relative resistance to change across two discriminative-stimulus contexts and the relative rates of reinforcement arranged in the presence of those stimuli is described by a power function (Nevin, 1992):
| (1) |
in which m1 and m2 are relative resistance to changes in the presence of stimuli 1 and 2; r1 and r2 are the relative rates of reinforcement delivered in the presence of those stimuli. The parameter b reflects sensitivity of relative resistance to change to variations in the ratio of reinforcement rates.
Nevin et al. (1990) showed that the response-reinforcer and stimulus-reinforcer relations separately control response rates and resistance to change, respectively. In two components of a multiple schedule, equal rates of response-dependent food reinforcement were presented on variable-interval (VI) 60-s schedules with pigeons as experimental subjects. Response-independent food was added to one component on a variable-time (VT) 30-s or 15-s schedule. The added food weakened the response-reinforcer relation thereby resulting in lower response rates in that component. The added food also strengthened the stimulus-reinforcer relation, resulting in greater resistance to extinction and satiation in the component with added food. Therefore, it is not necessary for reinforcers presented in the presence of discriminative stimuli (right-hand side of Equation 1) to be contingent on responding to affect relative resistance to change. More generally, these findings suggest that Pavlovian stimulus-reinforcer relations govern the persistence of operant behavior as measured by resistance to change (see Podlesnik and Shahan, 2008, for a discussion of exceptions). These findings have been replicated in similar experiments using a variety of responses, reinforcers, and species ranging from fish to humans (Ahearn et al., 2003; Cohen 1996; Grimes and Shull 2001; Harper, 1999; Igaki and Sakagami, 2004; Mace et al., 1990; Shahan and Burke, 2004).
Nevin et al. (1990) suggested that the role of stimulus-reinforcer relations in resistance to change is consistent with incentive-motivational theories of operant behavior (e.g., Rescorla and Solomon, 1967; Bindra, 1972). Incentive-motivational accounts are two-process theories suggesting that stimuli signaling the presence of reinforcement come to motivate operant behavior. In addition to persistence, relapse (as defined as the reappearance of behavior after extinction) also might be a function of incentive-motivational processes (e.g., Stewart et al., 1984; Robinson and Berridge, 1993). Understanding whether common processes underlie persistence and relapse is important because both are defining features of addictive and compulsive behavior (see Winger et al., 2005).
Various animal models have been used to elucidate variables influencing relapse1 of operant behavior following extinction (Crombag et al., 2008; Katz and Higgins, 2003, for reviews). For example, in the most common procedure used to examine relapse, reinstatement, reinforcers or reinforcer-associated stimuli are presented response independently during extinction to produce an increase in extinguished behavior (e.g., Reid, 1957; Stewart & de Wit, 1981). In the resurgence model of relapse, extinguishing a recently reinforced response results in the reoccurrence of an extinguished response that had been reinforced previously (e.g., Epstein, 1996; Podlesnik et al., 2006). Finally, in context renewal designs, responding is initially reinforced the presence of one set of environmental contextual stimuli (Context A) and then extinguished in a different context (Context B). When Context A is then presented again with extinction still in effect, responding increases (e.g., Crombag & Shaham, 2002; Nakajima et al., 2000). Although the specific details of these relapse models differ, it has been suggested that relapse in general occurs as a result of a change in conditions under which extinction of behavior takes place (e.g., Bouton, 2002; Bouton & Swartzentruber, 1991).
Converging evidence from studies of reinstatement and resistance to change support the suggestion that common processes might underlie resistance to change and relapse. Baker et al. (1991) showed that relapse of operant responding is modulated by the current incentive value of discriminative stimuli. During baseline, rats lever pressed for food reinforcement. Following extinction, food was presented response independently in the presence of the training stimulus context but in the absence of the lever. When the lever was re-introduced during the next session in the presence of the training stimulus context but in the absence of food, responding recovered to a greater extent in that group than in a different group not receiving stimulus context-food pairings. The response-independent food presentations in the presence of the training stimulus context is analogous to the added food reinforcement in the component producing greater resistance to change in Nevin et al. (1990). Thus, similar to the effects of stimulus-reinforcer relations in resistance to change, the findings of Baker et al. suggest that the current associative or incentive-motivational value of the training stimulus context modulates relapse of operant behavior.
2. Resistance to Change and Relapse
The aim of the experiments discussed below was to examine whether relapse, like resistance to change, is a function of Pavlovian stimulus-reinforcer relations using methodology consistent with previous research on behavioral momentum. Thus, two-component multiple schedules of reinforcement arranged different rates or magnitudes of reinforcement in the presence of distinctive stimuli. Following training with the baseline multiple schedule, resistance to extinction was assessed by eliminating food reinforcement in the presence of both stimuli. Extinction conditions were maintained until responding reached low rates in the presence of both stimuli. Finally, relapse was assessed using various methods previously shown to produce an increase in response rates (i.e., relapse) of the extinguished behavior.
2.1. Podlesnik and Shahan (2009)
Podlesnik and Shahan (2009) examined whether relapse is a function of baseline stimulus-reinforcer relations in a manner similar to relative resistance to change. In three experiments, pigeons’ baseline responding was maintained in two components of a multiple schedule by equal VI 120-s schedules of food reinforcement. Response-independent food was added to one component on a VT 20-s schedule. As in Nevin et al. (1990), baseline response rates were lower in the component with added food. Therefore, the added food likely degraded the response-reinforcer relation but enhanced the stimulus-reinforcer relation.
Next, responding was extinguished until response rates were below 10% of baseline in both components for individual subjects. In the final relapse conditions of each experiment, the extent to which responding relapsed in both components relative to baseline response rates was assessed. In Experiment 1, reinstatement was assessed across two conditions either by presenting two response-independent or two response-dependent food presentations during the first occurrence of each component. In Experiment 2, a second key was introduced to both components during extinction and pecking was reinforced on a VI 30-s schedule. Resurgence was examined by eliminating reinforcement for pecking the second key in both components and assessing the extent to which responding relapsed on the original keys in both components. In Experiment 3, context renewal was assessed by maintaining a steady houselight during baseline (Context A), flashing the houselight during extinction sessions (Context B), and then discontinuing the flashing of the houselight in the final condition (return to Context A) while extinction was still in effect.
In all three experiments, resistance to extinction was greater in the richer component with the added food presentations. These finding replicate previous work by Nevin et al. (1990) and others showing that responding is more resistant to disruption in the presence of a stimulus previously associated with additional response-independent reinforcers, despite the lower pre-disruption response rates in the presence of that stimulus. In addition, like resistance to extinction, relative relapse following extinction was greater in the richer component when responding recurred during reinstatement, resurgence, and renewal tests.
Based on the results above, Podlesnik and Shahan (2009) proposed that the augmented extinction model of behavioral momentum theory (Nevin and Grace, 2000) might be extended to capture the effects of baseline reinforcement rate on relapse of responding following extinction. The augmented model suggests that the disruption of responding produced by extinction may be characterized as:
| (2) |
where Bt is response rate at time t in extinction, Bo is response rate in baseline, c is the disruption produced by terminating the contingency between responses and reinforcers, d scales disruption from removal of reinforcers (i.e., generalization decrement), r is the rate of reinforcement in the presence of the stimulus in baseline, and b is sensitivity to reinforcement rate. Thus, Equation 2 suggests that, rather than resulting from unlearning, extinction of operant behavior reflects a disruption of ongoing behavior counteracted by the rate of reinforcement experienced in the pre-extinction baseline. Podlesnik and Shahan noted that the approach to extinction formalized in Equation 2 is conceptually similar to a common account of relapse phenomena also based on the fact that learning survives extinction (Bouton, 2004).
The model proposed by Podlesnik and Shahan (2009) suggests that relapse results when some change in circumstances produces a decrease in the magnitude of disruption during extinction such that:
| (3) |
where all terms are as in Equation 1. The added parameter m scales a reduction in the disruptive effects of contingency suspension (i.e., c) and generalization decrement (i.e., dr) associated with the relapse-producing event. Prior to the change in circumstances during extinction, m=1 and Equation 3 is the same as Equation 2. With the onset of the relapse-inducing event, m is less than 1 and responding increases because of a reduction in extinction-related disruption. As noted above, decreases in behavior produced by extinction are relatively specific to the stimulus conditions in which extinction occurs and relapse is produced by a change in those stimulus conditions (e.g., Bouton, 2002, 2004). Thus, m can be interpreted as scaling the reduction in extinction-related disruption produced by a change in stimulus conditions present during extinction. Furthermore, consistent with the suggestion that relapse depends upon the associative value of the context, Equation 3 predicts that response rates as a proportion of baseline during both extinction and relapse should be greater in the presence of a stimulus previously associated with a higher rate of reinforcement.
Podlesnik and Shahan (2009) showed that Equation 3 could produce predictions consistent with the data from their experiments, but they did not fit the model to their data because the subjects did not receive a consistent number of days of exposure to extinction. In what follows, we fit the model to the data of a subset of subjects that did receive the same number of extinction days in Podlesnik and Shahan and to other related datasets generated in our laboratory. For the fits, we will use a slightly modified version of the model proposed by Podlesnik and Shahan (2009). Equation 3 uses the parameter m to scale reduction in the disruptive effects of both contingency suspension (i.e., c) and generalization decrement associated with reinforcement removal (i.e., dr). Given that c and dr appear as separate disruptive factors in the model, it would be better to include separate factors for scaling reductions in those sources of disruption during relapse. A more appropriate model is:
| (4) |
where all terms are as in Equation 3, but m and n now separately scale relapse-inducing reductions in disruption associated with termination of the contingency and generalization decrement, respectively. When fitting the model to the datasets below, it became apparent that the parameter n could be set to 1 with little discernable impact, and thus was not needed. The reason is that, as is typical in most applications of the augmented model, the obtained values of d were quite small. Thus, further decreases in dr by n have little impact when reinforcement rates (i.e., r) are within the usual range used in behavioral momentum experiments. Nonetheless, we have included n in the general model because dr makes a substantial impact at very high reinforcement rates near those arranged by continuous reinforcement. In fact, it is dr that allows the augmented model to capture the disproportionate generalization decrement associated with the transition to extinction following continuous reinforcement, thus accounting for the partial reinforcement extinction effect (Nevin et al., 2001). In short, the n parameter might be necessary if Equation 4 is later used to model the effects of partial versus continuous reinforcement on relapse. Regardless, such high rates of reinforcement were not examined in the datasets modeled below. Thus, for the sake of simplicity, n was set to 1 for all the fits.
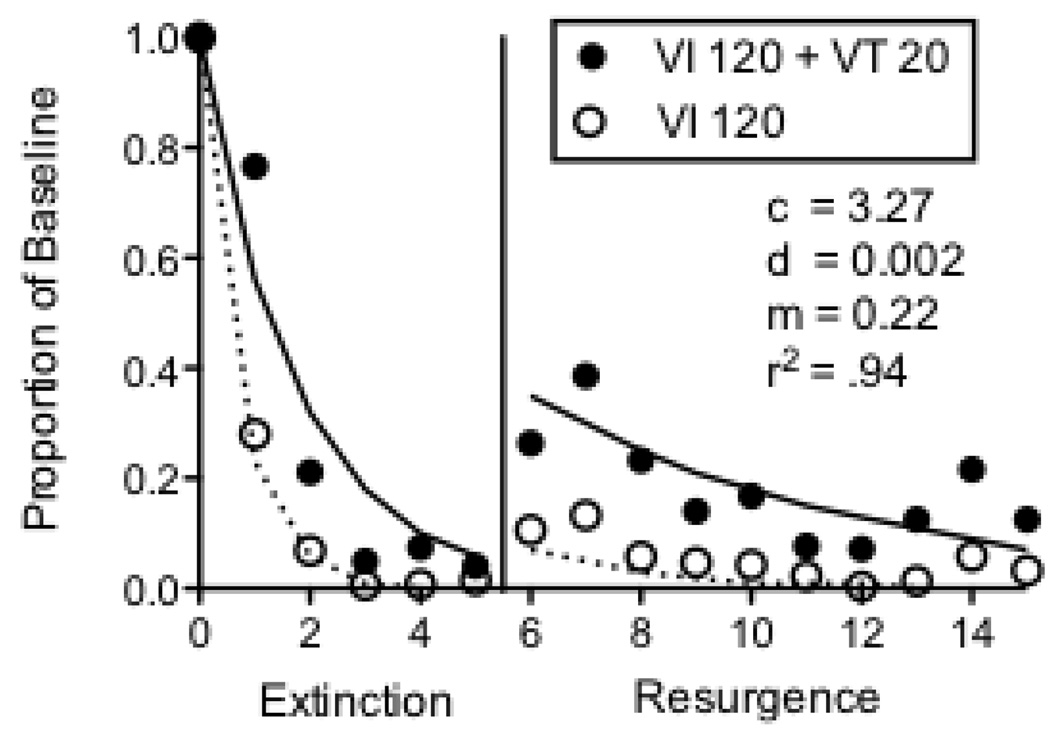
Figure 1 shows the fit of the model to the data of seven pigeons from Podlesnik and Shahan (2009) that experienced five sessions of extinction prior to ten sessions of a resurgence test. We use the exponentiated version of Equation 4 in order to allow fits to non-log transformed data and inclusion of zero-valued data points. With n=1, the fitted model is:
| (5) |
where all terms are as in Equation 4. For this and subsequent datasets, Equation 5 was fitted to the data for Rich and Lean components and extinction and relapse data simultaneously with shared values for all parameters. Food reinforcers per hour were used for the r terms in the two components. The value of the m parameter was 1 during extinction and assumed the fitted value during relapse sessions. Because the value of b is typically near 0.5 (Nevin, 2002), we have fixed it at that value for all fits. The fitted parameter values and variance accounted for are presented in the figure. The model accounts for 94% of the variance in the extinction and resurgence data for the seven pigeons from Podlesnik and Shahan. The obtained value for d is within the range of values obtained in applications of Equation 2 to extinction data (e.g., Nevin and Grace, 1999; Nevin et al., 2001). The obtained value for c is somewhat higher than in previous applications of the model to extinction, but the higher value likely reflects the impact of the availability of an alternative reinforcer during extinction prior to the resurgence test. Thus, Equation 5 appears to provide a good account of the effects of baseline reinforcement rate on post-extinction relapse produced in a resurgence paradigm.
Figure 1.
Proportion of baseline response rates across Extinction and Resurgence conditions for 7 pigeons exposed to 5 sessions of extinction in Podlesnik and Shahan (2009). The fitted lines and parameter valued were derived from Equation 5.
2.2. Extensions to New Datasets
The findings of Podlesnik and Shahan (2009) suggest that both resistance to change and relapse of discriminated operant behavior are a function of Pavlovian stimulus-reinforcer relations arranged during baseline training conditions. In what follows, we examine additional data from our laboratory extending this basic finding to different experimental species, baseline training conditions, and methods for examining relapse. Table 1 shows additional details of these experiments. Furthermore, we examine the utility of Equation 5 for describing the datasets.
Table 1.
Experiments appear in the order presented in text. Number of subjects (N), training sessions, and components per session are presented. Baseline schedules in Rich and Lean components were arranged using Fleshler and Hoffman (1962) interval progressions. Reinforcer magnitudes are presented in parentheses. All experiments arranged 60-s components with 30-s ITIs and used pigeons as experimental subjects unless otherwise noted. PS (2009) = Podlesnik and Shahan (2009).
| Experiment | N | training sessions | Baseline schedules |
components per session |
||
|---|---|---|---|---|---|---|
| Rich | Lean | |||||
| VI + VT | PS (2009) Reinstatement | 10 | 30 | VI 120 s (2 s) + VT 20 s (2 s) | VI 120 s (2 s) | 24 |
| PS (2009) Resurgence | 10 | 35 | VI 120 s (2 s) + VT 20 s (2 s) | VI 120 s (2 s) | 24 | |
| PS (2009) Renewal | 10 | 80 | VI 120 s (2 s) + VT 20 s (2 s) | VI 120 s (2 s) | 24 | |
| Resurgence (rat) | 4 | 40 | VI 45 s (1 pellet) + VT 15 s (1 pellet) | VI 45 s (1 pellet) | 40 | |
| Rate | Resurgence | 5 | 21 | VI 30 s (2 s) | VI 120 s (2 s) | 20 |
| Priming | 7 | 10 | VI 30 s (2 s) | VI 120 s (2 s) | 20 | |
| Magnitude | Resurgence | 10 | 10 | VI 60 s (4 s) | VI 60 s (1s) | 20 |
| Resurgence | 5 | 25 | VI 60 s (4 s) | VI 60 s (1 s) | 20 | |
| Resurgence | 5 | 40 | VI 120 s (2 s) + VT 30 s (4 s) | VI 120 s (2 s) + VT 30 s (1 s) | 20 | |
| Reinstatement | 5 | 21 | VI 120 s (2 s) + VT 30 s (4 s) | VI 120 s (2 s) + VT 30 s (1 s) | 20 | |
For all experiments, baseline response rates in Rich and Lean components are reported as a mean of six sessions prior to extinction for all experiments. Proportion of baseline measures, therefore, are calculated relative to these mean baseline measures. To streamline presentation of findings from experiments reported below, Table 2 shows statistical analyses comparing responding across Rich and Lean components as paired t tests for baseline conditions and two-way (component × session) repeated-measures ANOVAs for extinction and relapse conditions.
Table 2.
Statistical analyses comparing Rich and Lean component response measures for all experiments in the order they appear in the text. Baseline response rates are compared with paired t tests. Proportion of baseline response rates in Extinction and Relapse conditions compared with two-way (component × session) repeated-measures ANOVAs. Bold font indicates statistical significance with alpha set at .05.
| Extinction |
Relapse |
||||||
|---|---|---|---|---|---|---|---|
| Experiment | Baseline | Component | Session | Interaction | Component | Session | Interaction |
| Resurgence (rat) | t(3)=4.55 | F(1,3)=3.587 | F(11,33)=29.804 | F(11,33)=4.219 | F(1,3)=1.922 | F(14,42)=3.643 | F(14,42)=0.51 |
| p=.020 | p=.115 | p<.001 | p=.001 | p=.260 | p=.001 | p=.911 | |
| Resurgence (rate) | t(4)=4.141 | F(1,4)=4.704 | F(11,44)=16.443 | F(11,44)=1.412 | F(1,4)=17.164 | F(9,36)=1.705 | F(9,36)=0.826 |
| p=.014 | p=.096 | p<.001 | p=.201 | p=.014 | p=.124 | p=.597 | |
| Priming (rate) | t(6)=4.148 | F(1,6)=24.255 | F(20,120)=10.995 | F(20,120)=6.141 | F(1,6)=28.680 | F(4,24)=1.574 | F(4,24)=0.973 |
| p=.006 | p=.003 | p<.001 | p<.001 | p=.002 | p=.213 | p=.441 | |
| Resurgence (magnitude) | t(9)=5.320 | F(1,9)=9.753 | F(6,54)=12.483 | F(6,54)=2.992 | F(1,9)=18.531 | F(4,36)=1.430 | F(4,36)=0.570 |
| p=.001 | p=.012 | p<.001 | p=.013 | p=.002 | p=.244 | p=.686 | |
| Resurgence (magnitude) | t(4)=3.167 | F(1,4)=3.748 | F(11,44)=14.870 | F(11,44)=0.248 | F(1,4)=31.793 | F(9,36)=2.631 | F(9,36)=1.499 |
| p=.034 | p=.125 | p<.001 | p=.992 | p=.005 | p=.019 | p=.186 | |
| Resurgence (VT magnitude) | t(4)=2.149 | F(1,4)=3.491 | F(11,44)=8.931 | F(11,44)=2.605 | F(1,4)=3.491 | F(9,36)=1.401 | F(9,36)=1.427 |
| p=.098 | p=.135 | p<.001 | p=.012 | p=.135 | p=.224 | p=.213 | |
| Reinstatement (VT magnitude) | t(4)=1.441 | F(1,4)=154.308 | F(11,44)=19.673 | F(11,44)=4.987 | F(1,4)=8.187 | F(9,36)=2.774 | F(9,36)=0.318 |
| p=.223 | p<.001 | p<.001 | p<.001 | p=.046 | p=.014 | p=.964 | |
2.2.1. Species
Using baseline conditions similar to those of Podlesnik and Shahan (2009), we have also examined the effects of differences in the baseline stimulus-reinforcer relation on resurgence with rats. During baseline, single Noyes food pellets were presented on VI 45-s schedules of reinforcement for lever pressing in two components of a multiple schedule signaled by either a flashing houselight and pulsing tone or a constant houselight and constant tone. In one component, additional food pellets were presented on a VT 15-s schedule of reinforcement. Although variation between rats was large, response rates were significantly lower in the Rich component (Mean = 63.27, SEM = 25.50) than in the Lean component (Mean = 85.66, SEM = 25.18). Next, extinction began with the discontinuation of all baseline food presentations and a chain was dropped into the chamber through the center of the ceiling. Pulling the chain produced food pellets on VI 10-s schedules in both components. After 12 extinction sessions, the chain remained in the chamber but reinforcement for chain pulling was discontinued and responding on the levers in both components was assessed for 15 sessions.
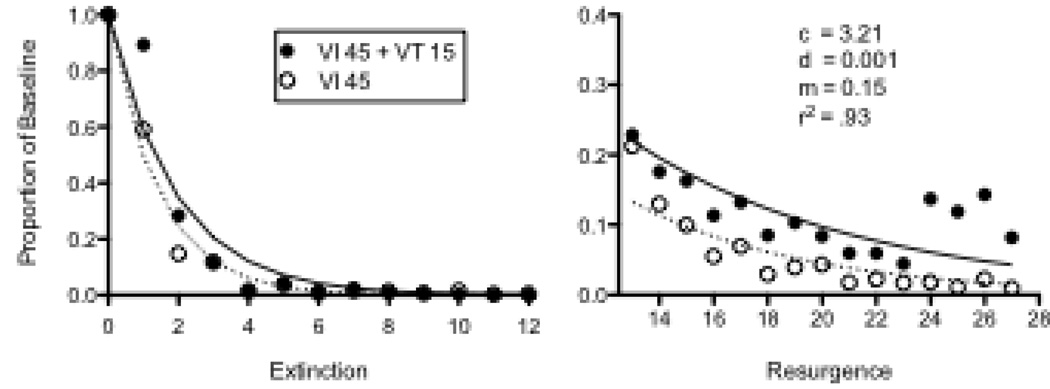
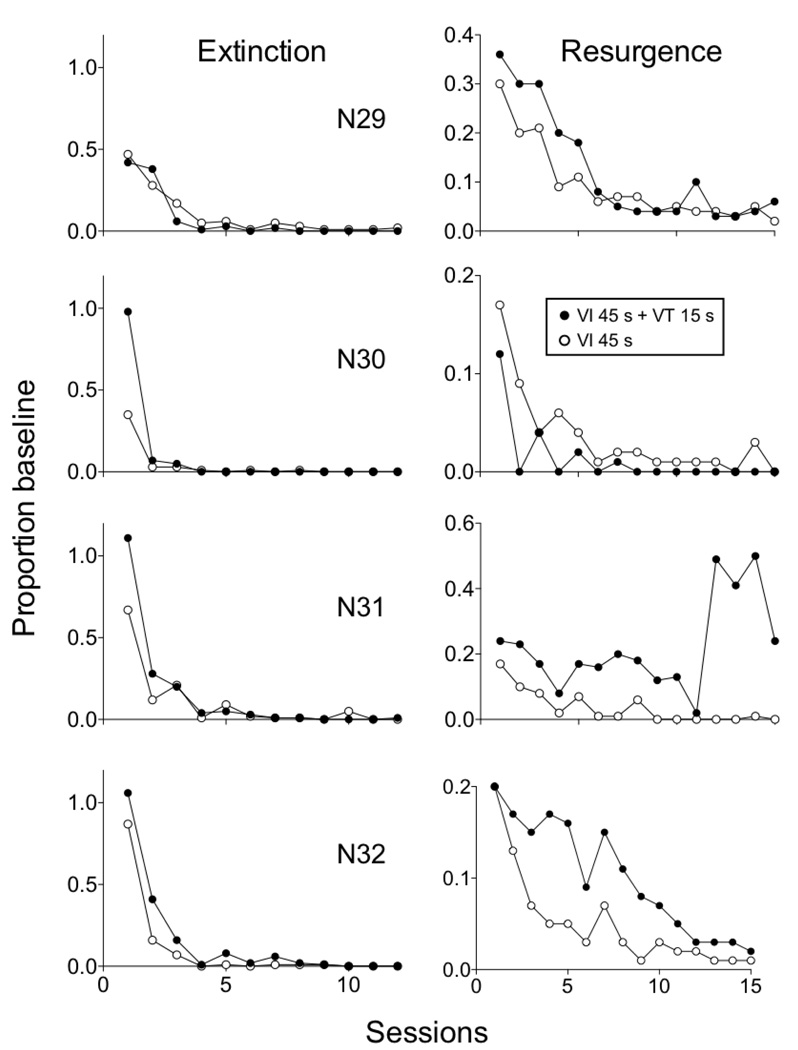
Figure 2 shows mean relative resistance to extinction in the left panel and resurgence in the right panel. Note that elevated levels of responding during the last 4 resurgence sessions were due to an abrupt increase in responding in one rat (see N31 in Figure 3). Equation 5 was fitted to the data and provided a good description of the obtained greater relative resistance to extinction and resurgence in the Rich than in the Lean component—accounting for 93% of the variance in the data. Obtained parameter values are presented in the figure and were comparable to fits obtained with data from pigeons above. Although a significant component × session interaction was obtained for extinction, the effect of component on resurgence did not reach statistical significance—likely as a result of the small number of rats used. Accordingly, Figure 3 shows extinction and resurgence data for individual rats. Responding was more resistant to extinction in the Rich component for 3 out of 4 rats, with the exception being N29. In the right panel, lever pressing resurged to a greater extent in the Rich component for 3 out of 4 rats, with N30 being the exception. Thus, the individual-subject data support the notion that relative resistance to change and resurgence tended to be greater in the Rich than in the Lean component, consistent with the predictions of Equation 5 and with the data from pigeons presented above.
Figure 2.
Proportion of baseline response rates in Extinction and Resurgence conditions in an experiment with rats arranging different rates of reinforcement by adding response-independent reinforcement to the Rich component. The fitted lines and parameter valued were derived from Equation 5. Note that y-axes differ in left and right panels.
Figure 3.
Proportion of baseline response rates in Extinction and Resurgence conditions in an experiment with rats arranging different rates of reinforcement by adding response-independent reinforcement to the Rich component. Data are shown for the individual rats contributing to the mean data in Figure 2.
2.2.2. Reinforcement rate
As noted above, the finding that added response-independent reinforcers enhance relative resistance to change has been replicated many times. Podlesnik and Shahan (2009) and the experiment with rats above extended this finding to relapse of operant behavior following extinction. Resistance to change also has been shown to be greater in components presenting higher rates of response-dependent reinforcement arranged with different variable- or random-interval schedules of reinforcement (e.g., Igaki and Sakagami, 2004; Jimenez-Gomez and Shahan, 2007; Nevin, 1974; Cohen, 1996). Unlike when response-independent food is presented in one component (e.g., Nevin et al., 1990; Podlesnik and Shahan, 2009), arranging different reinforcement rates with different VI schedules tends to confound relative reinforcement rates and relative response rates. It is important, however, to explore the effects of such baseline training on resistance to extinction and relapse given discrepancies in experimental findings and expert opinion on the matter. All things being equal, higher response rates tend to be less resistant to disruption than lower response rates (e.g., Lattal, 1989; Lattal et al., 1998; Nevin et al., 2001). Conversely, some suggest that relapse is positively impacted by relative baseline response rates and that response rates are better determiners of relapse than reinforcement rates (e.g., Doughty et al., 2004; Reed and Morgan, 2007). Moreover, Shalev et al. (2003) have suggested that training baseline conditions should not impact relapse given that all performance is compared to similarly low rates following extinction. The following two experiments with pigeons assessed relative resistance to extinction and relapse when different response-dependent reinforcement rates were examined across components. In both experiments, pigeons’ responding was maintained in a Rich component by a VI 30-s schedule and in a Lean component by a VI 120-s schedule of food reinforcement.
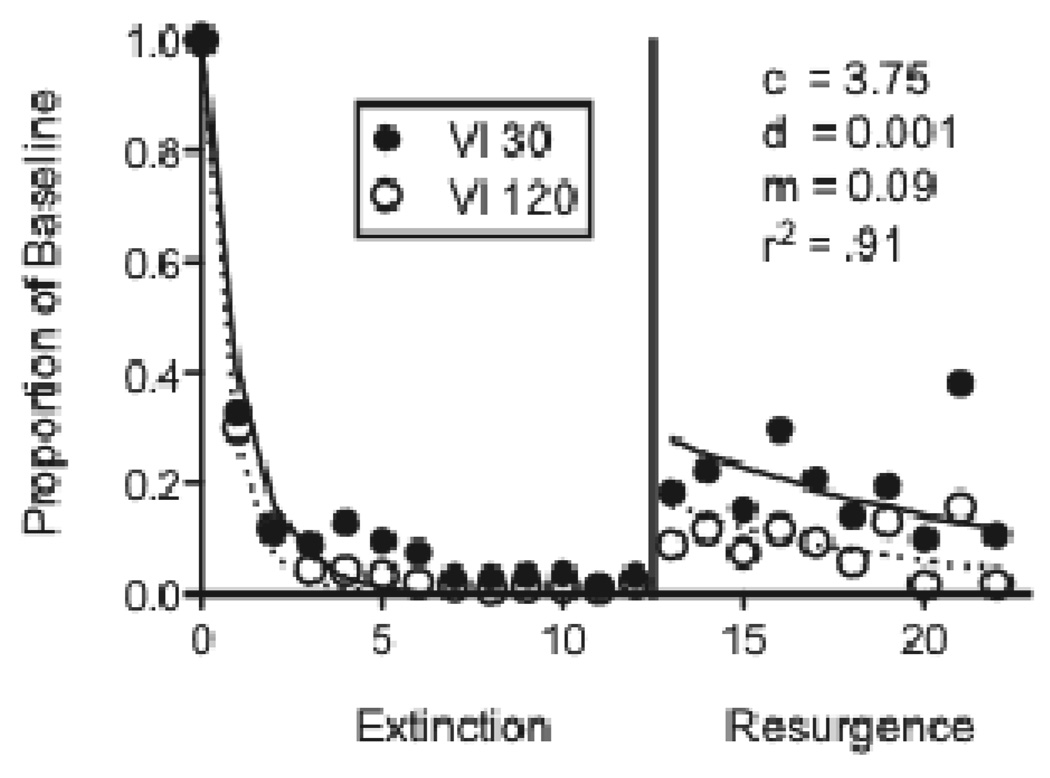
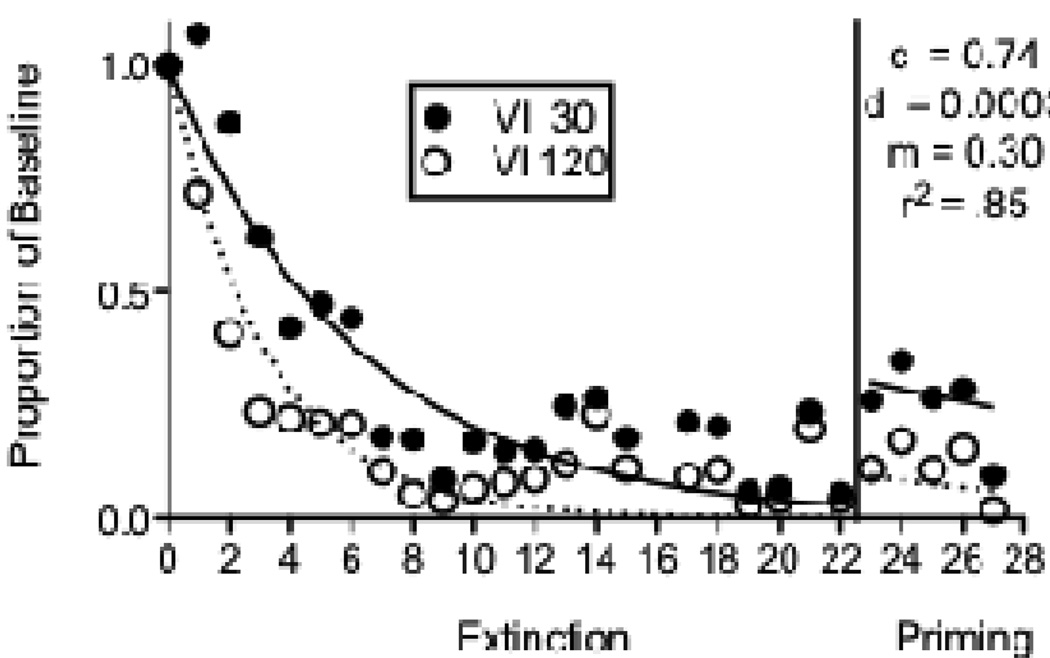
The first experiment used five pigeons in a resurgence procedure. Following baseline, responding (on the left key) was extinguished in both components while the right key was illuminated and pecks to it were reinforced on a VI 30-s schedule for 12 sessions. Finally, resurgence was examined by discontinuing reinforcement for responding on the right key in both components. As expected, baseline response rates were significantly higher in the Rich component (Mean = 83.03; SEM = 6.40) than in the Lean component (Mean = 68.20; SEM = 6.08). Figure 4 shows mean responding as a proportion of baseline response rates across the extinction and resurgence conditions. Equation 5 provided a good description of the data, accounting for 91% percent of variance in the data and capturing the fact that resurgence was greater in the Rich than in the Lean component. Obtained parameter values are presented in the figure and are comparable to those obtained in the fits above. Although relative resistance to extinction did not differ statistically for the Rich and Lean components, the individual data presented in Figure 5 show that resistance to extinction was greater in the Rich component than in the Lean component for 4 out of 5 pigeons (the exception was pigeon 221). The greater relative resurgence in the Rich than Lean component was consistent for all 5 pigeons and was statistically significant as evidenced by a main effect of component in the resurgence condition.
Figure 4.
Proportion of baseline response rates across Extinction and Resurgence conditions in an experiment with pigeons arranging different rates of response-dependent reinforcement during baseline. The fitted lines and parameter valued were derived from Equation 5.
Figure 5.
Proportion of baseline response rates across Extinction and Resurgence conditions in an experiment with pigeons arranging different rates of response-dependent reinforcement during baseline. Data are shown for the individual rats contributing to the mean data in Figure 4.
Seven pigeons were used in the second experiment arranging different reinforcement rates with VI 30-s (Rich) and VI 120-s (Lean) schedules across components of the multiple schedule. This experiment was conducted as a laboratory component of an undergraduate learning and behavior class at Utah State University. Throughout the experiment, a plastic bowl (approximately 12 cm diameter × 5 cm deep) was placed inside the chamber in a back corner opposite the intelligence panel. Following baseline, responding was extinguished by eliminating reinforcement for 21 consecutive sessions. Next, 10 g of food was placed in the bowl in the back of the chamber immediately prior to 5 consecutive sessions as a method for “priming” responding (see Terry, 1983). Once the pigeons were placed in the chamber with the 10 g of food, sessions were begun with extinction still in effect in both components. Baseline response rates were significantly greater in the Rich component (Mean = 81.76; SEM = 7.22) than in the Lean component (Mean = 63.80; SEM = 7.46). Figure 6 shows mean proportion of baseline response rates across extinction and priming conditions. Although there was a fair amount of variability in the extinction data, responding was more resistant to extinction in the Rich (VI 30 s) than in the Lean (VI 120 s) component as evidenced by a component × session interaction. In addition, although the priming effect was not large, relative responding in the resurgence condition was greater in the Rich than in the Lean component as evidenced by a main effect of component in that condition. Equation 5 described the data reasonably well, accounting for 85% of the variance. The value of c was lower than for the resurgence datasets above and more similar to prior applications of Equation 2 to extinction data. This outcome likely reflects the fact that the extinction condition did not include a reinforced alternative response, as was the case in the resurgence experiments.
Figure 6.
Proportion of baseline response rates across Extinction and Priming conditions in an experiment with pigeons arranging different rates of response-dependent reinforcement during baseline. The fitted lines and parameter valued were derived from Equation 5.
The findings from these resurgence and priming experiments with different VI schedules during baseline are consistent with those arranging additional free food in one component (e.g., Podlesnik and Shahan, 2009). These findings suggest that, like relative resistance to change, relapse is a function of baseline stimulus-reinforcer relations. Thus, baseline reinforcement conditions impact relative resistance to change and relapse, regardless of relative baseline response rates and whether reinforcers are presented contingent on responding or not.
2.2.3. Reinforcement magnitude
Differences in reinforcer magnitude also have been shown to impact relative resistance to disruption in a manner similar to differences in reinforcement rate (e.g., Nevin, 1974; Grace et al., 2002). To extend further the generality of the findings that stimulus-reinforcer relations influence both relative resistance to change and relapse, we examined the effects of different reinforcer magnitudes on resistance to extinction and relapse in four experiments with pigeons. Three experiments examined relapse using a resurgence procedure and one using a reinstatement procedure.
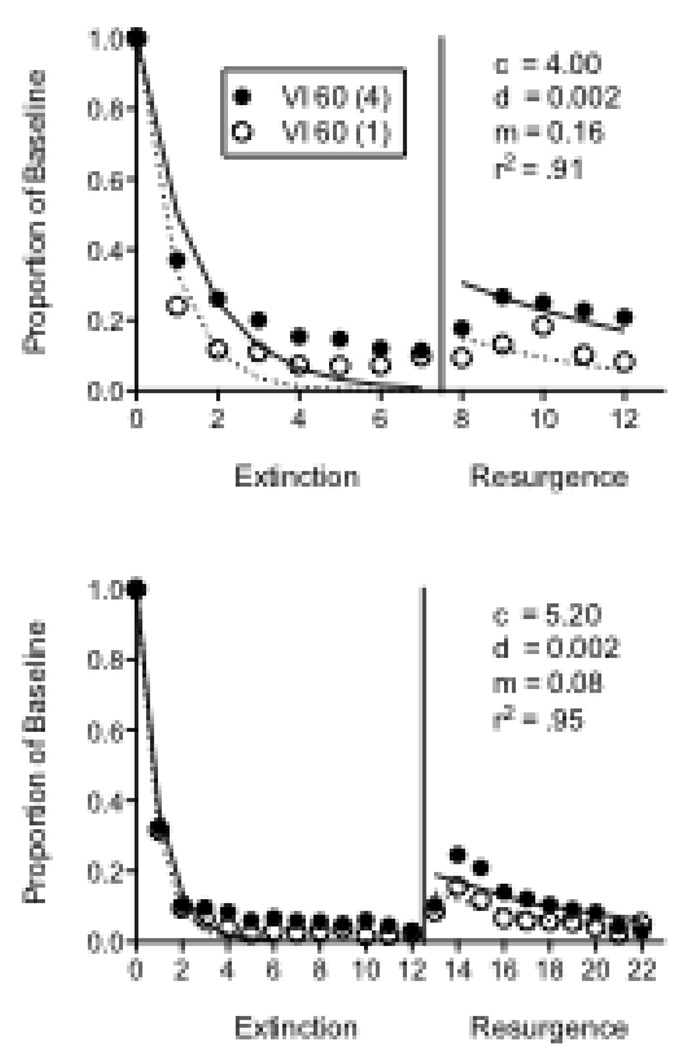
Like the priming experiment with different VI schedules above, one resurgence experiment was conducted as a laboratory component of an undergraduate learning and behavior class. Ten pigeons participated in this experiment, in which separate VI 60-s schedules were arranged on a left key across two components of a multiple schedule. Reinforcement consisted of 4 s of access to food in the Rich component and 1 s of access in the Lean component. Following baseline, extinction in both components commenced along with the illumination of the right key and reinforcement for keypecking on a VI 60-s schedule (2-s access to food in both components) for seven consecutive sessions. Finally, reinforcement for responding on the right key was discontinued in both components and resurgence of responding on the left keys in both components was assessed for 5 sessions.
Baseline response rates were significantly greater in the Rich component (Mean = 87.60; SEM = 4.84) than in the Lean component (Mean = 68.80; SEM = 6.43). The top panel of Figure 7 shows mean proportion of baseline response rates across the extinction and resurgence conditions. During extinction, responding was more resistant to change in the Rich than in the Lean component as evidenced by a significant component × session interaction. Furthermore, relative resurgence was greater in the Rich than the Lean component as evidenced by a main effect of component in the resurgence condition. To fit Equation 5 to the data, the reinforcer term (i.e., r) was multiplied by the number of seconds of hopper access provided by the component (i.e., either 1 s or 4 s). Equation 5 provided a good description of the data, accounting for 91% of the variance with obtained parameter values comparable to the fits to resurgence data above. These findings suggest that different reinforcement magnitudes impact both relative resistance to change and relapse similarly to situations in which different reinforcement rates are arranged across components (e.g., Podlesnik and Shahan, 2009).
Figure 7.
Proportion of baseline response rates across Extinction and Resurgence conditions in two experiments with pigeons arranging different magnitudes of response-dependent reinforcement during baseline. The fitted lines and parameter valued were derived from Equation 5.
The other resurgence experiment arranged different reinforcer magnitudes with 5 pigeons. In this experiment, the baseline schedules were identical to those described for the previous experiment with 4-s versus 1-s reinforcers across components. The differences were during extinction, when reinforcement of the alternative response was a VI 30-s schedule for 12 consecutive sessions and resurgence was assessed for 10 sessions. Baseline response rates were significantly greater in the Rich component (Mean = 96.08; SEM = 10.49) than in the Lean component (Mean = 34.41; SEM = 13.10). The bottom panel of Figure 7 shows mean relative resistance to change and resurgence in the Rich and Lean components. Although relative resistance to extinction did not differ for the two components, relative resurgence did, as evidenced by a main effect of component in the resurgence condition. Equation 5 accounted for 95% of the variance in the data with parameter values comparable to the other fits.
In the final two experiments examining the effects of reinforcer magnitude on resistance to extinction and relapse, resurgence was assessed in one experiment and reinstatement was assessed in the other (in that order) with the same 5 pigeons. Both experiments arranged two components with equal VI 120-s schedules (2-s access to food in both components) and VT 30-s schedules of food presentation. The stimulus-reinforcer relations were manipulated by presenting different durations of food on the VT 30-s schedules. In the Rich component, the VT-food deliveries were 4s long and in the Lean component they were 1s long. In both experiments, extinction conditions were 12 sessions and relapse conditions were 10 sessions. Resurgence was conducted as described above with a VI 30-s schedule of 2-s access to food reinforcement on a side key. Reinstatement was assessed by presenting two response-independent food presentations during the first two occurrences of the Rich and Lean components, as in Podlesnik and Shahan (2009).
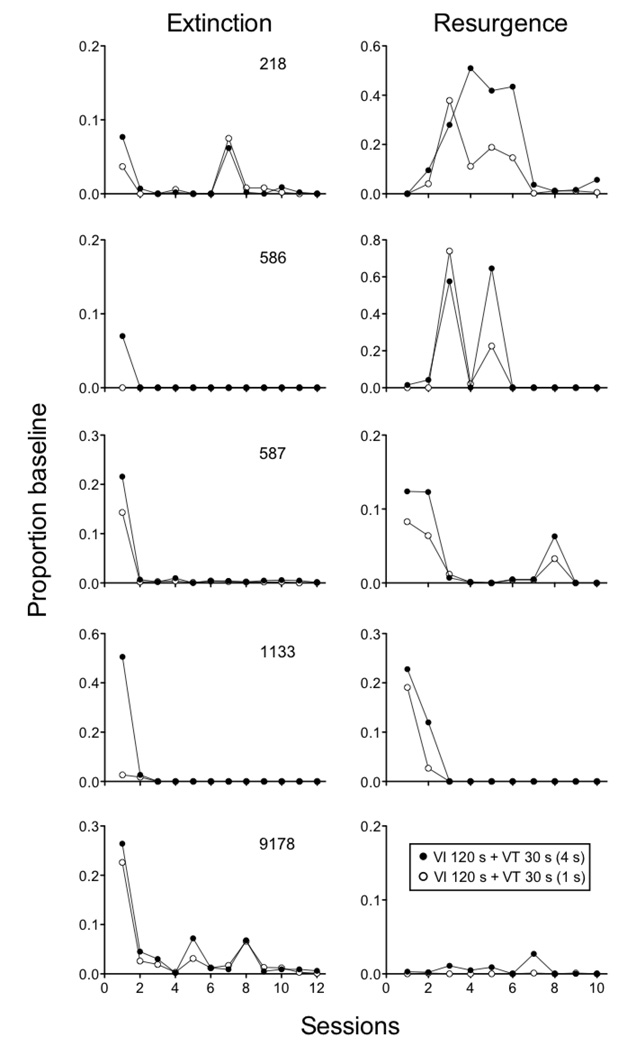
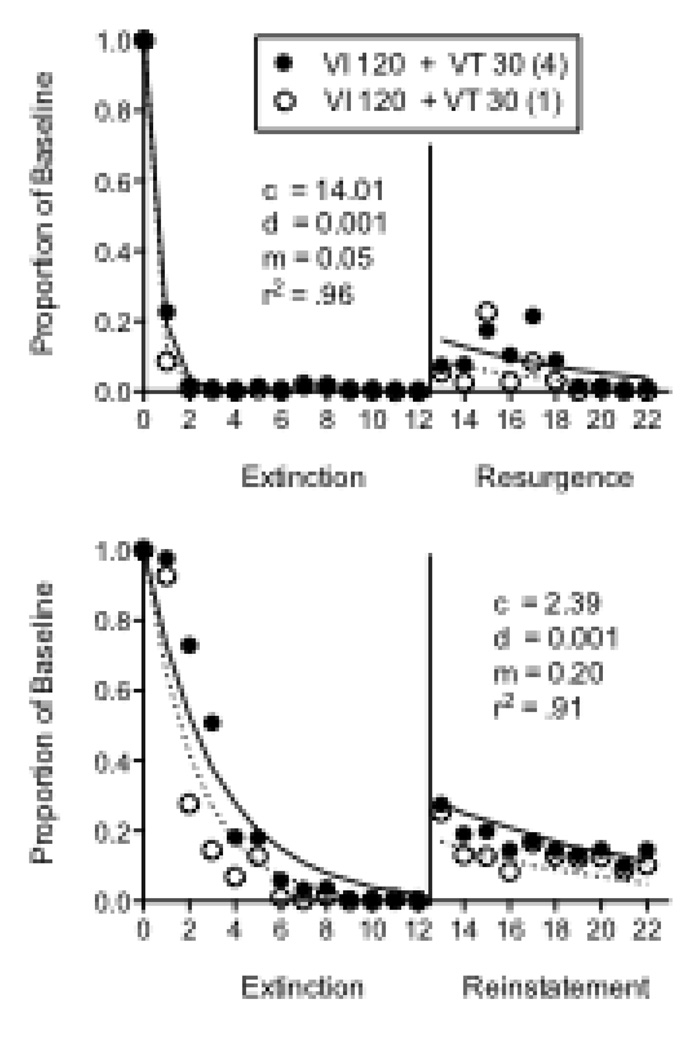
In the Resurgence experiment, baseline response rates were greater in the Rich component (Mean = 54.30; SEM = 18.57) than in the Lean component (Mean = 48.71; SEM = 18.46) for 4 out of 5 pigeons, but the difference was not statistically significant. The left panels of Figure 8 show that resistance to extinction was greater in the Rich component than the Lean component for all 5 pigeons, and this difference was statistically significant based on a component × session interaction. In the Resurgence condition (right panels Figure 8), responding overall tended to relapse to a greater extent in the Rich than in the Lean component, with individual sessions for pigeons 218 and 586 being the exceptions. The difference in resurgence for the Rich and Lean components did not reach statistical significance, likely based on the small size of the effect and variability across individuals. The top panel of Figure 9 shows that Equation 5 described the mean data well, accounting for 96% of the variance. The c parameter was larger than in previous fits as a result of the nearly immediate cessation of responding with the introduction of extinction and reinforcement for the alternative response. The value of the m parameter was somewhat smaller than in previous fits owing to the lower overall level of resurgence obtained.
Figure 8.
Proportion of baseline response rates across Extinction and Resurgence conditions in experiment with pigeons arranging different magnitudes of response-independent reinforcement during baseline. Data are presented for 5 individual pigeons.
Figure 9.
Proportion of baseline response rates across Extinction and Resurgence (top panel) or Reinstatement (bottom panel) conditions in two experiments with pigeons arranging different magnitudes of response-independent reinforcement during baseline. Data in the top panel are based on the individual-subject data shown in Figure 8. The fitted lines and parameter valued were derived from Equation 5.
In the Reinstatement experiment, baseline response rates were greater in the Rich component (Mean = 58.42; SEM = 19.23) than in the Lean component (Mean = 46.77; SEM = 13.86) in 4 out of 5 pigeons, but again, this difference did not reach statistical significance. The bottom panel of Figure 9 shows mean relative resistance to change and reinstatement in the Rich and Lean components. Relative resistance to change was significantly greater in the Rich component than the Lean component based on a significant component × session interaction. Relative reinstatement was also greater in the Rich than the Lean component as evidenced by a significant main effect of component in that condition. Equation 5 provided a good description of the data accounting for 91% of the variance with reasonable parameter values. Thus, the model appears to provide an adequate description of post-extinction response rate increases produced by a reinstatement manipulation.
2.2.4. Renewal Data from Podlesnik and Shahan (2009)
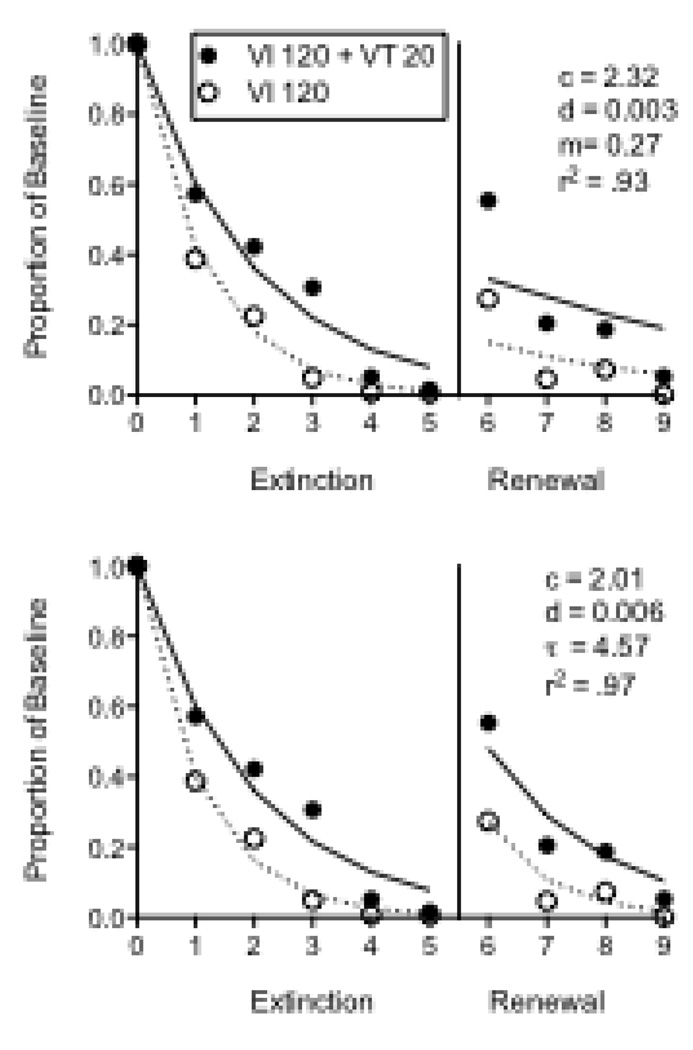
Finally, we return to a treatment of the context renewal data of Podlesnik and Shahan (2009). As a reminder, pigeons responded in a multiple schedule with VI 120-s schedule reinforcement in both components. In the Rich component, added response-independent food was delivered on a VT 20-s schedule. A steady houselight provided Context A during baseline, a flashing houselight provided Context B during extinction, and a return to the constant houselight provided the Context A again for the renewal test. Figure 10 shows mean responding as a proportion of baseline in the extinction and renewal conditions for 4 pigeons that experienced 5 days of extinction prior to the renewal condition. The top panel of Figure 10 shows the fit of Equation 5 to the data. Although the equation accounted for 93% of the variance in the data with reasonable parameter values, the model predictions tended to be considerably shallower than the data. In addition, when the model was fitted to the data of all 10 of the pigeons in the original experiment (not presented here), a similar result was obtained with most of the pigeons. Thus, we have explored an alternative model in order to capture the substantial relapse produced by the renewal preparation and its rapid decay with continued reexposure to Context A.
Figure 10.
Proportion of baseline response rates across Extinction and context renewal conditions for 4 pigeons exposed to 5 sessions of extinction in Podlesnik and Shahan (2009). The data in the two panels are the same, but the fitted lines and parameter values were derived from Equations 5 and 6 for the top and bottom panels, respectively.
Visual inspection of the data in Figure 10 gives the impression that the return to Context A might be characterized as return to an earlier time-point in extinction. Such a characterization might be reasonable given the explicit change in stimulus conditions (i.e., to Context B) with the onset of extinction. Thus, with re-exposure to Context A during the renewal test, the accumulated effects of disruption by extinction might be reduced to levels characteristic of a time-point closer to the beginning of extinction. To formalize this approach, the model might be modified such that:
| (6) |
where all terms are as in Equation 2, and the parameter τ scales the reduction in disruption occasioned by the change in extinction stimulus conditions. The bottom panel of Figure 10 shows the fit of the exponentiated version of Equation 6 to the Podlesnik and Shahan (2009) renewal data. The model more appropriately captures the renewal data than did Equation 6 and accounts for 97% of the variance in the data. The values for the c and d parameters are close to the values obtained in the fit with Equation 5. The value of the τ parameter suggests that the return to Context A was roughly equivalent to scaling back the disruptor to between the first and second sessions of extinction. Thus, Equation 6 appears to provide a reasonable account of the effects of different baseline reinforcement rates on context renewal of operant behavior. We have also examined whether Equation 6 could be used with the other relapse operations above and have found it to provide an inferior description of the data because it predicts steeper functions during relapse than are usually obtained. Nonetheless, it would be premature to suggest based on a single dataset that a different model is needed for renewal than for resurgence and reinstatement. Obviously more extensive datasets obtained with the different relapse operations under similar conditions would be required to make such an assertion.
The discussion above suggests that the augmented extinction model of behavioral momentum theory might provide a framework for formalizing and testing predictions about how different relapse operations have their effects. Different sources of relapse might require different approaches to how disruption is reduced during relapse. With appropriate substitutions in the numerator of the basic momentum model (i.e., Equation 2), is should be possible to provide an account of relapse following any number of behavior-decreasing interventions in addition to extinction (i.e., punishment, changes in motivation, etc).
2.2.5. Summary of data
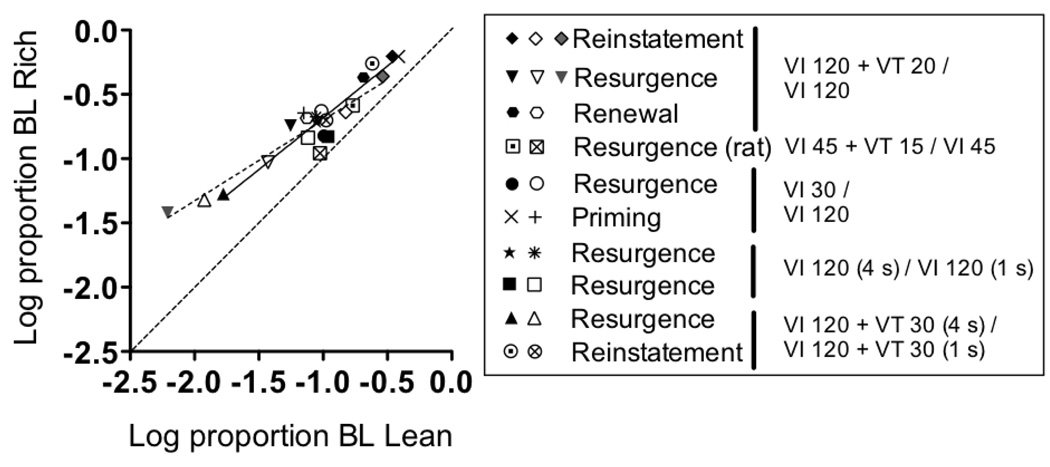
Regardless of the details about how any particular relapse operation is characterized by the model, the general approach above suggests that relative resistance to change and relapse are a function of the same variables and should be similarly impacted by differences in relative conditions of reinforcement. Accordingly, Figure 11 shows mean log proportion of baseline in the Rich component on the y-axis as a function of log proportion of baseline in the Lean component on the x-axis in the extinction and relapse conditions for the experiments above and those reported by Podlesnik and Shahan (2009). Each data point is the proportion of baseline response rates averaged across the first five sessions of the extinction and relapse conditions for individual subjects, logged, and then averaged across all subjects. The first four sessions of extinction and relapse were used from the reinstatement and renewal experiments of Podlesnik and Shahan, as was true in the original report. In the figure, data points falling further to the left along the x-axis and further down the y-axis are indicative of greater disruption during extinction and less relapse. The dotted diagonal line indicates where data points would fall if there are no differences in relative resistance to extinction or relapse in the Rich and Lean components. Not surprisingly given the analyses above, data points fall above the dotted diagonal line, indicating both resistance to extinction and relapse were greater in Rich components across all comparisons. Moreover, least-squares regression lines fitted separately to resistance to change and extinction data differed neither in terms of slope, F[1, 18]=2.36, p =.14, nor y-intercepts, F[1, 19]=0.09, p =.77. Thus, the different reinforcement conditions arranged in the multiple schedules across experiments had a similar impact on relative resistance to extinction and relapse.
Figure 11.
Mean log proportion baseline responses rates in the Rich components on the y-axis and log proportion baseline responses rates in the Lean components on the x-axis for all experiments. Resistance-to-extinction data indicated in the left column of points in the legend; Relapse data indicated in the right two columns. The middle and right two points for the Reinstatement experiment is from response-independent and response-dependent reinstatement, respectively. The middle and right two points for the Resurgence experiment are from the first and second blocks of resurgence, respectively. The dashed diagonal line indicates where data points would fall given equal resistance to extinction or relapse of responding in the Rich and Lean components.
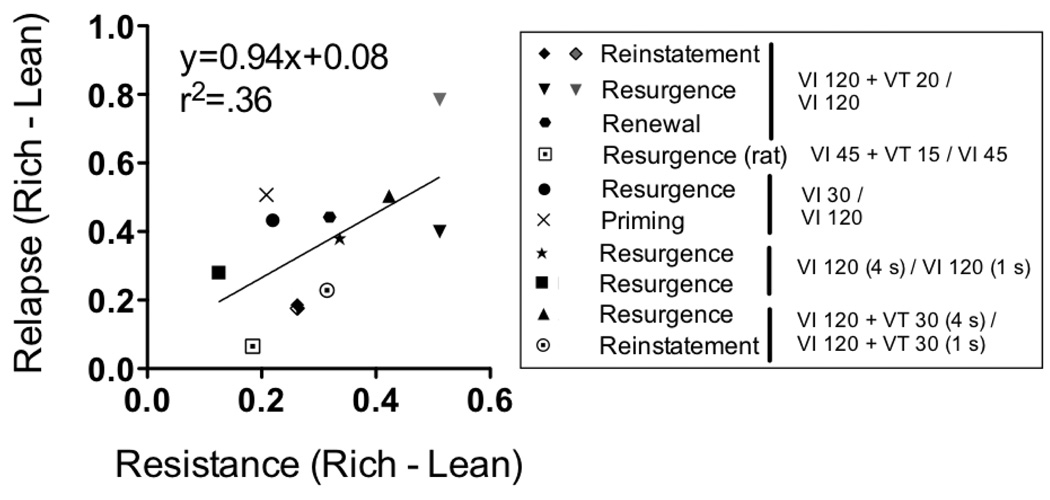
A further summary analysis examined the relation between relative resistance to extinction and relative relapse as measured by the difference between log proportion of baseline response rates in the Rich and Lean components. Such a difference measure has been used previously to examine the relation between preference in concurrent-chain schedules and relative resistance to change as converging expressions of the effects of baseline stimulus-reinforcer relations (e.g., Grace et al., 2002). Figure 12 shows that relative resistance to extinction and relapse are positively related, with a slope that is significantly non-zero according to linear regression, F[1, 10]=5.68, p =.04. Given the relation between relative resistance to extinction and relapse, these findings suggest that behavioral momentum theory is an appropriate framework to describe the effects of baseline reinforcement conditions on relative resistance to extinction and relapse. Furthermore, in addition to relative resistance to change and preference in concurrent-chains schedules, the relapse of discriminated operant behavior provides an additional quantitative expression of the effects of baseline stimulus-reinforcer relations—effects previously described as response strength or behavioral mass (see Nevin and Grace, 2000).
Figure 12.
Difference of mean log proportion of baseline response rates between Rich and Lean components for Relapse on the y-axis and Resistance to extinction on the x-axis. The left and right two points for the Reinstatement experiment are from response-independent and response-dependent reinstatement, respectively. The left and right two points for the Resurgence experiment are from first and second blocks of resurgence, respectively.
3. Implications
3.1. Behavioral mass and relapse
Within the framework of behavioral momentum theory, two aspects of discriminated operant behavior are analogous to properties of moving bodies from classical physics (Nevin and Grace, 2000). Baseline response rates are analogous to velocity and resistance to change is analogous to mass. Disrupting responses of greater behavioral mass produces slower decreases in response rates than responses of less behavioral mass. This is consistent with the velocity of physical bodies of greater physical mass decreasing more slowly when perturbed by an outside force than bodies with less physical mass. The metaphor between operant responding and motion breaks down when increases in response rates and velocity are considered. Increases in velocity of physical bodies with greater mass are slower than those with less mass. If behavioral mass and physical mass are analogous, increases in response rates also should be slower for responses with greater behavioral mass (see Aparicio, 2000; Baum and Mitchell, 2000; Hall, 2000; Harper, 2000; White and Cameron, 2000, for related discussions). However, the present findings showed that increases in response rates are greater with greater behavioral mass. Therefore, the present findings might point to at least one limit to the analogy between behavioral and physical momentum.
In defense of behavioral momentum theory, it is arguable that this limitation is unfounded. Extinction does not result in unlearning; therefore, the appropriate comparison is that relapse is assessed relative to a pre-extinction baseline response rates and not low rates of responding during extinction. Nonetheless, whether or not the metaphor of behavior momentum ultimately remains useful, the family of equations it has generated continues to provide a useful framework for characterizing the persistence of operant behavior and its susceptibility to relapse.
3.2. Relevance to drug abuse
Drug abuse and dependence are defined by the persistence of drug use and relapse after attempts at abstinence (American Psychiatric Association, 2000). Research with human drug users has shown that stimuli associated with drugs produce self-reports of craving and provoke relapse (O’Brien et al., 1992; Wikler, 1973). Animal models similarly have shown that contextual stimuli associated with drug reinforcement also produce relapse of drug self-administration (see Crombag et al., 2008, for a review). The present experiments suggest that preservation of stimulus-reinforcer relations throughout extinction and their retrieval during relapse appear to modulate the degree of both persistence and relapse. Previous studies with rats have shown that behavioral momentum theory is useful for characterizing the effects of frequency of drug reinforcement on the resistance to change of drug-maintained behavior (see Jimenez-Gomez and Shahan, 2006; Quick and Shahan, 2009). Given the findings above with food reinforcers that different reinforcement conditions experienced in the presence of stimuli impact relapse in a manner well-described by behavioral momentum theory, it may also be true that the likelihood of relapse to drug use may be greater in contexts previously associated with more frequent drug use. Consistent with this possibility are clinical data showing that the higher frequency of previous drug use is predictive of poorer success with drug-abuse treatment programs (e.g., Preston et al., 1998; see Higgins and Sigmon, 2000, for a discussion). Importantly, behavioral momentum suggests that all sources of reinforcement obtained in the presence of a stimulus context increase relative resistance to change. Shahan and Burke (2004) have shown that although an added source of non-drug reinforcement in the presence of a stimulus decreased alcohol-maintained responding of rats, resistance to change of alcohol seeking was greater in that stimulus. Given the effects of baseline stimulus-reinforcer relations on resistance to change and relapse described above, it might be interesting to examine whether non-drug reinforcers obtained in the presence of a drug-associated stimulus increase relapse in the presence of that stimulus. Such findings would suggest that all sources of reinforcement experienced in a drug cue, both drug and non-drug, contribute to relapse to drug seeking.
3.3. Relevance to the treatment of other problem behavior
A major goal of Applied Behavior Analysis is to use reinforcement principles and other techniques to decrease problem or undesirable behavior. One frequently used technique to decrease problem behavior is to provide differential reinforcement of alternative behavior (DRA) to compete with the source of reinforcement maintaining problem behavior. In many cases, reinforcing alternative responses has been quite successful in decreasing problem behavior (see Petscher et al., 2009, for a review). However, few researchers have assessed whether the use of DRA schedules inadvertently enhanced the persistence and likelihood of the reoccurrence (i.e., relapse) of problem behavior.
One study that does suggest that DRA schedules enhance the persistence of problem behavior in individuals with developmental disabilities was Ahearn et al. (2003). The participants were three children diagnosed with an autism spectrum disorder displaying varying topographies of stereotypical behavior maintained by automatic reinforcement. Providing access to preferred stimuli on VT schedules decreased rates of stereotypical behavior relative to when preferred stimuli were unavailable, consistent with effective use of DRA procedures. Resistance to disruption was examined by providing access to a second and different preferred stimulus. Consistent with basic research on behavioral momentum (e.g., Nevin et al., 1990; Podlesnik and Shahan, 2009), stereotypical behavior was more persistent following access to preferred VT stimuli.
The implications of using alternative sources of reinforcement to decrease undesirable behavior are similar for the treatment of drug use mentioned above and other problem behavior. According to behavioral momentum theory, arranging alternative reinforcement in the same context in which reinforcement maintains problem behavior enhances the stimulus-reinforcer relation. The lesson from basic research in behavior momentum with animals and their translation to more natural situations (e.g., Ahearn et al., 2003; Mace et al., 1990) mirrors problems of self-control: Using alternative sources of reinforcement is effective in decreasing problem behavior in the short term; however, applied researchers and practitioners should use differential reinforcement schedules with the knowledge that there is potential for increasing both the persistence and likelihood of reoccurrence (i.e., relapse) of problem behavior in the long term. Efforts should be made to further understand how DRA schedules can continue to be used effectively to decrease problem behavior without enhancing the persistence and reoccurrence of problem behavior (see Mace, 2000, for a discussion). Attention to these issues could enhance long-term maintenance of treatment gains.
4. Conclusion
Within the framework of behavioral momentum theory, a large body of research has shown that relative resistance to disruption across discriminative-stimulus contexts is a function of the relative rate or magnitude of reinforcement presented in those contexts (see Nevin, 1992; Nevin and Grace, 2000, for reviews). The present series of experiments extended those findings by showing relapse also was a function of the rate or magnitude of reinforcement in a discriminative-stimulus context (see also Podlesnik and Shahan, 2009). Furthermore, an extension of the augmented model of extinction suggested by behavioral momentum theory accounted for the effects of different reinforcement conditions on relative resistance to extinction and relapse. Therefore, behavioral momentum theory might provide a useful framework for predicting how discriminative-stimulus contexts modulate both the persistence and relapse of operant behavior under a variety of circumstances.
Acknowledgments
The authors would like to thank Scott Barrett, Adam Kynaston, and Abby Brinkerhoff for assistance in conducting these experiments and Corina Jimenez-Gomez and Tony Nevin for helpful comments on a previous version of this manuscript. This research was funded by NIH grants R01AA016786 and R21DA026497 to TAS.
Footnotes
Publisher's Disclaimer: This is a PDF file of an unedited manuscript that has been accepted for publication. As a service to our customers we are providing this early version of the manuscript. The manuscript will undergo copyediting, typesetting, and review of the resulting proof before it is published in its final citable form. Please note that during the production process errors may be discovered which could affect the content, and all legal disclaimers that apply to the journal pertain.
Note that, as with extinction, the use of the terms relapse, reinstatement, resurgence, and renewal are used to denote both behavioral effects and procedures (e.g., conditions, methods).
References
- Ahearn WH, Clark KM, Gardenier NC, Chung BI, Dube WV. Persistence of stereotyped behavior: Examining the effects of external reinforcers. J Appl. Behav. Anal. 2003;36:439–448. doi: 10.1901/jaba.2003.36-439. [DOI] [PMC free article] [PubMed] [Google Scholar]
- American Psychiatric Association. Diagnostic and statistical manual of mental disorders. 4th ed. Washington, DC: American Psychiatric Association; 2000. text revision. [Google Scholar]
- Aparicio CF. The stimulus-reinforcer hypothesis of behavioral momentum: Some methodological considerations. Behav. Brain Sci. 2000;23:90–91. [Google Scholar]
- Baker AG, Steinwald H, Bouton ME. Contextual conditioning and reinstatement of extinguished instrumental responding. Quart. J. Exp. Psychol. 1991;43:199–218. [Google Scholar]
- Baum WM, Mitchell SH. Newton and Darwin: Can this marriage be saved? Behav. Brain Sci. 2000;23:91–92. [Google Scholar]
- Bindra D. A motivational view of learning, performance, and behavior modification. Psychol. Rev. 1974;81:199–213. doi: 10.1037/h0036330. [DOI] [PubMed] [Google Scholar]
- Boulougouris V, Castañé A, Robbins TW. Dopamine D2/D3 receptor agonist quinpirole impairs spatial reversal learning in rats: Investigation of D3 receptor involvement in persistent behavior. Psychopharmacol. 2009;202:611–620. doi: 10.1007/s00213-008-1341-2. [DOI] [PubMed] [Google Scholar]
- Bouton ME. Context, ambiguity, and unlearning: Sources of relapse after behavioral extinction. Biol. Psychiatry. 2002;52:976–986. doi: 10.1016/s0006-3223(02)01546-9. [DOI] [PubMed] [Google Scholar]
- Bouton ME. Context and behavioral processes in extinction. Learn. Mem. 2004;11:485–494. doi: 10.1101/lm.78804. [DOI] [PubMed] [Google Scholar]
- Bouton ME, King DA. Contextual control of the extinction of conditioned fear: Tests for the associative value of the context. J Exp. Psychol. Anim. Behav. Proc. 1983;9:248–265. [PubMed] [Google Scholar]
- Bouton ME, Swartzentruber D. Sources of relapse after extinction in Pavlovian and instrumental learning. Clin. Psychol. Rev. 1991;11:123–140. [Google Scholar]
- Cohen SL. Behavioral momentum of typing behavior in college students. Journal of Behav. Anal. Ther. 1996;1:36–51. [Google Scholar]
- Crombag HS, Bossert JM, Koya E, Shaham Y. Context-induced relapse to drug seeking: A review. Philos. Trans. R. Soc. Lon. B. Bio. Sci. 2008;363:3233–3243. doi: 10.1098/rstb.2008.0090. [DOI] [PMC free article] [PubMed] [Google Scholar]
- Crombag HS, Shaham Y. Renewal of drug seeking by contextual cues after prolonged extinction in rats. Behav. Neurosci. 2002;116:169–173. doi: 10.1037//0735-7044.116.1.169. [DOI] [PubMed] [Google Scholar]
- Doughty AH, Reed P, Lattal KA. Differential reinstatement predicted by preextinction response rate. Psychonom. Bull. Rev. 2004;11:1118–1123. doi: 10.3758/bf03196746. [DOI] [PubMed] [Google Scholar]
- Epstein R. Cognition, creativity, and behavior: Selected essays. Westport, CT: Praeger Publishers/Greenwood Publishing Group; 1996. [Google Scholar]
- Grace RC, Bedell MA, Nevin JA. Preference and resistance to change with constant- and variable-duration terminal links: Independence of reinforcement rate and magnitude. J. Exp. Anal. Behav. 2002;77:223–255. doi: 10.1901/jeab.2002.77-233. [DOI] [PMC free article] [PubMed] [Google Scholar]
- Grimes JA, Shull RL. Response-independent milk delivery enhances persistence of pellet reinforced lever pressing by rats. J. Exp. Anal. Behav. 2001;76:179–194. doi: 10.1901/jeab.2001.76-179. [DOI] [PMC free article] [PubMed] [Google Scholar]
- Hall S. Amassing the masses. Behav. Brain Sci. 2000;23:99–100. [Google Scholar]
- Harper DN. Drug-induced changes in responding are dependent on baseline stimulus- reinforcer contingencies. Psychobiol. 1999;27:95–104. [Google Scholar]
- Harper DN. Problems with the concept of force in the momentum metaphor. Behav. Brain Sci. 2000;23:100. [Google Scholar]
- Herrnstein RJ. On the law of effect. J. Exp. Anal. Behav. 1970;13:243–266. doi: 10.1901/jeab.1970.13-243. [DOI] [PMC free article] [PubMed] [Google Scholar]
- Higgins ST, Sigmon SC. Implications of behavioral momentum for understanding the behavioral pharmacology of abused drugs. Behav. Brain Sci. 2000;23:101. [Google Scholar]
- Igaki T, Sakagami T. Resistance to change in goldfish. Behav. Process. 2004;66:139–152. doi: 10.1016/j.beproc.2004.01.009. [DOI] [PubMed] [Google Scholar]
- Jimenez-Gomez C, Shahan TA. Resistance to change of alcohol self-administration: Effects of alcohol-delivery rate on disruption by extinction and naltrexone. Behav. Pharmacol. 2007;18:161–169. doi: 10.1097/FBP.0b013e3280f2756f. [DOI] [PubMed] [Google Scholar]
- Katz JL, Higgins ST. The validity of the reinstatement model of craving and relapse to drug use. Psychopharmacol. 2003;168:21–30. doi: 10.1007/s00213-003-1441-y. [DOI] [PubMed] [Google Scholar]
- Lattal KA. Contingencies on response rate and resistance to change. Learn. Motiv. 1989;20:191–203. [Google Scholar]
- Lattal KA, Reilly MP, Kohn JP. Response persistence under ratio and interval reinforcement schedules. J. Exp. Anal. Behav. 1998;70:165–183. doi: 10.1901/jeab.1998.70-165. [DOI] [PMC free article] [PubMed] [Google Scholar]
- Mace FC. Clinical applications of behavioral momentum. Behav. Brain Sci. 2000;23:105–106. [Google Scholar]
- Mace FC, Lalli JS, Shea MC, Lalli EP, West BJ, Roberts M, Nevin JA. The momentum of human behavior in a natural setting. J. Exp. Anal. Behav. 1990;54:163–172. doi: 10.1901/jeab.1990.54-163. [DOI] [PMC free article] [PubMed] [Google Scholar]
- Nakajima S, Tanaka S, Urushihara K, Imada H. Renewal of extinguished lever-press responses upon return to the training context. Learn. Motiv. 2000;31:416–431. [Google Scholar]
- Nevin JA. Response strength in multiple schedules. J. Exp. Anal. Behav. 1974;21:389–408. doi: 10.1901/jeab.1974.21-389. [DOI] [PMC free article] [PubMed] [Google Scholar]
- Nevin JA. An integrative model for the study of behavioral momentum. J. Exp. Anal. Behav. 1992;57:301–316. doi: 10.1901/jeab.1992.57-301. [DOI] [PMC free article] [PubMed] [Google Scholar]
- Nevin JA. Measuring behavioral momentum. Behav. Proc. 2002;57:187–198. doi: 10.1016/s0376-6357(02)00013-x. [DOI] [PubMed] [Google Scholar]
- Nevin JA, Grace RC. Does the context of reinforcement affect resistance to change? J. Exp. Psychol. Anim. Behav. Proc. 1999;25:256–268. doi: 10.1037//0097-7403.25.2.256. [DOI] [PubMed] [Google Scholar]
- Nevin JA, Grace RC. Behavioral momentum and the Law of Effect. Behav. Brain Sci. 2000;23:73–130. doi: 10.1017/s0140525x00002405. [DOI] [PubMed] [Google Scholar]
- Nevin JA, Grace RC, Holland S, McLean AP. Variable-ratio versus variable- interval schedules: Response rate, resistance to change, and preference. J. Exp. Anal. Behav. 2001;76:43–74. doi: 10.1901/jeab.2001.76-43. [DOI] [PMC free article] [PubMed] [Google Scholar]
- Nevin JA, McLean AP, Grace RC. Resistance to extinction: Contingency termination and generalization decrement. Anim. Learn. Behav. 2001;29:176–191. [Google Scholar]
- Nevin JA, Tota ME, Torquato RD, Shull RL. Alternative reinforcement increases resistance to change: Pavlovian or operant contingencies? J. Exp. Anal. Behav. 1990;53:359–379. doi: 10.1901/jeab.1990.53-359. [DOI] [PMC free article] [PubMed] [Google Scholar]
- O’Brien CP, Childress AR, McLellan AT, Ehrman R. Classical conditioning in drug-dependent humans. Ann. N. Y. Acad. Sci. 1992;654:400–415. doi: 10.1111/j.1749-6632.1992.tb25984.x. [DOI] [PubMed] [Google Scholar]
- Petscher ES, Rey C, Bailey JS. A review of empirical support for differential reinforcement of alternative behavior. Research Dev. Dis. 2009;30:409–425. doi: 10.1016/j.ridd.2008.08.008. [DOI] [PubMed] [Google Scholar]
- Podlesnik CA, Jimenez-Gomez C, Shahan TA. Resurgence of alcohol seeking produced by discontinuing non-drug reinforcement as an animal model of drug relapse. Behav. Pharmacol. 2006;17:369–374. doi: 10.1097/01.fbp.0000224385.09486.ba. [DOI] [PubMed] [Google Scholar]
- Podlesnik CA, Shahan TA. Response-reinforcer relations and resistance to change. Behav. Proc. 2008;77:109–125. doi: 10.1016/j.beproc.2007.07.002. [DOI] [PubMed] [Google Scholar]
- Podlesnik CA, Shahan TA. Behavioral momentum and relapse of extinguished operant responding. Learn. Behav. 2009 doi: 10.3758/LB.37.4.357. [DOI] [PMC free article] [PubMed] [Google Scholar]
- Preston KL, Silverman K, Higgins ST, Brooner RK, Montoya I, Schuster CR, Cone EJ. Cocaine use early in treatment predicts outcome in a behavioral treatment program. J. Consult. Clin. Psychol. 1998;66:691–696. doi: 10.1037//0022-006x.66.4.691. [DOI] [PubMed] [Google Scholar]
- Quick SL, Shahan TA. Behavioral momentum of cocaine self-administration: Effects of frequency of reinforcement on resistance to extinction. Behav. Pharm. 2009;20:337–345. doi: 10.1097/FBP.0b013e32832f01a8. [DOI] [PubMed] [Google Scholar]
- Reed P, Morgan TA. Resurgence of behavior during extinction depends on previous rate of response. Learn. Behav. 2007;35:106–114. doi: 10.3758/bf03193045. [DOI] [PubMed] [Google Scholar]
- Reid RL. The role of the reinforcer as a stimulus. Br. J. Psychol. 1957;49:192–200. doi: 10.1111/j.2044-8295.1958.tb00658.x. [DOI] [PubMed] [Google Scholar]
- Rescorla RA, Solomon RL. Two-process learning theory: Relationships between Pavlovian conditioning and instrumental learning. Psychol. Rev. 1967;74:151–182. doi: 10.1037/h0024475. [DOI] [PubMed] [Google Scholar]
- Robinson TE, Berridge KC. The neural basis of drug craving: An incentive- sensitization theory of addiction. Brain Res. Rev. 1993;18:247–291. doi: 10.1016/0165-0173(93)90013-p. [DOI] [PubMed] [Google Scholar]
- Shahan TA, Burke KA. Ethanol-maintained responding of rats is more resistant to change in a context with added non-drug reinforcement. Behav. Pharmacol. 2004;15:279–285. doi: 10.1097/01.fbp.0000135706.93950.1a. [DOI] [PubMed] [Google Scholar]
- Shalev U, Grimm JW, Shaham Y. Neurobiology of relapse to heroin and cocaine seeking: A review. Pharmacol. Rev. 2003;54:1–42. doi: 10.1124/pr.54.1.1. [DOI] [PubMed] [Google Scholar]
- Stafford D, LeSage MG, Glowa JR. Progressive-ratio schedules of drug delivery in the analysis of drug self-administration: A review. Psychopharmacol. 1998;139:169–184. doi: 10.1007/s002130050702. [DOI] [PubMed] [Google Scholar]
- Stewart J, de Wit H. Reinstatement of cocaine-reinforced responding in the rat. Psychopharmacol. 1981;75:134–143. doi: 10.1007/BF00432175. [DOI] [PubMed] [Google Scholar]
- Stewart J, de Wit H, Eikelboom R. Role of unconditioned and conditioned drug effects in the self-administration of opiates and stimulants. Psychol. Rev. 1984;91:251–268. [PubMed] [Google Scholar]
- Terry WS. Effects of food priming on instrumental acquisition and performance. Learn. Motiv. 1983;14:107–122. [Google Scholar]
- White KG, Cameron J. Resistance to change, contrast, and intrinsic motivation. Behav. Brain Sci. 2000;23:115–116. [Google Scholar]
- Wikler A. Dynamics of drug dependence, implication of a conditioning theory for research and treatment. Arch. Gen. Psychiatry. 1973;28:611–616. doi: 10.1001/archpsyc.1973.01750350005001. [DOI] [PubMed] [Google Scholar]
- Winger G, Woods JH, Galuska CM, Wade-Galuska T. Behavioral perspectives on the neuroscience of drug addiction. J. Exp. Anal. Behav. 2005;84:667–681. doi: 10.1901/jeab.2005.101-04. [DOI] [PMC free article] [PubMed] [Google Scholar]


