

Abstract
Sensitivity, specificity, and reproducibility are vital to interpret neuroscientific results from functional magnetic resonance imaging (fMRI) experiments. Here we examine the scan-rescan reliability of the percent signal change (PSC) and parameters estimated using Dynamic Causal Modeling (DCM) in scans taken in the same scan session, less than five minutes apart. We find fair to good reliability of PSC in regions that are involved with the task, and fair to excellent reliability with DCM. Also, the DCM analysis uncovers group differences that were not present in the analysis of PSC, which implies that DCM may be more sensitive to the nuances of signal changes in fMRI data.
Keywords: Dynamic Causal Modeling, FMRI, test-retest, reproducibility, reliability
Introduction
As the analysis tools of functional MRI data evolve into methods of greater complexity, ongoing critical examination of their sensitivity, specificity, and reproducibility is vital to ensure that interpretations of the data do not exceed the limitations of the data itself. In the past few years, several limitations have been examined. The accuracy of transforming data to a common space has been called into question because of the assumptions made about uniform brain anatomy (Devlin 2006, Feredoes 2007, Goldman-Rakic 2000, Saxe 2006.) In addition, models of the physiological basis of the BOLD signal and its neurological underpinnings have been under continual examination (Aguirre 1998, Handwerker 2004, Leontiev 2007, Raichle 2006.) And finally, leading researchers (Logothetis 2008) have shown that BOLD activity could be due to inhibitory or excitatory effects.
The need for this reevaluation extends to complex mathematical analysis methods. Emerging data analysis techniques that draw from unrelated fields such as engineering and economics may be conceptually and statistically sound, but their power can only be realized if their assumptions are satisfied, and this is often difficult to do in the context of brain imaging. They must therefore be shown to be reliable and valid when applied to a variety of well-characterized datasets. This is a prerequisite for rigorous interpretation of findings about group differences in brain activation, correlation of brain activation with tasks, subject traits, or subject behavior, or more complex understanding of connectivity of different regions in a single brain. Moreover, reliability and validity are of paramount importance when fMRI is applied to clinical research, clinical diagnosis, and the study of neural changes arising from therapeutic interventions.
Many studies (Aron 2006, Caceres 2009, Cohen 1999, Friedman 2006, Friedman 2008, Johnstone 2005, Le 1997, Loubinoux 2001, Waites 2004, Wei 2004) have focused on the reliability of fMRI signal, as measured by regional percent signal change (PSC) during sensorimotor, cognitive and affective tasks. The results have suggested that, while not ideal, generally there is evidence for reliability of PSC within a subject across time. These studies calculate reliability using Type 1 intraclass correlation coeffecient, the ICC(1,1), based on the work of Shrout and Fleiss (1979). ICC(1,1) is calculated using
where BMS is the between-subject mean square, WMS is the within-subject mean square, and k is the number of scans on each subject. Cicchetti's guidelines of ICC (Cicchetti 2001) classify ICC<0.40 as poor, 0.40 - 0.59 as fair, 0.60 -0.74 as good, and 0.75 to 1.00 as excellent. Some studies report reliabilities in the fair to poor range, but many of the studies of reproducibility of PSC would be classified as ‘good.’ Loubinoux et al. (2001) report highly reliable activation in ROI's in response to a motor task repeated 5 hours, one month, and two months apart, and Friedman et al. (2008) find good reliability (average ICC=0.67) in ROI's involved in a block design sensorimotor task with scans one day apart. In a classification learning task, Aron et al. find good to excellent reliability using voxel-wise ICC's in regions involved with the learning task scanned a few minutes apart (Aron 2006.) In contrast, Wei et al. find reliabilities ranging from poor to excellent in different regions in response to an auditory 2-back task, with the Brodmann's Area 40 (BA40) producing the highest reliability across scan sessions at least three weeks apart (Wei 2004.). The current study replicates the finding that the PSC measurement in an ROI has good reliability in scans that are in the same scanning session (Aron 2006, Caceres 2009, Cohen 1999, Friedman 2006, Friedman 2008, Johnstone 2005, Le 1997, Loubinoux 2001, Waites 2004, Wei 2004.)
The main goal of this work is to study the reliability of Dynamic Causal Modeling (DCM) (Friston 2003) and to see how this method compares to PSC. DCM is an example of a creative application of an engineering technique to the analysis of neuroimaging data. The analysis makes use of time series of activation in a priori regions of interest to estimate changing connectivities between those regions, in addition to direct effects of the stimuli on the regions themselves. It is conceptually appealing and has been used to explore several neural models including language (Mechelli 2005, Bitan 2005, Ethofer 2006, Booth 2007, Sonty 2007, Noppeney 2008), motor activation (Grol 2007, Grefkes 2008), face perception (Fairhall 2007), visuospatial attention (Siman-Tov 2007) and changes across development (Cao 2008, Booth 2008.)
A full explanation of the mathematical underpinnings of DCM can be found in Friston (2003), but an overview of the basic structure will be presented here. DCM is an effective connectivity method, as opposed to a functional connectivity method. Functional connectivity analyses examine correlations between regions without regard to causation, while effective connectivity analyses can infer causation within a model. DCM asserts that a change in neuronal firing in one region can be caused by external driving inputs, connections to other regions, and contextual modulation of those inter-regional connections. This is shown explicitly with the formula
where z and u are vectors containing the time series of the neural state of the volumes of interest (VOI's) and stimuli presentations, respectively. A is a matrix that describes connectivity between different VOI's when the system is in a steady state, B is a matrix that describes how that connectivity changes based on the presentation of each stimulus j, and C is a matrix that describes the effect of each stimulus on each brain region, comparable to a traditional GLM analysis. The model is then extended from the hypothetical neuronal state to the observed BOLD activity using formulas that calculate blood flow induction, volume changes, and subsequent changes in the fraction of oxy- to deoxy-hemoglobin (Stephan et al. 2007, further discussed in David et al. 2008.) These formulas employ biophysical parameters as priors, which are entered into a Bayesian estimation procedure (Friston 2002.) This estimation uses an Expectation-Maximization algorithm to estimate the matrices A, B, and C. The estimated indices of A, B, and C can then be used to explore differences in activation between groups.
In the present experiment, we examined the reliability of results obtained from an analysis of PSC and two DCM analyses, and the ability of each method to discriminate between groups attending to different sensory modalities. We found regions of interest which activated in response to the simultaneous presentation of faces and voices, and studied the behavior in those regions in subjects that were asked to attend to either the face or the voice. We studied the ability of the each analysis method to discriminate between the two groups, and we studied reliability by comparing the analysis results in two scans approximately two minutes apart.
Methods
Participants
Forty-two healthy human subjects were recruited through the local newspaper and chosen by phone screening with an MRI compatibility form and the Edinburgh Handedness Survey. The goal was to obtain a sample representative of the “normal” types of subjects recruited as controls from the population at large. Subjects ranged in age from 18–50 years, with number and sex balanced within each decade: 18–29 years, 8 males and 6 females; 30–39 years, 6 males and 6 females; and 40–50 years, 8 males and 6 females. Before participating, each subject gave informed consent. UW-Madison's Human Subjects Committee approved the study paradigm. These data are part of the Wisconsin Neuroimaging Tool Evaluation Resource (WINTER) dataset used to explore fMRI methodology and data analysis issues. Further details on this dataset are outlined in Oakes et al (2005).
Experimental Task
Event-related FMRI was used to examine brain activation in response to angry and happy vocal expressions, while participants concurrently viewed either emotionally congruent or discrepant facial expressions, a task similar to that previously used to examine the crossmodal processing of fear expressions (Dolan, Morris, & de Gelder, 2001). Visual stimuli consisted of 16 greyscale faces displaying expressions of anger and 16 expressions of happiness, half of them females, taken from the Karolinska Directed Emotional Faces set (Lundqvist, Flykt, & Öhman, 1998). Auditory stimuli consisted of short phrases (dates and numbers) lasting on average 1 second, spoken with either angry or happy prosody, taken from the Emotional Prosody Speech and Transcripts dataset (Linguistic Data Consortium, Philadelphia, PA, 2002). 16 angry phrases and 16 happy phrases, half of each spoken by female actors, were used. All phrases were normalized to the same mean signal amplitude.
Stimuli were presented for 1 second with an inter-stimulus interval of 15 seconds. Each of the four different types of stimulus pairs [angry voice+angry face (AA), angry voice+happy face (AH), happy voice+angry face (HA) and happy voice+happy face (HH)] were presented 20 times each in a pseudo-random order, across two scan runs. Participants performed a two-response (angry or happy) discrimination task. Half the participants were randomly selected to make their decision on the basis of the facial expression (Attentional Focus: ‘face’ condition), while the other half were instructed to make their decision on the basis of the vocal expression (Attentional Focus: ‘voice’ condition). Apart from the instruction to attend to either visual or auditory stimuli, all participants performed the identical task, with identical stimulus pairs being presented. Participants were instructed to press one button on a 2-button response pad if the attended stimulus was an angry expression, and to press the other button if the attended stimulus was a happy expression. The matching of buttons to responses was counterbalanced across subjects within each response group. Participants were instructed to respond as quickly and accurately as possible. Stimuli were presented and responses were recorded using EPrime software.
Image Acquisition
Images were acquired on a GE Signa 3.0 Tesla MRI scanner device with a quadrature head coil. Anatomical scans consisted of a high resolution 3D T1-weighted inversion recovery fast gradient echo image (inversion time = 600 msec, 256×256 in-plane resolution, 240mm FOV, 124×1.2mm axial slices), and a T2-weighted spin echo image with the same slice position and orientation as the functional images (256×256 in-plane resolution, 240mm FOV, 30×4mm sagittal slices with a 1mm gap). Two functional scan runs were acquired using a gradient echo EPI sequence (64×64 in-plane resolution, 240mm FOV, TR/TE/Flip = 2000ms/30ms/90°, 30×4mm interleaved sagittal slices with a 1mm interslice gap; 290 3D volumes per run).
Analysis
Individual subject data were slice-time corrected in AFNI (Cox, 1996) to correct for temporal offsets in the acquisition of slices (which were acquired in an interleaved slice order.) Image distortion was corrected using measured B0 field-maps to shift image pixels along the phase encoding direction in the spatial domain (Jezzard & Balaban, 1995). The data were then transformed to ANALYZE format and the rest of the preprocessing and analysis was done using SPM5. The slices were realigned to the first scan of each session using a 5 mm smoothing kernel and resliced using a 4th degree B-spline interpolation. The functional data from individual subjects were analyzed using a General Linear Model (GLM) with stimulus presentation modeled with a canonical hemodynamic response function, as defined in SPM5. The stimuli were not subdivided on the basis of their emotional valence because the models we were studying deal with strictly sensory regions.
The output of the individual GLM analyses was then transformed to the MNI152 template using FSL's FLIRT (Jenkinson 2002) and volumes of interest (VOI's) were determined from a second level group analysis. In the second level analysis we used the first scan run of each subject and found the clusters that survived an uncorrected voxel-wise threshold of t>10.13 (p<10-12.) The clusters were then transformed back from the MNI-152 template to each subjects' native space using the inverse transformation as calculated in FLIRT. The regions were the left auditory cortex (A1), primary visual cortex (V1), right Fusiform Gyrus (including the Fusiform Face Area), and a cluster that spans the left Primary Motor Area and (M1) and a portion of the left somatosensory cortex (BA4 and BA6.) Details of cluster size and location are given in Table 1. These clusters were then entered as VOI's in SPM5 and the first eigenvariates of the timeseries were extracted and employed as the timeseries of the cluster. VOI's from each session were then analyzed in DCM with two different simple models – an auditory model (Figure 1) and a visual model (Figure 2.). It was hypothesized that activity in the sensory regions would relate to activity in the motor area because participants were instructed to press a button in response to the presentation of the stimulus. We also added stimulus-modulated connections, as it was hypothesized that the connectivity between regions in the model would increase as a result of presentation of relevant stimuli. Both models were applied to subjects that attended to faces and subjects that attended to voices, and the values of the resulting parameter estimates of the models were compared across groups. Reliability of output of the GLM and DCM was measured in SPSS using a single measure Type 1 Intraclass Correlation Coefficient.
Table 1.
Size and location in MNI space for the four regions studied. Regions are auditory cortex (A1), visual cortex (V1), fusiform gyrus, and motor cortex (M1.)
| Region | Extent of activation (mm3) | MNI coordinates | ||
|---|---|---|---|---|
| x | y | z | ||
| A1 | 1089 | -52 | -18 | 2 |
| V1 | 931 | 4 | -86 | -4 |
| Fusiform | 137 | 36 | -52 | -22 |
| M1 | 363 | -42 | -22 | 60 |
Figure 1.
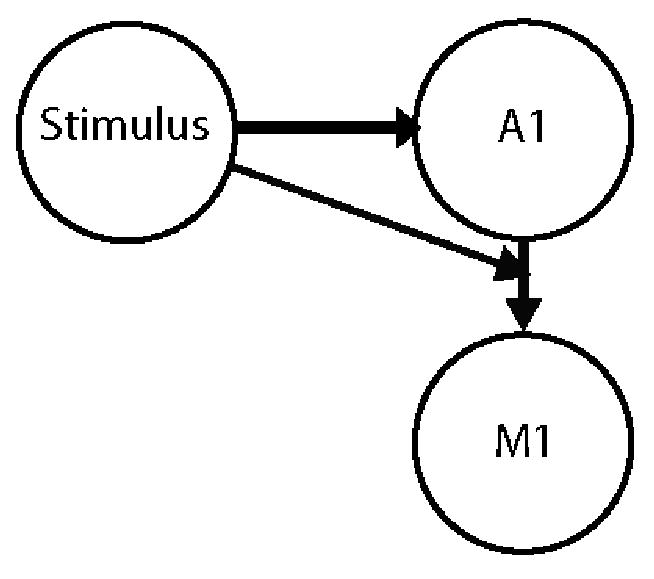
Schematic illustrating the connections in the auditory model that were tested with DCM. The model posits that the stimulus (simultaneous presentation of face and voice) has a direct effect on the auditory cortex (A1), and a modulatory effect on the connection from the auditory cortex to the motor cortex (M1.)
Figure 2.
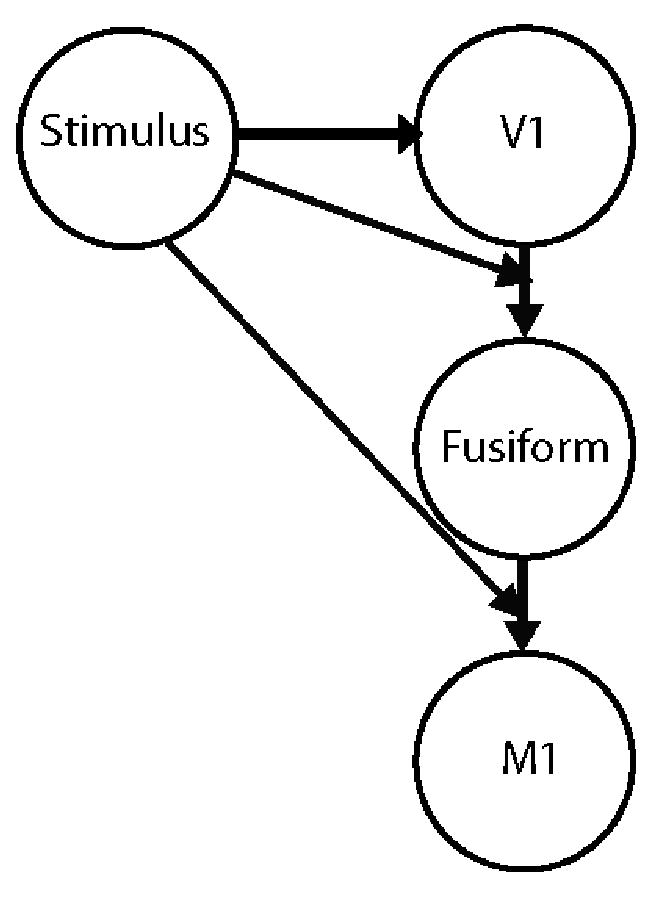
Schematic illustrating the connections in the visual model that were tested with DCM. The model posits that the stimulus (simultaneous presentation of face and voice) has a direct effect on the visual cortex (V1), and a modulatory effect on the connection from the visual cortex to the Fusiform gyrus and the connection from the Fusiform gyrus to the motor cortex (M1.)
Results
The two separate models, a simple auditory model (Figure 1) and a more complex visual model (Figure 2), were entered into the DCM analysis and their parameter estimates were compared with each subject's assigned attentional target (face or voice.) In the auditory model it is assumed that the stimulus activates Primary Auditory cortex (A1) and activation in A1 then leads to activation in Primary Motor cortex (M1), when the subject indicates his or her discrimination decision with a button press. The visual model follows a similar path, but involves the signal traveling from V1 to the Fusiform Face Area before leading to activation in M1 when the subject executes a button press in response to the emotional face. These two separate models were used to test the reliability of DCM in estimating the parameters of the two different models, and to check if the attended modality of the group could be discriminated by comparing the calculated connectivity values in the two groups. Each subject was assigned only one modality and attended to the same one for both scans.
The parameters calculated in both the auditory and visual DCM models were tested for across-scan reliability in subjects who attended to voice and subjects that attended to face, to test whether the models were more reliable in subjects who were attending to the relevant modality. Reliability results are compiled in Table 3, and plots of the parameter estimates across scans are shown in figures 5 and 6. The visual model performed most reliably among subjects who were attending to faces - four of the five parameters had excellent reliability and the last parameter had reliability categorized as “good.” The same model, when applied to the subjects that were attending to voices, showed fair to poor reliability in four of the five parameters. Overall, the subjects attending to voice had less reliable activation for both the auditory and visual models, but the disparity is less in the auditory model. The subjects attending to voice had good reliability for the stimulus effect on A1, and the connection from A1 to M1. The stimulus-modulated connection between A1 and M1 had only fair reliability, which is in accordance with the similarly fair reliability of the PSC in those two regions.
Table 3.
Reliabilities of model estimates in DCM. Values are color-coded according to Cicchetti's guidelines for reliabilities. ICC<0.40 is poor (black), 0.40 - 0.59 is fair (red), 0.60 -0.74 is good (yellow), and 0.75 to 1.00 is excellent (green.) Pearson's r value is shown in parentheses since many parameters increased significantly from Scan 1 to Scan 2.
| Estimated Path Coefficient | Scan-Rescan Reliability (ICC) | |
|---|---|---|
| Auditory Model (Figure 1) | Visual Attentional Focus (n=21) |
Auditory Attentional Focus (n=20) |
| Stimulus->A1 |
 (909) (909) |
 (.725) (.725) |
| A1->M1 |
 (.734) (.734) |
 (.647) (.647) |
| Stimulus moderating A1->M1 |
 (.878) (.878) |
 (.476) (.476) |
| Visual Model (Figure 2) | ||
| Stimulus->V1 |
 (.865) (.865) |
 (.830) (.830) |
| V1->Fusiform |
 (.857) (.857) |
 (.471) (.471) |
| Stimulus moderating V1->Fusiform |
 (.915) (.915) |
 (.478) (.478) |
| Fusiform->M1 |
 (.918) (.918) |
-.067 (-.067) |
| Stimulus moderating Fusiform->M1 |
 (.689) (.689) |
 (.485) (.485) |
Figure 5.
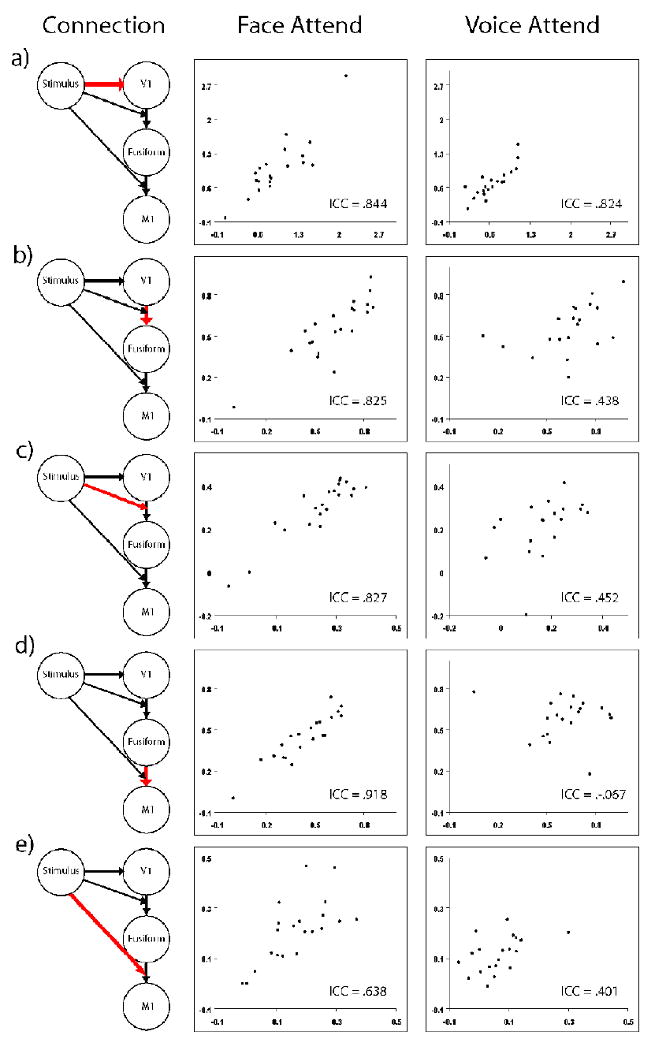
Visual Model DCM Values for Scan 1 and Scan 2. Abscissa is Scan 1 and ordinate is Scan 2, for a visual representation of the reliability of the connections in the visual model estimated with DCM. The connections are (a) Stimulus effect on V1 (b) V1 connection to Fusiform (c) Stimulus modulation of V1 connection to Fusiform (d) Fusiform connection to M1 and (e) Stimulus modulation of Fusiform connection to M1.
Figure 6.
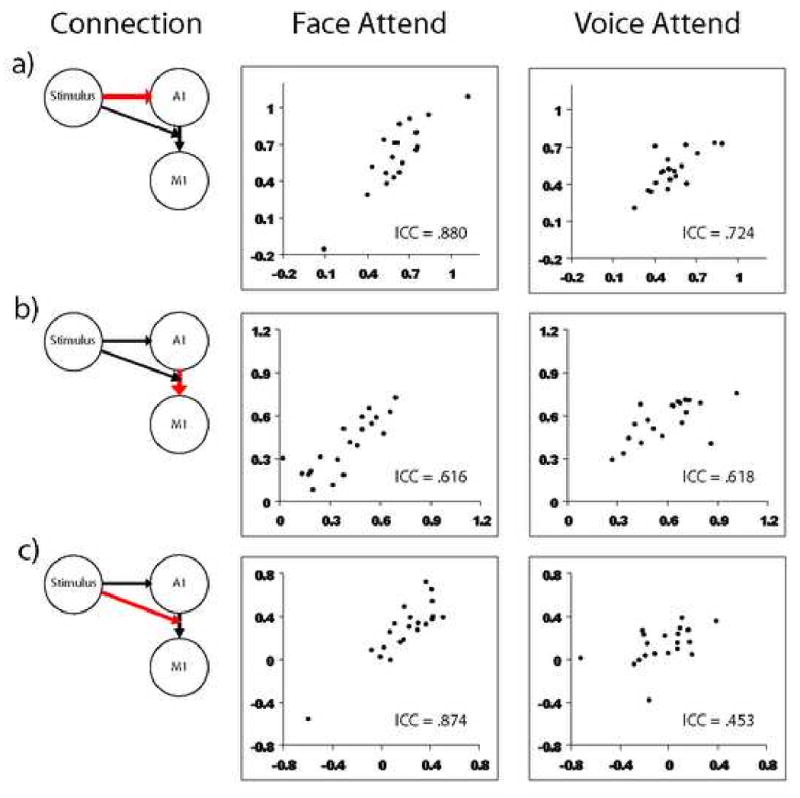
Auditory Model DCM Values for Scan 1 and Scan 2. Abscissa is Scan 1 and ordinate is Scan 2, for a visual representation of the reliability of the connections in the auditory model estimated with DCM. The connections are (a) Stimulus effect on A1 (b) A1 connection to M1 (c) Stimulus modulation of A1 connection to M1.
To measure the scan-rescan reliability of the PSC we took the clusters that were found in the second level analysis and measured the change in signal during the modeled peak in the hemodynamic response compared to baseline. The measure of reliability, the Intraclass Correlation Coefficient, is a number defined on the interval [-1,1] with reliability improving as the ICC approaches 1. ICC values in the range [-1,0] can effectively be treated as zero reliability. The reliabilities are reported in Table 2, and plots of PSC across scans are shown in Figure 4. The reliabilities of the PSC for all four ROI's were consistently in the fair to good range for subjects attending to the voice, and good to excellent range for subjects attending to the face. It is unclear why A1 and M1 have less reliable PSC's in the subjects attending to the voice than the subjects attending to the face, but this disparity is also present in the DCM analysis.
Table 2.
Reliabilities of percent signal change values. Values are color-coded according to Cicchetti's guidelines for reliabilities. ICC<0.40 is poor (black), 0.40 - 0.59 is fair (red), 0.60 -0.74 is good (yellow), and 0.75 to 1.00 is excellent (green.) Percent Signal Change means and standard deviations are also shown. Regions are auditory cortex (A1), visual cortex (V1), fusiform gyrus, and motor cortex (M1.)
| Visual Attentional Focus (n=21) | Auditory Attentional Focus (n=20) | |||
|---|---|---|---|---|
| Region | Intraclass Correlation Coefficient (ICC) | Mean Percent Signal Change (%) | Intraclass Correlation Coefficient (ICC) | Mean Percent Signal Change (%) |
| A1 | .750 | .51 ± .20 | .539 | .51 ± .19 |
| V1 | .761 | .56 ± .31 | .587 | .47 ± .28 |
| Fusiform | .855 | .58 ± 24 | .759 | .41 ± .28 |
| M1 | .703 | .24 ± .16 | .436 | .31 ± 17 |
Figure 4.
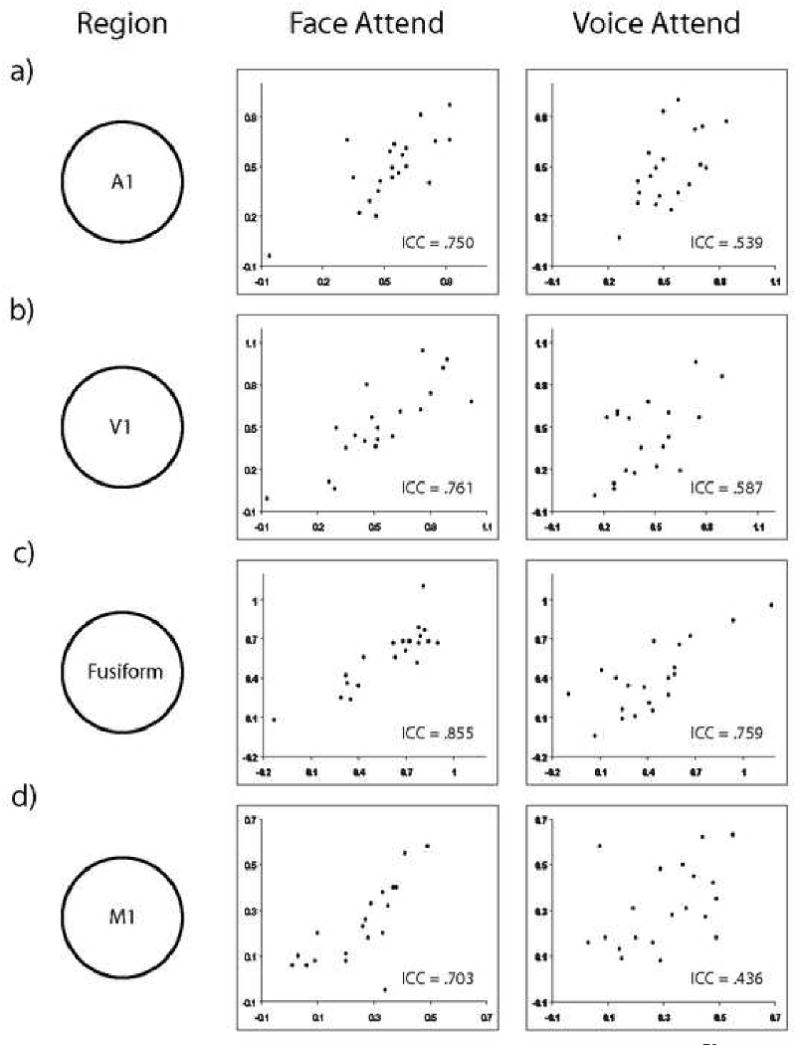
Percent Signal Change Values for Scan 1 and Scan 2. Abscissa is Scan 1 and ordinate is Scan 2, for a visual representation of the reliability of the percent signal change in the four regions used in the analysis.
We then looked for the ability of the DCM analysis to detect differences between groups by testing the interaction of the attentional target with the DCM-estimated connectivity of regions in the two models. In the visual model, three of the five parameters were significantly higher in the subjects that attended to face than the subjects that attended to voice. These were the effect of the stimulus on V1 (p=.033), and both of the stimulus-modulated connections of V1 to Fusiform (p=.018) and Fusiform to M1 (p=.001.) The connection from Fusiform to M1 in the absence of the stimulus was significantly higher in subjects attending to voice than subjects attending to face (p=.001) but the reliability of the voice-attending subjects is very low (ICC=-.067) so results with this parameter are questionable. Both stimulus-modulated connections also showed increases from the first to the second scan (p=.002 for V1 connecting to Fusiform during stimulus presentation and p=.01 for Fusiform connecting to M1 during stimulus presentation.) This accords with the fact that task accuracy significantly increased from the first to the second run in subjects who were attending to the face (from 77.8% to 86.9%, p=.003.) This ability to measure the connection growing stronger as the task is repeated is something that the PSC approach did not demonstrate in this analysis, and speaks to the ability of DCM analysis to detect subtle changes. The PSC analysis showed no differences over time and significant differences between groups only in Fusiform activation (p=.034.)
The auditory model connections calculated in DCM also showed differences between groups. The subjects that attended to the voice showed a stronger connection from A1 to M1 than subjects that attended to face (p=.002), though subjects that attended to face showed a stronger stimulus-modulated connection from A1 to M1 (p=.006), which is the opposite of what we expected. This might have been caused by the less reliable activity of M1 in the subjects attending to the voice. The stimulus-modulated connection from A1 to M1 held to the same pattern as the stimulus-modulated connections in the visual model, becoming stronger from the first to the second scan (p=.000). This is again in agreement with the increase in task accuracy across scans. Connectivity values in either model did not predict task accuracy, most likely because accuracy was very high and there was a ceiling effect. Emotion discrimination accuracy was 83.3 ± 6.7% and 85.5 ± 8.6% for subjects attending to voice (n=21) and face (n=20), respectively.
Discussion
Many creative methods have emerged to extract information from the massive amounts of data produced by neuroimaging studies in order to characterize the functional role of different brain regions. Both methods evaluated here - one that infers stimulus-related activation by using a General Linear Model to relate brain activity to a predetermined hemodynamic response function (HRF) and another that infers causal relationships between activation in different regions from a mechanistic model, are useful approximations and can produce important insights into neural mechanisms. However, the complexity of the translation from neuronal activity to BOLD signal induction might be better-served by the DCM neuronal to BOLD model that allows for flexibility in modeling the shape of the HRF. Also, the inclusion of connectivity information can produce more complete and sensitive information about differential regional activations and their interactions, which can be more reliable than solely main effects from a GLM. This flexibility in the model, combined with a consideration for regional connectivity and the interaction between regional connectivity and external context, allows a greater ability to detect group differences and nuances of the signal. It can be particularly useful in the analysis of models that are more complex, and regions that are not described well by a canonical HRF. When applied to our data, a simple DCM model performs equally well, if not better, than PSC in reproducibility and ability to distinguish between groups with different attentional targets.
The models we used were relatively simple, dealing with well-characterized regions involved in basic neural functions. An important next step will be to test the reliability of results of analyses performed on regions that are less well characterized, but important to our understanding of more complex psychological processes. It would also be useful to test how well these results reproduce on different days, in different scanners, and with different design paradigms. These questions have been addressed for the reliability of percent signal change (Aron 2006, Cohen 1999, Friedman 2006, Friedman 2008, Johnstone et al, 2005, Loubinoux 2001, Waites 2004, Wei 2004) and functional connectivity (Shehzad 2009.) It will be valuable to know the power and limitations of other methods as well.
One of the strengths of the current study is the large number of subjects, which allowed us to look more confidently at the reliability and validity of particular methods and models. However, even if practical constraints limit the number of subjects in a particular study, it would be beneficial to do repeated scans of tasks of interest and use the knowledge of reliability when interpreting the results. It is important to know the limitations of current measures and the extent to which a finding is biased by assumed theoretical neural mechanisms and the characteristics of the measurement itself. We have found that, at least when applied to a simple model of well-characterized regions, DCM performs reliably and appears to be sensitive to group effects. Further studies should be done to confirm its ability to handle with less well-defined networks and more complex brain regions. However, it is an excellent example of the potential of methodology adopted from another field to become a powerful and informative method of answering neuroscientific questions through the analysis of neuroimaging data.
Figure 3.
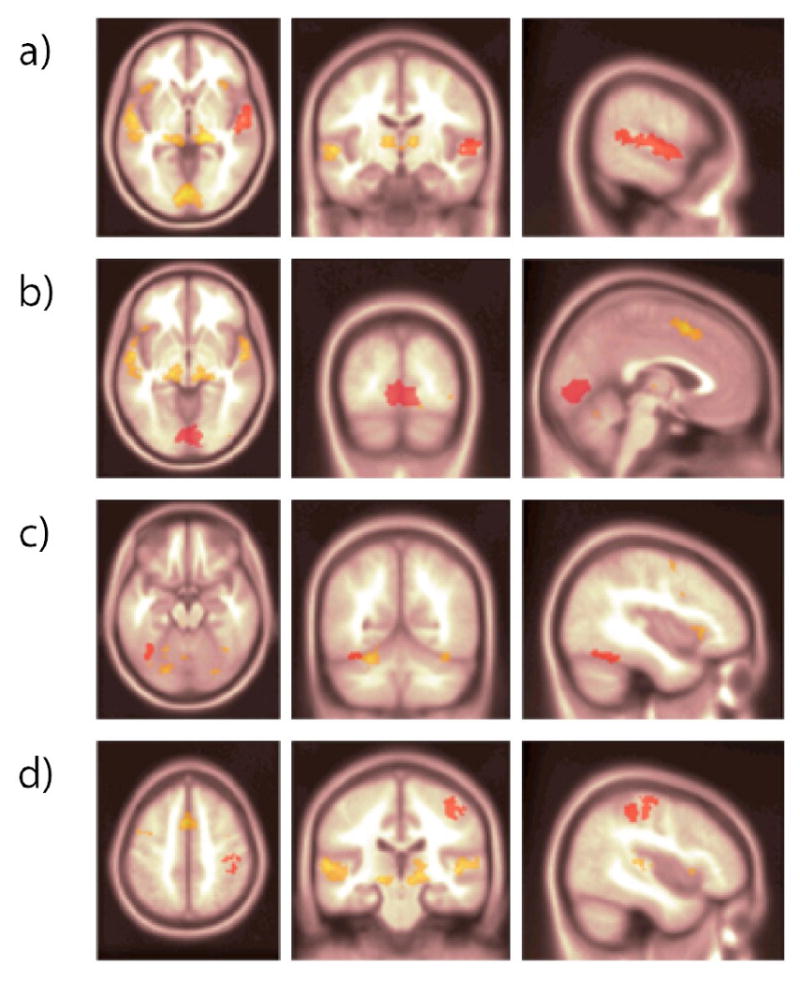
Statistically defined ROI's in MNI space that were subsequently transformed to the native space of each subject. (a) Left Auditory Cortex (A1) (b) Primary Visual Cortex (V1) (c) Right Fusiform Gyrus (d) Left Motor Cortex (M1).
Acknowledgments
The authors thank Ron Fisher, Michael Anderle and Kathleen Ores-Walsh for assistance in data collection. This study was supported by NIH grants R01 MH067167, P50-MH084051, and P30-HD03352.
Footnotes
Publisher's Disclaimer: This is a PDF file of an unedited manuscript that has been accepted for publication. As a service to our customers we are providing this early version of the manuscript. The manuscript will undergo copyediting, typesetting, and review of the resulting proof before it is published in its final citable form. Please note that during the production process errors may be discovered which could affect the content, and all legal disclaimers that apply to the journal pertain.
References
- Aguirre GK, Zarahn E, D'esposito M. The variability of human, bold hemodynamic responses. Neuroimage. 1998 November;8(4):360–369. doi: 10.1006/nimg.1998.0369. [DOI] [PubMed] [Google Scholar]
- Aron AR, Gluck MA, Poldrack RA. Long-term test-retest reliability of functional mri in a classification learning task. NeuroImage. 2006 February;29(3):1000–1006. doi: 10.1016/j.neuroimage.2005.08.010. [DOI] [PMC free article] [PubMed] [Google Scholar]
- Bitan T, Booth JR, Choy J, Burman DD, Gitelman DR, Mesulam Shifts of effective connectivity within a language network during rhyming and spelling. J Neurosci. 2005 June;25(22):5397–5403. doi: 10.1523/JNEUROSCI.0864-05.2005. [DOI] [PMC free article] [PubMed] [Google Scholar]
- Booth JR, Mehdiratta N, Burman DD, Bitan T. Developmental increases in effective connectivity to brain regions involved in phonological processing during tasks with orthographic demands. Brain Research. 2008 January;1189:78–89. doi: 10.1016/j.brainres.2007.10.080. [DOI] [PMC free article] [PubMed] [Google Scholar]
- Booth JR, Wood L, Lu D, Houk JC, Bitan T. The role of the basal ganglia and cerebellum in language processing. Brain Research. 2007 February;1133(1):136–144. doi: 10.1016/j.brainres.2006.11.074. [DOI] [PMC free article] [PubMed] [Google Scholar]
- Caceres A, Hall DL, Zelaya FO, Williams SC, Mehta MA. Measuring fmri reliability with the intra-class correlation coefficient. NeuroImage. 2009 April;45(3):758–768. doi: 10.1016/j.neuroimage.2008.12.035. [DOI] [PubMed] [Google Scholar]
- Cao F, Bitan T, Booth J. Effective brain connectivity in children with reading difficulties during phonological processing. Brain and Language. 2008 November;107(2):91–101. doi: 10.1016/j.bandl.2007.12.009. [DOI] [PMC free article] [PubMed] [Google Scholar]
- Charter RA. Sample size requirements for precise estimates of reliability, generalizability, and validity coefficients. Journal of Clinical and Experimental Neuropsychology. 1999;21(4):559–566. doi: 10.1076/jcen.21.4.559.889. [DOI] [PubMed] [Google Scholar]
- Charter RA. Methodological commentary “Damn the precision, full speed ahead with the clinical interpretations. Journal of Clinical and Experimental Neuropsychology. 2001;23(5):692–694. doi: 10.1076/jcen.23.5.692.1237. [DOI] [PubMed] [Google Scholar]
- Cicchetti DV. Methodological commentary the precision of reliability and validity estimates re-visited: Distinguishing between clinical and statistical significance of sample size requirements. Journal of Clinical and Experimental Neuropsychology. 2001;23(5):695–700. doi: 10.1076/jcen.23.5.695.1249. [DOI] [PubMed] [Google Scholar]
- Cohen MS, Dubois RM. Stability, repeatability, and the expression of signal magnitude in functional magnetic resonance imaging. Journal of Magnetic Resonance Imaging. 1999;10(1):33–40. doi: 10.1002/(sici)1522-2586(199907)10:1<33::aid-jmri5>3.0.co;2-n. [DOI] [PubMed] [Google Scholar]
- Collins DL, Neelin P, Peters TM, Evans AC. Automatic 3D intersubject registration of MR volumetric data in standardized Talairach space. J Comput Assist Tomogr. 1994;18:192–205. [PubMed] [Google Scholar]
- David O, Guillemain I, Saillet S, Reyt S, Deransart C, Segebarth C, Depaulis A. Identifying neural drivers with functional mri: An electrophysiological validation. PLoS Biology. 2008 December;6(12):e315. doi: 10.1371/journal.pbio.0060315. [DOI] [PMC free article] [PubMed] [Google Scholar]
- Dickerson BC, Fenstermacher E, Salat DH, Wolk DA, Maguire RP, Desikan R, Pacheco J, Quinn BT, Van der Kouwe A, Greve DN, Blacker D, Albert MS, Killiany RJ, Fischl B. Detection of cortical thickness correlates of cognitive performance: Reliability across mri scan sessions, scanners, and field strengths. NeuroImage. 2008 January;39(1):10–18. doi: 10.1016/j.neuroimage.2007.08.042. [DOI] [PMC free article] [PubMed] [Google Scholar]
- Devlin JT, Poldrack RA. In praise of tedious anatomy. NeuroImage. 2007 October;37(4):1033–1041. doi: 10.1016/j.neuroimage.2006.09.055. [DOI] [PMC free article] [PubMed] [Google Scholar]
- Dolan RJ, Morris JS, de Gelder B. Crossmodal binding of fear in voice and face. Proceedings of the National Academy of Sciences of the United States of America. 2001;98(17):10006–10010. doi: 10.1073/pnas.171288598. [DOI] [PMC free article] [PubMed] [Google Scholar]
- Ethofer T, Anders S, Erb M, Herbert C, Wiethoff S, Kissler J, Grodd W, Wildgruber D. Cerebral pathways in processing of affective prosody: A dynamic causal modeling study. Neuroimage. 2006 April;30(2):580–587. doi: 10.1016/j.neuroimage.2005.09.059. [DOI] [PubMed] [Google Scholar]
- Fairhall SLL, Ishai A. Effective connectivity within the distributed cortical network for face perception. Cereb Cortex. 2006 December; doi: 10.1093/cercor/bhl148. [DOI] [PubMed] [Google Scholar]
- Feredoes E, Postle BR. Localization of load sensitivity of working memory storage: Quantitatively and qualitatively discrepant results yielded by single-subject and group-averaged approaches to fmri group analysis. NeuroImage. 2007 April;35(2):881–903. doi: 10.1016/j.neuroimage.2006.12.029. [DOI] [PMC free article] [PubMed] [Google Scholar]
- Friedman L, Glover G, Thefbirnconsortiu M. Reducing interscanner variability of activation in a multicenter fmri study: Controlling for signal-to-fluctuation-noise-ratio (sfnr) differences. NeuroImage. 2006 November;33(2):471–481. doi: 10.1016/j.neuroimage.2006.07.012. [DOI] [PubMed] [Google Scholar]
- Friedman L, Stern H, Brown GG, Mathalon DH, Turner J, Glover GH, Gollub RL, Lauriello J, Lim KO, Cannon T, Greve DN, Bockholt HJ, Belger A, Mueller B, Doty MJ, He J, Wells W, Smyth P, Pieper S, Kim S, Kubicki M, Vangel M, Potkin SG. Test-retest and between-site reliability in a multicenter fmri study. Human Brain Mapping. 2007;29:958–972. doi: 10.1002/hbm.20440. [DOI] [PMC free article] [PubMed] [Google Scholar]
- Friston KJ. Bayesian estimation of dynamical systems: an application to fmri. Neuroimage. 2002 June;16(2):513–530. doi: 10.1006/nimg.2001.1044. [DOI] [PubMed] [Google Scholar]
- Friston KJ, Harrison L, Penny W. Dynamic causal modelling. NeuroImage. 2003 August;19(4):1273–1302. doi: 10.1016/s1053-8119(03)00202-7. [DOI] [PubMed] [Google Scholar]
- Friston KJ, Holmes AP, Price CJ, Buchel C, Worsley KJ. Multisubject fmri studies and conjunction analyses. NeuroImage. 1999 October;10(4):385–396. doi: 10.1006/nimg.1999.0484. [DOI] [PubMed] [Google Scholar]
- Goldman-Rakic P. Localization of function all over again. NeuroImage. 2000 May;11(5):451–457. doi: 10.1006/nimg.2000.0575. [DOI] [PubMed] [Google Scholar]
- Grabowski TJ, Damasio AR. Improving functional imaging techniques: the dream of a single image for a single mental event. Proc Natl Acad Sci U S A. 1996 December;93(25):14302–14303. doi: 10.1073/pnas.93.25.14302. [DOI] [PMC free article] [PubMed] [Google Scholar]
- Grefkes C, Eickhoff SB, Nowak DA, Dafotakis M, Fink GR. Dynamic intra- and interhemispheric interactions during unilateral and bilateral hand movements assessed with fmri and dcm. NeuroImage. 2008 July;41(4):1382–1394. doi: 10.1016/j.neuroimage.2008.03.048. [DOI] [PubMed] [Google Scholar]
- Grol MJ, Majdandzic J, Stephan KE, Verhagen L, Dijkerman CH, Bekkering H, Verstraten FA, Toni I. Parieto-frontal connectivity during visually guided grasping. J Neurosci. 2007 October;27(44):11877–11887. doi: 10.1523/JNEUROSCI.3923-07.2007. [DOI] [PMC free article] [PubMed] [Google Scholar]
- Handwerker DA, Ollinger JM, D'Esposito M. Variation of bold hemodynamic responses across subjects and brain regions and their effects on statistical analyses. NeuroImage. 2004 April;21(4):1639–1651. doi: 10.1016/j.neuroimage.2003.11.029. [DOI] [PubMed] [Google Scholar]
- Jenkinson M, Smith S. A global optimisation method for robust affine registration of brain images. Medical Image Analysis. 2001 June;5(2):143–156. doi: 10.1016/s1361-8415(01)00036-6. [DOI] [PubMed] [Google Scholar]
- Jenkinson M, Bannister PR, Brady JM, Smith SM. Improved optimisation for the robust and accurate linear registration and motion correction of brain images. NeuroImage. 2002;17(2):825–841. doi: 10.1016/s1053-8119(02)91132-8. [DOI] [PubMed] [Google Scholar]
- Jezzard P, Balaban RS. Correction for geometric distortion. Magnetic Resonance in Medicine. 1995;34(1):65–73. doi: 10.1002/mrm.1910340111. [DOI] [PubMed] [Google Scholar]
- Johnstone T, Somerville L, Alexander A, Oakes T, Davidson R, Kalin N, Whalen P. Stability of amygdala bold response to fearful faces over multiple scan sessions. NeuroImage. 2005 May;25(4):1112–1123. doi: 10.1016/j.neuroimage.2004.12.016. [DOI] [PubMed] [Google Scholar]
- Johnstone T, van Reekum CM, Oakes TR, Davidson RJ. The voice of emotion: an fmri study of neural responses to angry and happy vocal expressions. Soc Cogn Affect Neurosci. 2006 December;1(3):242–249. doi: 10.1093/scan/nsl027. [DOI] [PMC free article] [PubMed] [Google Scholar]
- Kiebel SJ, Kloppel S, Weiskopf N, Friston KJ. Dynamic causal modeling: Agenerative model of slice timing in fMRI. NeuroImage. 2007;34:1487–1496. doi: 10.1016/j.neuroimage.2006.10.026. [DOI] [PubMed] [Google Scholar]
- Kong J, Gollub RL, Webb JM, Kong JT, Vangel MG, Kwong K. Test-retest study of fMRI signal change evoked by electro-acupuncture stimulation. NeuroImage. 2007;34(3):1171–1181. doi: 10.1016/j.neuroimage.2006.10.019. [DOI] [PMC free article] [PubMed] [Google Scholar]
- Kung CC, Peissig JJ, Tarr MJ. Is Region-of-Interest Overlap Comparison a Reliable Measure of Category Specificity? J Cog Neurosci. 2007;19(12):2019–2034. doi: 10.1162/jocn.2007.19.12.2019. [DOI] [PubMed] [Google Scholar]
- Le TH, Hu X. Methods for assessing accuracy and reliability in functional mri. NMR in Biomedicine. 1997;10(4-5):160–164. doi: 10.1002/(sici)1099-1492(199706/08)10:4/5<160::aid-nbm458>3.0.co;2-a. [DOI] [PubMed] [Google Scholar]
- Lee L, Friston K, Horwitz B. Large-scale neural models and dynamic causal modelling. NeuroImage. 2006 May;30(4):1243–1254. doi: 10.1016/j.neuroimage.2005.11.007. [DOI] [PubMed] [Google Scholar]
- Leontiev O, Buxton RBB. Reproducibility of bold, perfusion, and cmro(2) measurements with calibrated-bold fmri. Neuroimage. 2007 January;35:175–184. doi: 10.1016/j.neuroimage.2006.10.044. [DOI] [PMC free article] [PubMed] [Google Scholar]
- Logothetis NK. What we can do and what we cannot do with fMRI. Nature. 2008;453:869–878. doi: 10.1038/nature06976. [DOI] [PubMed] [Google Scholar]
- Loubinoux I, Carel C, Alary F, Boulanouar K, Viallard G, Manelfe C, Rascol O, Celsis P, Chollet F. Within-Session and Between-Session Reproducility of Cerebral Sensorimotor Activation: A Test-Retest Effect Evidenced With Functional Magnetic Resonance Imaging. J Cerebral Blood Flow and Metabolism. 2001;21:592–607. doi: 10.1097/00004647-200105000-00014. [DOI] [PubMed] [Google Scholar]
- Lundqvist D, Flykt A, Öhman A. The Karolinska Directed Emotional Faces [CD-ROM] Karolinska Institute; Sweden: 1998. [Google Scholar]
- Marreiros AC, Kiebel SJ, Friston KJ. Dynamic causal modelling for fmri: A two-state model. NeuroImage. 2008 January;39(1):269–278. doi: 10.1016/j.neuroimage.2007.08.019. [DOI] [PubMed] [Google Scholar]
- Mechelli A, Crinion JT, Long S, Friston K, Lambon Ralph MA, Patterson K, McClelland JL, Price CJ. Dissociating Reading Processes on the Basis of Neuronal Interactions. Journal of Cognitive Neuroscience. 2005;17(11):1753–1765. doi: 10.1162/089892905774589190. [DOI] [PubMed] [Google Scholar]
- Miller MB, Van Horn JD, Wolford GL, Handy TC, Valsangar-Smyth M, Inati A, Grafton S, Gassaniga MS. Extensive Individual Differences in Brain Activations Associated with Episodic Retrieval are Reliable Over Time. Journal of Cognitive Neuroscience. 2002;148:1200–1214. doi: 10.1162/089892902760807203. [DOI] [PubMed] [Google Scholar]
- Noppeney U, Josephs O, Hocking J, Price CJJ, Friston KJJ. The effect of prior visual information on recognition of speech and sounds. Cereb Cortex. 2007 July; doi: 10.1093/cercor/bhm091. [DOI] [PubMed] [Google Scholar]
- Oakes TR, Johnstone T, Ores Walsh KS, Greischar LL, Alexander AL, Fox AS, Davidson RJ. Comparison of fMRI motion correction software tools. NeuroImage. 2005;28:529–543. doi: 10.1016/j.neuroimage.2005.05.058. [DOI] [PubMed] [Google Scholar]
- Raichle ME, Mintun MA. Brain work and brain imaging. Annu Rev Neurosci. 2006;29:449–476. doi: 10.1146/annurev.neuro.29.051605.112819. [DOI] [PubMed] [Google Scholar]
- Saxe R, Brett M, Kanwisher N. Divide and conquer: a defense of functional localizers. Neuroimage. 2006 May;30 doi: 10.1016/j.neuroimage.2005.12.062. [DOI] [PubMed] [Google Scholar]
- Siman-Tov T, Mendelsohn A, Schonberg T, Avidan G, Podlipsky I, Pessoa L, Gadoth N, Ungerleider LG, Hendler T. Bihemispheric leftward bias in a visuospatial attention-related network. J Neurosci. 2007 October;27(42):11271–11278. doi: 10.1523/JNEUROSCI.0599-07.2007. [DOI] [PMC free article] [PubMed] [Google Scholar]
- Shehzad Z, Kelly AMCM, Reiss PTT, Gee DGG, Gotimer K, Uddin LQQ, Lee SHH, Margulies DSS, Roy AKK, Biswal BBB, Petkova E, Castellanos FXX, Milham MPP. The resting brain: Unconstrained yet reliable. Cerebral cortex. 2009 February; doi: 10.1093/cercor/bhn256. New York, N.Y. : 1991. [DOI] [PMC free article] [PubMed] [Google Scholar]
- Shrout PE, Fleiss JL. Intraclass correlations: Uses in assessing rater reliability. Psychological Bulletin. 1979;86:420–428. doi: 10.1037//0033-2909.86.2.420. [DOI] [PubMed] [Google Scholar]
- Sonty SP, Mesulam, Weintraub S, Johnson NA, Parrish TB, Gitelman DR. Altered effective connectivity within the language network in primary progressive aphasia. J Neurosci. 2007 February;27(6):1334–1345. doi: 10.1523/JNEUROSCI.4127-06.2007. [DOI] [PMC free article] [PubMed] [Google Scholar]
- Spiridon M, Fischl B, Kanwisher N. Location and spatial profile of category-specific regions in human extrastriate cortex. Human Brain Mapping. 2006;27:77–89. doi: 10.1002/hbm.20169. [DOI] [PMC free article] [PubMed] [Google Scholar]
- Stephan KE, Harrison LM, Kiebel SJ, David O, Penny WD, Friston KJ. Dynamic causal models of neural system dynamics: current state and future extensions. Journal of biosciences. 2007 January;32(1):129–144. doi: 10.1007/s12038-007-0012-5. [DOI] [PMC free article] [PubMed] [Google Scholar]
- Stephan KE, Weiskopf N, Drysdale PM, Robinson PA, Friston KJ. Comparing hemodynamic models with dcm. NeuroImage. 2007 November;38(3):387–401. doi: 10.1016/j.neuroimage.2007.07.040. [DOI] [PMC free article] [PubMed] [Google Scholar]
- Waites A, Shaw M, Briellmann R, Labate A, Abbott D, Jackson G. How reliable are fmri?eeg studies of epilepsy? a nonparametric approach to analysis validation and optimization. NeuroImage. 2005 January;24(1):192–199. doi: 10.1016/j.neuroimage.2004.09.005. [DOI] [PubMed] [Google Scholar]
- Wei X, Yoo SS, Dickey CC, Zou KH, Guttmann CRG, Panych LR. Functional MRI of auditory verbal working memory: long-term reproducibility analysis. NeuroImage. 2004 March;21(3):1000–1008. doi: 10.1016/j.neuroimage.2003.10.039. [DOI] [PubMed] [Google Scholar]