Abstract
Quantum dot (QD) fluorescence is effectively quenched at low concentration by nitroxides bearing amine or carboxylic acid ligands. The association constants and fluorescence quenching of CdSe QDs with these derivatized nitroxides have been examined using electron paramagnetic resonance (EPR) and fluorescence spectroscopy. The EPR spectra in the non-protic solvent toluene are extremely sensitive to intermolecular and intramolecular hydrogen bonding of the functionalized nitroxides. Fluorescence measurements show that quenching of QD luminescence is nonlinear, with a strong dependence on the distance between the radical and the QD. The quenched fluorescence is restored when the surface-bound nitroxides are converted to hydroxylamines by mild reducing agents, or trapped by carbon radicals to form alkoxyamines. EPR studies indicate that photoreduction of the nitroxide occurs in toluene solution upon photoexcitation at 365 nm. However, photolysis in benzene solution gives no photoreduction, suggesting that photoreduction in toluene is independent of the quenching mechanism. The fluorescence quenching of QDs by nitroxide binding is a reversible process.
1. Introduction
Semiconductor nanoparticles or “quantum dots” (QDs) are of interest due to their intense and tunable fluorescence, and are increasingly being investigated for tagging, imaging and sensing applications.1-4 QDs are nanoscale crystalline particles usually surrounded by an outer layer of organic ligands to protect them against oxidation and aggregation. Comparisons of QDs to conventional organic fluorophores have been reported.5, 6 The broad interest in fluorescent QDs derives from their flexibility in excitation wavelength, intense and narrow band emission, good photostability relative to organic dyes, and their commercial availability or simple synthetic accessibility.7-9 Applications of nanoparticles in chemical and biosensors has been reviewed recently.10, 11 The controlled quenching of fluorescent QDs has led to the development of probes in biology, medicine, and analytical chemistry as temperature,12 protease-activation,13 DNA,14 spironolactone,15 glucose,16 copper ion,17 anions,18 nitric oxide,19 and catecholamine20 sensors.
Nitroxide free radicals are effective quenchers of the fluorescence of pendent organic fluorophores; these are often referred to as “profluorescent nitroxides”21 (or “pre-fluorescent nitroxides”22). These spin-labeled profluorophores can be “switch-on” when the paramagnetic nitroxide is converted to a diamagnetic species, such as the hydroxylamine or alkoxyamine. Profluorescent nitroxides have been studied for over 20 years and have been utilized as sensors of cationic metals,23 free radical generation in polymer films,24 nitric oxide,25-28 singlet oxygen in plants,29 thiyl,30 superoxide,31, 32 and hydroxyl32, 33 radicals as well as antioxidants,34-38 such as ascorbic acid (vitamin C), trolox, galangin, quercetin, rutin, BHT, gallic acid, caffeic acid and α-tocopherol (vitamin E).
Scaiano et al have investigated the quenching effect of the persistent nitroxide radical 2,2,6,6-tetramethylpiperidine-N-oxide (TEMPO) on the emission of trioctylphosphine oxide (TOPO)-capped CdSe QDs in toluene solution.39 This interaction is non-linear with respect to nitroxide concentration, and strongly dependent on nanoparticle size: smaller particles are quenched more efficiently than larger particles. Significantly, 4-amino TEMPO is a much more efficient quencher compared to non-functionalized TEMPO, due to strong binding to the QD surface.40 The Stern-Volmer quenching plot shows an upward curvature in the case of non-binding TEMPO, whereas the plot for the ligand 4-amino TEMPO is a downward curve. Fluorescence of the 4-amino TEMPO-CdSe QD complex is restored by trapping the nitroxide with the carbon free radical isopropylnitrile, generated by the photoexcitation of azo-bis-isobutyronitrile (AIBN).41 Recently, Guo and co-workers utilize water soluble thioglycolic acid-capped CdTe QDs conjugated to 4-amino TEMPO as the acid/base salt to detect vitamin C.42 This system shows an upward curvature to the Stern-Volmer plot even though 4-amino TEMPO is held near the surface of CdTe QDs by electrostatic interactions.
In this work, the fluorescence quenching efficiency of several nitroxides bound to a CdSe QD surface was examined as a function of proximity of the nitroxide to the ligand and thus to the QD surface, and variation of the ligand binding affinity. The quenching mechanism of the CdSe QD emission by ligated nitroxide radicals in toluene and benzene solutions was explored by combined fluorescence and electron paramagnetic resonance (EPR) studies. These results provide new fundamental insights into the process of fluorescence quenching of QDs by nitroxides as well as electron transfer or spin exchange between QDs and nitroxide radicals.
2. Experimental Section
2.1 General Materials
2,2,6,6-tetramethylpiperidine-N-oxy (TEMPO, Acros, 98%), 4-hydroxy-2,2,6,6-tetramethylpiperidine-N-oxyl (TEMPOL, TCI America, 98%), methanesulfonyl chloride (Acros, 99.5%), sodium azide (Matheson Coleman & Bell), triphenylphosphine (Aldrich, 99%), 4-dimethylaminopyridine (Aldrich, 99%), methyl vinyl ketone (Acros, 95%), 2-nitropropane (Sigma, 98%), tetrabutylammonium fluoride (Acros, 1.0 M in THF containing 5% water), zinc powder (Fisher, 99.0%), ammonium chloride (Fisher, 99.7%), n-butyllithium (Aldrich, 2.5 M in hexanes), cupric acetate (Mallinckrodt), lithium aluminum hydride (Aldrich, 1.0 M in diethyl ether), succinic anhydride (Aldrich, 99%), ethylenediamine (Aldrich, 99%), triethylborane (Aldrich, 1.0 M in THF), sodium borohydride (Aldrich, 98%), 1,4-cyclohexadiene (Acros, 97%), lead dioxide (Acros, 97%), concentrated ammonia (Fisher, 7.4 N), and glacial acetic acid (Fisher, 17.4 N) were used as received. Triethylamine (Fisher, 100.2%) and pyridine (Aldrich, 99.9%) were distilled over calcium hydride. Methyl acrylate (Aldrich, 99%) and styrene (Fisher, 99.9%) were distilled under vacuum immediately before use. Diethyl ether (Fisher, 99.1%) was distilled from sodium/benzophenone. Acetronitrile, dichloromethane, tetrahydrofuran, and toluene were obtained from a PureSolv solvent purification system (SPS) manufactured by Innovative Technologies, Inc. when anhydrous conditions were required. All other solvents were used as received. Manganese salen catalyst was prepared following the procedure of Choudary et al43 Molecular sieves (4 Å, 1.6 mm pellets, Aldrich) were activated by heating in an oven at 200 °C overnight. Flash chromatography was performed on Premium Grade 60, 40-75 mesh silica gel from Sorbent Technology. Analytical thin layer chromatography (TLC) was carried out on Whatman silica gel plates (0.25 nm thick).
2.2 Instrumentation and Methods
1H-NMR spectra were recorded on either a Varian UNITYplus 500 MHz or INOVA 600 MHz spectrometers as noted in CDCl3, and reported in ppm with TMS as an internal standard for proton and the CDCl3 triplet as an internal standard for carbon. FTIR spectra were recorded on a Perkin-Elmer 1600 FTIR spectrometer. High-resolution mass measurements were obtained on a benchtop Mariner electrospray ionization time-of-flight (ESI-TOF) mass spectrometer. EPR measurements were performed on a Bruker X-band EPR spectrometer using 707-SQ EPR tubes (Wilmad) in anhydrous toluene except as noted. EPR settings were 20 mW for the microwave power and 1.0 G for the modulation width. Absorption spectra were recorded on a Hewlett Packard 8452A diode array spectrometer. Fluorescence spectra were taken on a Perkin-Elmer LS 50B fluorescence spectrometer with an excitation wavelength of 390 nm. The emission slit was set at 5 nm, and fluorescence emission (λmax = 594 nm) was collected from 450 to 700 nm. For the emission spectra of QDs taken at a series of quencher concentrations, after the addition of the quencher, the solution was shaken for 60 seconds before the emission spectrum was taken. Samples were prepared with anhydrous toluene and placed in an open-sided 1 cm path-length quartz cuvette for both absorption and emission measurements. All air and moisture sensitive reactions were carried out under nitrogen atmosphere using oven dried syringe and flame-dried glassware. Thin layer chromatography (TLC) visualization was performed with a UV lamp visualized at 254 nm and after heating with p-anisaldehyde dip (PAA: 2.5 mL of p-anisaldehyde in 40 mL of 90:5:1 ethanol:concentrated sulfuric acid:glacial acetic acid). All fluorescence photos were taken under UV illumination produced by a UVGL-25 366 nm wavelength handheld TLC lamp. Photoexcitation experiments were performed with a UVL-56 365 nm wavelength hand-held TLC lamp. All spectroscopic studies were carried out in aerated solution at room temperature except as noted. Non-linear curve fitting was performed either with KaleidaGraph or OriginPro 8.0 programs. Bond lengths of nitroxide molecules were calculated from Molecular Mechanics calculations version 2 (MM2) embedded in Chem3D Ultra 8.0® software.
2.3 Synthesis of CdSe Quantum Dots
The synthesis of the CdSe QDs was based on the hot injection organometallic route described previously.44, 45 Standard air-free conditions were followed on a Schlenk line with nitrogen gas as the inert atmosphere. For the preparation of CdSe QDs, 2.29 g (5.92 mmol) of trioctylphosphine oxide (TOPO), 2.17 g (7.80 mmol) of tetradecylphosphonic acid (TDPA), 5.71 g (23.6 mmol) of hexadecylamine, and 500 mg (3.89 mmol) of cadmium oxide (CdO) were added to a 50 mL three-neck flask. The solids were heated to 130 °C under a flow of nitrogen with continuously stirring. At 130 °C, the solution was treated under vacuum at 30 millitorr to three successive degassing cycles on a nitrogen line over 1 hour. The nitrogen flow was resumed and the solution was heated. At 260 °C, the CdO-TDPA complex formed, and the solution appeared optically clear with a slight yellowish tint. At 270 °C, 1.00 g (1.22 mL, 4.88 mmol) of tributylphosphine (TBP) was injected into the mixture with vigorous stirring. The temperature was lowered slightly and held at 260 °C. Selenium tributylphosphine (1.6 g, 20% by weight of Se in TBP) was injected into the mixture at 260 °C: subsequent growth was monitored by UV-vis and photoluminescence spectrophotometry. Growth was stopped by the removal of the heating mantle after 4 minutes at 260 °C to give material exhibiting an excitonic peak at 576 nm, a band edge emission peak at 583 nm, and an emission full-width-half-maximum (FWHM) of 23 nm. The solution was allowed to cool to 60 °C and 8 mL of anhydrous methanol was added to precipitate the CdSe QDs. Centrifugation was carried out at 3000 rpm: the supernatant was discarded. To remove unreacted precursors, 6 mL of octanoic acid was added and the mixture was sonicated and vortexed until the solution became optically clear. A minimum amount of anhydrous methanol was slowly added to precipitate the CdSe QDs. The resulting slightly opaque solution was centrifuged at 3000 rpm and the supernatant discarded. The CdSe solid was redissolved in anhydrous toluene, and precipitated and decanted twice more; the CdSe QDs were then dried under a flow of nitrogen. The CdSe QD solids were dissolved in anhydrous toluene, and concentrations and average size of the QDs were obtained from UV-visible absorption measurements following the calibration reported by Yu, W. W., et al46 The standard deviation of the extinction coefficient values reported by these authors for QDs is ±15%, thus all the QD concentrations reported in this work are affected by this uncertainty. The low (23 nm) FWHM of the 583 nm emission indicates that the samples were narrow in size distribution.
3. Results and Discussion
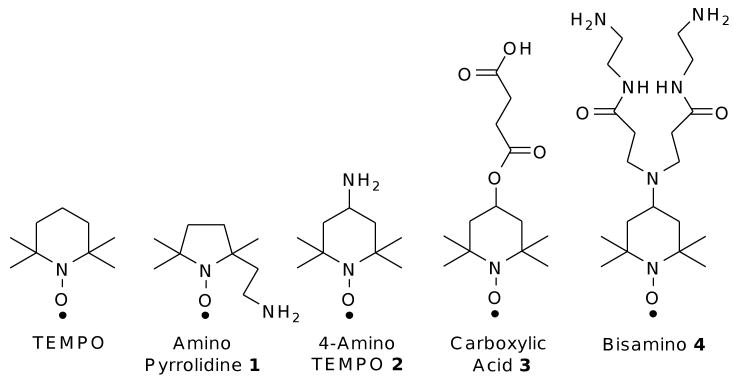
The parent nitroxide TEMPO, and four nitroxides (1-4) bearing amino or carboxylic acid ligands (Fig. 1) were investigated in EPR and fluorescence spectroscopy studies.
Figure 1.
Nitroxides utilized in EPR and fluorescence studies
3.1 EPR studies
3.1.1 Binding affinities
The characteristic EPR spectra of TEMPO-based nitroxides exhibit three 14N hyperfine lines separated by a splitting of 1.546 mT in toluene or benzene solutions.47 EPR investigations on the interaction between the non-functionalized nitroxide TEMPO and CdSe QDs by Scaiano et al39 suggest that no specific binding occurs between TEMPO and the QDs: the N coupling constant, line width and amplitude of the TEMPO signal remains unchanged upon addition of QDs. However, addition of QDs to a solution of 4-amino TEMPO leads to extensive broadening of the EPR signal and to a lower relative intensity of the high field signal.40 EPR spectra of the ligand-bearing nitroxides 1-4 in deaerated toluene show the expected characteristic 14N hyperfine splitting as illustrated in Fig. 2A-D (red lines). Deaerated conditions are necessary to avoid line broadening caused by dissolved oxygen, thus allowing the accurate determination of binding constants.
Figure 2.
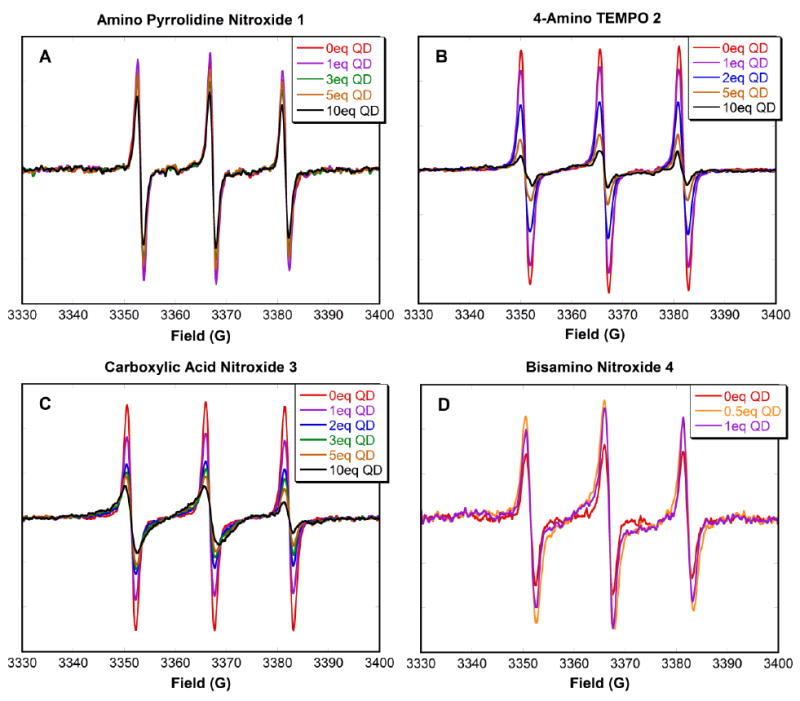
Figure 2A-D. EPR spectra of nitroxides 1-4 (0.5 μM) in deaerated toluene upon successive addition of a solution of 3.7 nm CdSe QDs. (Note: eq = equivalents)
Successive addition of orange 3.7 nm diameter CdSe QDs to a solution of 4-amino TEMPO 2 or carboxylic acid nitroxide 3 led to broadening of the EPR signals, accompanied by a reduction in peak-to-peak height, particularly at the high field peak. For example, upon addition of 10 equivalents of CdSe QDs to carboxylic acid nitroxide 3 (Fig. 2C, black line), the two peaks at low and central fields are strongly broadened, and the peak-to-peak height at the high field peak is much smaller than those at central and low fields. This broadening is indicative of restricted mobility and slow tumbling of the nitroxide, as a result of binding to the QD surface.41 This type of behavior in the EPR spectrum has been previously observed with nitroxides bound to gold nanoparticles,48 incorporated into DNA stands,49 and immersed in lipid membranes.50, 51
In order to measure binding constants (Kb), saturation curves for 4-amino TEMPO 2 and carboxylic acid nitroxide 3 interacting with CdSe QDs were obtained. The fraction of bound nitroxide (θ) is defined in equation (1), where [N] is the nitroxide concentration, and [QN] is the concentration of the QD-nitroxide complex.
| (1) |
By applying the equation for the dissociation constant (Kd) from equation (2) where [Q] is the concentration of unbound QDs ([Qadded]-[Qbound]), an equation involving only [Q] and Kd is obtained as shown in equation (3), assuming there is no cooperative effect.
| (2) |
| (3) |
θ was determined using the relative peak heights at high field observed in the EPR spectra. The plots between θ and [Q] provided saturation curves for each nitroxide. The Kd values were obtained by curve fitting (see SI; Fig. S1-S2). The binding constant (Kb) is the reciprocal of Kd. Kb values for 4-amino TEMPO 2 and carboxylic acid nitroxide 3 are (4 ± 2) × 105 and (2 ± 1) × 106 M-1, respectively. A relative error of ±15% is assumed due to the inherent error in evaluating the QD concentrations.
Amino moieties are known to stabilize QDs.52-54 In previous work, Scaiano et al have shown that 4-amino TEMPO 2 binds efficiently to 2.4-2.5 nm CdSe QDs with a binding constant of (8 ± 4) × 106 M-1.41 The binding constant obtained in this study for 4-amino TEMPO 2 with 3.7 nm CdSe QDs is an order of magnitude lower than that previously reported. One should keep in mind that the 3.7 nm QDs and the 2.4-2.5 nm QDs were prepared using different procedures, including the use of tributylphosphine instead of trioctylphosphine for the larger QDs. Thus, the surface properties of these CdSe QDs are expected to be different as a result of variation in the synthetic conditions as well as particle size.55 It is interesting that carboxylic acid functionalized nitroxide 3 shows a greater affinity by an order of magnitude than the amino-substituted nitroxide 2. The ability of carboxylic acids to bind to the surface of CdSe nanoparticles56 is not well explored, and warrants further study.
Amino pyrrolodine nitroxide 1 was expected to show a similar binding affinity to that of 4-amino TEMPO 2, as they both bear amine functionalities. Bidentate bisamino nitroxide 4 was expected to bind more strongly to the QD surface than the monoamine counterparts. Unexpectedly, solutions of nitroxide 1 and 4 showed large discrepancies between the known molarities and the concentrations determined by EPR when calibrated using TEMPO as a standard. In the case of amino pyrrolidine nitroxide 1, the difference between the two concentrations was a factor of four. Addition of 10 equivalents (based on EPR nitroxide calibration) of QDs was not enough to produce a significant decrease in the EPR signal (Fig. 2A, black line). Bisamino nitroxide 4 showed an entire order of magnitude discrepancy between the known molarity and the calibrated concentration, and an initially puzzling increase in the EPR signal intensity upon addition of QDs (Fig. 2D), vide infra. For all four nitroxides, the purities of the nitroxide samples were confirmed by NMR of the corresponding hydroxylamines (reduced in situ using phenylhydrazine). Before EPR experiments, the nitroxide samples were oxidized with PbO2 to ensure that the entire sample was nitroxide rather than hydroxylamine. The lower apparent concentration of nitroxide by EPR implies that there is an interaction between nitroxides in solution. This is discussed further in the next section.
3.1.2 Competition studies and evidence of hydrogen bonding interactions
Competition studies were performed by the addition of competitive ligands with similar binding functionalities. Benzylamine and 4-phenylbutyric acid were used as competitors of amine and carboxylic acid functionalized nitroxides 2 and 3, respectively. In the first set of competition experiments, CdSe QDs were added to a mixture of nitroxide and a large excess (6 × 10⁵ equivalents) of competitor. EPR spectra were taken at t = 0 (immediately upon addition of the QDs) and t = 4 hrs. The EPR signal intensity was expected to decrease upon addition of the QDs, but not as much as in the absence of the competitor. However, the EPR signal of a mixture of 4-amino TEMPO 2, benzylamine, and QDs (Fig. 3A, red line) increased above the original signal of 4-amino TEMPO 2 (Fig. 3A, black line). After 4 hours, the intensity had not changed (Fig. 3A, blue line). Fig. 3B shows the results of a similar competition between carboxylic acid nitroxide 3 and 4-phenylbutyric acid. An increase in signal intensity was again observed (Fig. 3B, red line), but was not as pronounced as that of 4-amino TEMPO 2. After 4 hours, the intensity dropped below the original nitroxide signal (Fig. 3B, blue line), indicating that eventually some of the carboxylic acid nitroxide 3 became bound to the QD surface.
Figure 3.
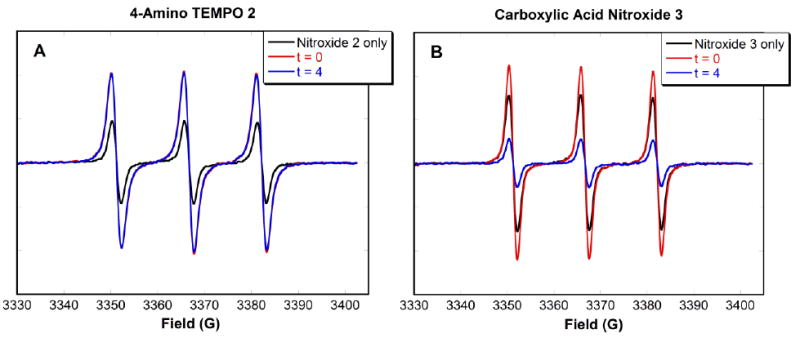
EPR spectra of a mixture of (A) 4-amino TEMPO 2 and (B) carboxylic acid nitroxide 3 (0.5 μM) with CdSe QDs (2 μM) and a large excess of the corresponding competitor (6 × 10⁵:1 moles of competitor:nitroxide) in deaerated toluene. Spectra were taken at t = 0 and 4 h.
In the second set of competition experiments, EPR spectra of a mixture of nitroxide and CdSe QDs were taken at t = 0, and t = 4 h in the absence of competitor. A large excess (6 × 10⁵ equivalents) of competitor was then added at t = 4 h, and the spectra were taken at t = 8 h. In the case of 4-amino TEMPO 2, upon addition of CdSe QDs at t = 0 h the EPR intensity decreased as expected (Fig. 4A, red line), and continued to decrease as presumably more nitroxides became bound by t = 4 h (Fig. 4A, blue line). However, four hours after the addition of benzylamine, at t = 8 h, the signal intensity increased dramatically (Figure 4A, purple line). This increase in signal was similar to that seen in the first set of competition experiments. In contrast, carboxylic acid nitroxide 3 showed the expected behavior: the signal intensity decreased upon addition of CdSe QDs, and continued to do so at t = 4 h (Figure 4B, red and blue lines). Four hours after 4-phenylbutyric acid was added (t = 8 h), the EPR intensity has increased (Figure 4B, purple line), but not beyond the initial value. These results indicate that some of the nitroxides on the QD surface were displaced by the added competitor.
Figure 4.
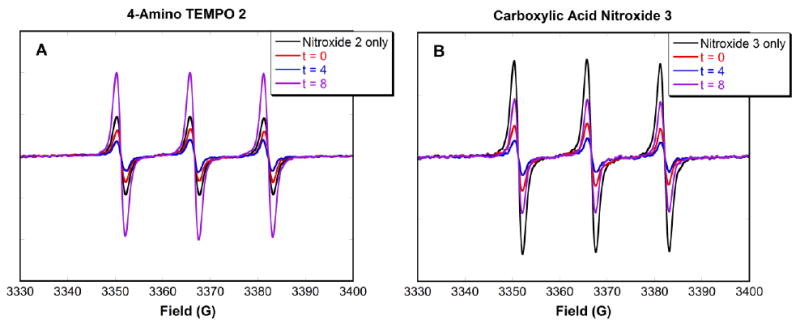
EPR spectra of a mixture of (A) 4-amino TEMPO 2 and (B) carboxylic acid nitroxide 3 (0.5 μM) with CdSe QDs (2 μM) in deaerated toluene. Spectra were taken at t = 0 and 4 h. At t = 4 h, a large excess of their corresponding competitors (6 × 10⁵:1 moles of competitor:nitroxide) was added, and spectra were taken at t = 8 h.
Addition of a large excess (6 × 10⁵ equivalents) of benzylamine to bisamino nitroxide 4 (in the absence of CdSe QDs) also resulted in an increase in the EPR signal intensity similar to that observed with 4-amino TEMPO 2; however bisamino nitroxide 4 gave an even more dramatic change (see SI; Fig. S3). As a control, the EPR signal of the non-functionalized nitroxide TEMPO did not show any effect from the addition of benzylamine (see SI; Fig. S4), indicating that the functional groups attached to the nitroxide molecules play an important role in the unexpected signal enhancement. It is likely that this behavior is due to significant intermolecular hydrogen bonding between the nitroxide oxygen and the amine or carboxylic acid functional groups in the non-protic solvent toluene. This type of hydrogen bonding between functionalized nitroxides has been observed by EPR even under fairly dilute solutions of nitroxides containing carboxylic acid,57-59 lactam,58 hydroxyl,60 and oxime groups.61 EPR evidence for intramolecular hydrogen bonding has also been reported in the case of hydroxy-substituted nitroxides.62-65 Nitroxides also form hydrogen bonds with a variety of other proton donating molecules.66-68
Additional evidence for intermolecular hydrogen bonding with 4-amino TEMPO 2 and bisamino nitroxide 4 was provided by EPR measurements in p-xylene at 125 K (Fig. 5A and 5B). At this temperature, exchange interactions should be limited; dipolar interactions through space should be the major effect on the signal. Without benzylamine, both nitroxide EPR signals were significantly broadened (red lines), indicating that nitroxide free radicals self-associate, resulting in spin-spin coupling interactions. Upon addition of benzylamine, the EPR peaks became sharper, and stronger in intensity (blue lines), resulting from interruption of self-association by the benzylamine. This phenomenon of hydrogen bonding explains the discrepancy between the known molarity and the calibrated concentrations of the nitroxides, as well as the increase in the EPR signal intensity beyond the original level when the competitor was added. In solution, EPR hyperfine lines from the nitroxide dimers or multimers are significantly broadened and thus become silent relative to the monomer species. The EPR signal of amino pyrrolidine nitroxide 1 showed only small changes upon addition of CdSe QDs, presumably due to the seven membered-ring intramolecular hydrogen bond between the nitroxide oxygen and the tethered amine. The most dramatic effect of hydrogen bonding occurs with bisamino nitroxide 4 as bidentate intermolecular hydrogen bonding is possible. Because association constants are derived from the equilibrium between the monomer nitroxides and the QD bound species, the monomer concentrations were determined from integration of the sharp line EPR spectra.
Figure 5.
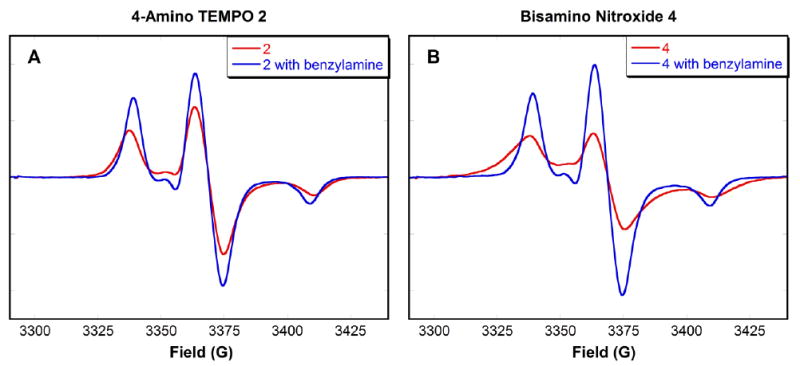
Figure 5A-B. EPR spectra of a mixture of 4-amino TEMPO 2 (50 μM) or bisamino nitroxide 4 (200 μM) with and without benzylamine (6 × 10⁵:1 moles of benzylamine:nitroxide) in deaerated p-xylene. Spectra were recorded at 125 K.
3.1.3 Time studies
A series of time studies were performed concurrently via EPR and fluorescence spectroscopies to correlate the change in the amount of bound nitroxide with the change in fluorescence quenching. Spectra of a 1:4 mixture of carboxylic acid nitroxide 3 and CdSe QDs in toluene were taken every 30 minutes for 4 hours. The decrease in the EPR peak intensity showed that the free nitroxides continued to convert into bound species over the 4 hour period (Fig. 6A). The signal was still changing at the end of 4 hours, indicating that equilibrium had not yet been reached. Similarly, fluorescence spectra showed a decrease in intensity over the 4 hour period (Fig. 6B), resulting from an increase in fluorescence quenching as more nitroxides bonded to the QD surface. Again, the process had not reached a plateau at the end of 4 hours. This demonstrates a strong correlation between binding affinity and quenching efficiency, which although not completely linear, does follow the same trend. This experiment also implies that the measurements used for the determination of the binding constant were taken significantly before the system reached equilibrium. To determine how this affects the value of the binding constant, EPR spectra of carboxylic acid nitroxide 3 with different concentrations of CdSe QDs were taken after each aliquot was allowed to equilibrate for 24 hours. The signal intensities were greatly reduced (Fig. 7) compared to those taken immediately after the addition of QDs (Fig. 2B). As a control, the EPR signal intensity of carboxylic acid nitroxide 3 without CdSe QDs after 24 hours was unchanged (see SI; Fig. S5). This time requirement to reach equilibrium influences the determination of the binding constant. The binding constant for carboxylic acid nitroxide 3 calculated from the saturation curve taken after 24 hours is Kb = (8 ± 4) × 106 M-1: four times greater than the previous value.
Figure 6.
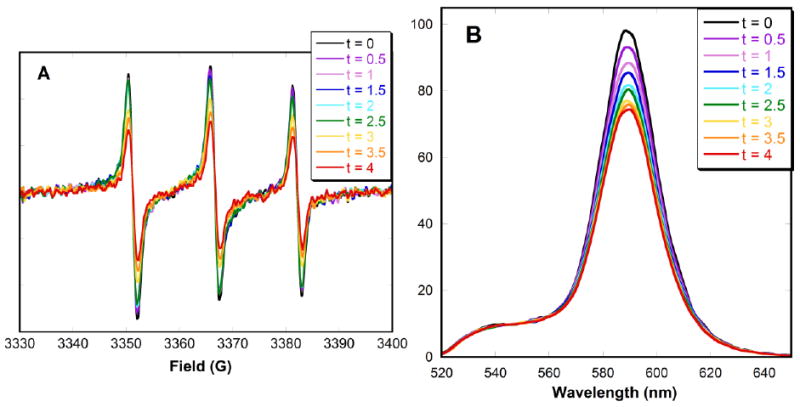
(A) EPR and (B) fluorescence spectra of carboxylic acid nitroxide 3 (0.5 μM) with CdSe QDs (2 μM) in deaerated toluene. Spectra were taken every 30 minutes for 4 hours.
Figure 7.
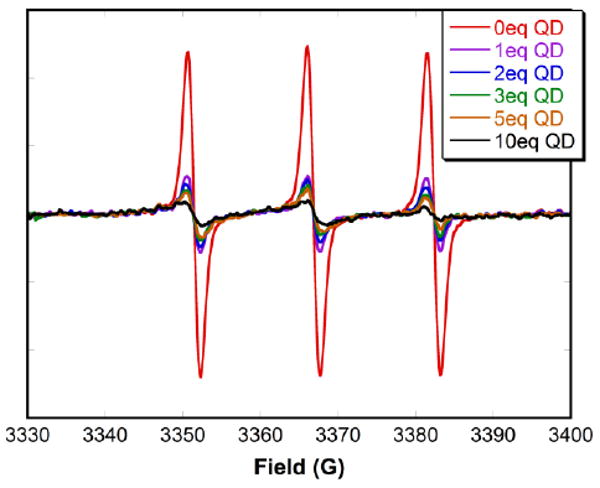
EPR spectra of carboxylic acid nitroxide 3 (0.5 μM) in deaerated toluene with different concentrations of CdSe QDs. Spectra were taken after each aliquot was allowed to equilibrate for 24 hours.
3.2 Fluorescence quenching efficiency
It has been reported that the quenching of CdSe QD luminescence by 4-amino TEMPO 2 occurs at a concentration at least 3 orders of magnitude lower than that required for TEMPO.39, 40 Stern-Volmer plots for the fluorescence quenching by TEMPO are characterized by positive deviations from linearity while negative deviations are observed in the case of 4-amino TEMPO 2, attributed to amine binding to the QD surface. The addition of an excess of binding nitroxide to CdSe QDs resulted in a dramatic decrease in fluorescence that can be observed by the naked eye. For example, in Fig. 8 QD luminescence in the presence of carboxylic acid nitroxide 3 (on the left) was effectively quenched, while the vial in the presence of TEMPO (in the middle) looked the same as the control in the absence of nitroxide (on the right).
Figure 8.
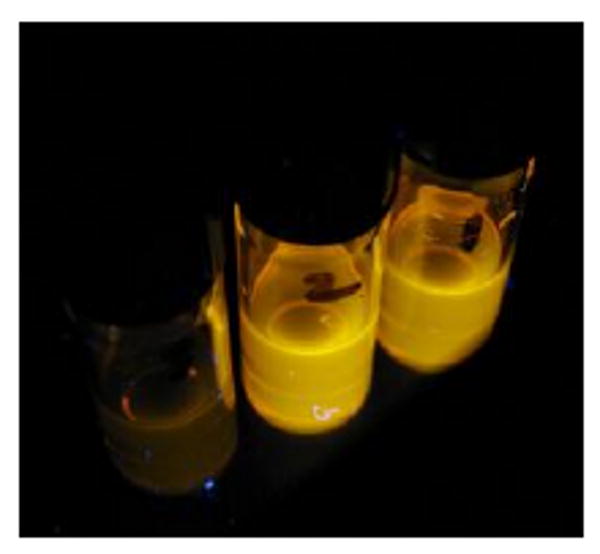
Luminescence of 5 μM CdSe QDs in toluene in the presence of (from left to right): carboxylic acid nitroxide 3 (2500:1 moles of nitroxide 3:QDs), TEMPO (2500:1 moles of TEMPO:QDs), and no additive upon illumination with a TLC lamp at 366 nm.
The emission spectra of CdSe QDs in the absence and presence of increasing concentrations of the functionalized nitroxides 1-4 are shown in Fig. 9A-D. Fluorescence intensities decreased as the concentration of nitroxide increased. Quenching was noticeable upon addition of the first equivalent of nitroxide, consistent with the very high binding constants for these QD-nitroxide complexes. At high concentration of nitroxide, subsequent addition of additional nitroxide resulted in only a small decrease in photoluminescence. Scaiano et al have offered a satisfying explanation: at low concentration, nitroxides are able to bind easily by filling vacancies in the layer of ligands covering the QD surface. However at high concentration, binding requires the displacement of existing ligands on the QD surface; subsequent substitution becomes increasingly more difficult.39 From the magnitude of the fluorescence intensity, it is evident that the emission of the CdSe QDs is quenched most effectively by 4-amino TEMPO 2, followed by carboxylic acid nitroxide 3 and amino pyrrolidine nitroxide 1; quenching is least effective by bisamino nitroxide 4. In all cases, addition of 2000 equivalents of nitroxide was not sufficient to suppress the luminescence completely. A slight blue shift was observed with each addition of nitroxide solution. This may be attributed to a small decrease in the QD size, possibly due to dissolution upon dilution.
Figure 9.
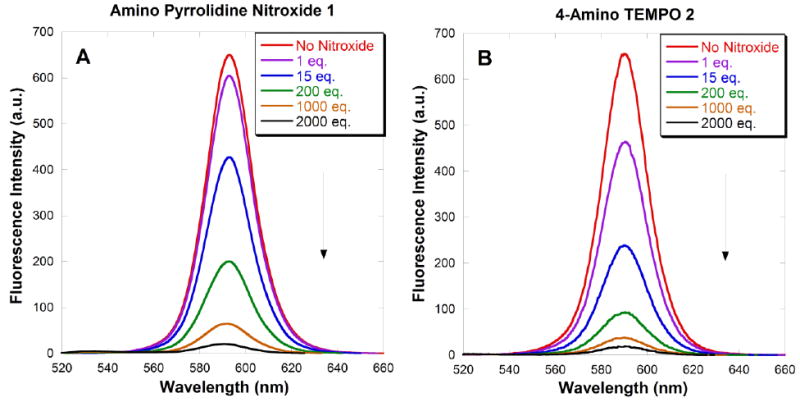
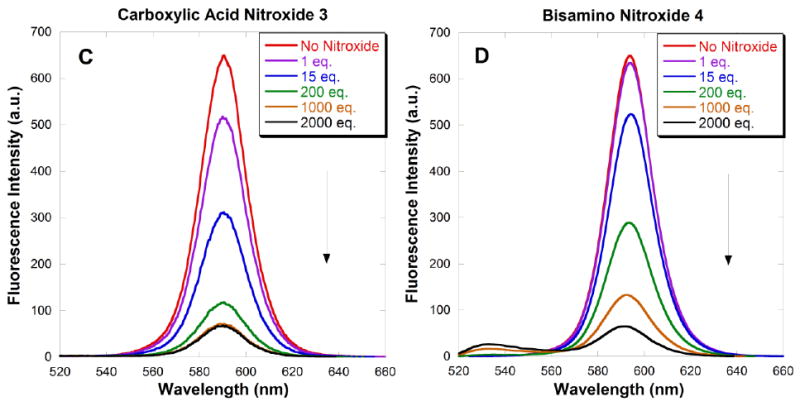
Figure 9A-D. Fluorescence emission spectra (λex = 390 nm) of toluene solutions of 3.7 nm CdSe QDs (0.4 μM) quenched by increasing amounts of added nitroxides 1-4. Spectra were taken 60 seconds after addition of each aliquot.
Quenching efficiency is conveniently measured by the concentration of nitroxide required to achieve a 50% reduction in the emission intensity, as shown in Table 1. 4-Amino TEMPO 2 is three times more effective as a quencher than carboxylic acid nitroxide 3, which is in turn an order of magnitude more effective than amino pyrrolidine nitroxide 1 and bisamino nitroxide 4. These results are inconsistent with the binding affinities for 4-amino TEMPO 2 and carboxylic acid nitroxide 3; however the quenching efficiencies correspond to the proximity of the nitroxide radicals to the QD surfaces. Molecular mechanics calculations (MM2) were used to estimate lengths from the nitroxide oxygen atom to the ligand functionality: for nitroxides 1-4, the distances were 4.7, 5.6, 8.0 and 11.1 Å, respectively. Although carboxylic acid nitroxide 3 has a higher binding affinity to the QDs than 4-amino TEMPO 2, nitroxide 2 holds the nitroxide moiety closer to the QD surface. The long tether of bisamino nitroxide 4 holds the nitroxide moiety remote to the QD surface, and hence is the least effective quencher. A similar distance-dependence has been observed in the intramolecular quenching between nitroxides and organic dyes.29, 69 Amino pyrrolidine nitroxide 1 was expected to be an excellent quencher due to the short and flexible tether between the primary amine and the nitroxide; however intramolecular hydrogen bonding interactions dramatically diminishes binding and/or quenching efficiency, such that it is even less effective than carboxylic acid nitroxide 3. Thus nitroxide quenching efficiency depends on both the binding affinity and the proximity of the nitroxide moiety to the QD surface; the proximity effect dominates. Moreover, hydrogen bonding also contributes to the quenching efficacy.
Table 1.
Concentrations of nitroxides 1-4 required to reduce the luminescence of 0.4 μM CdSe QDs in toluene by 50%.
| Nitroxides | Concentration for Io/I = 2 (M) |
|---|---|
| Amino Pyrrolidine 1 | 1.9× 10⁻⁵ |
| 4-Amino TEMPO 2 | 2.0 × 10⁻⁶ |
| Carboxylic Acid 3 | 6.3 × 10⁻⁶ |
| Bisamino 4 | 5.7 × 10⁻⁵ |
The quenching efficiency can also be analyzed by plotting the fluorescence intensity at the maximum wavelength as a function of nitroxide concentration in a Stern-Volmer fashion as shown in Fig. 10A. Deviations from linearity are attributed to a combination of static and dynamic quenching, and to the differential binding of the quenchers to the QD surface.70 Positive deviations (upward curvature) are predicted by several related models, including the transient effect model71 for diffusion-controlled reactions; the sphere of action model70, 72 in which quenching results from the quencher molecule lying immediately adjacent to the fluorophore at the moment of excitation; the dark complex model73 relying on proximity but no specific physical contact, and the distance-dependent quenching model.74 Negative deviations (downward curvature) have been observed in the fluorescence quenching of CdSe QDs by n-butylamine75, 76 as a hole acceptor, and by boronic acid-substituted viologen quenchers.16 Upward and downward curvatures have been reported for the quenching of CdSe QD fluorescence by non-binding and binding nitroxides, respectively.40
Figure 10.
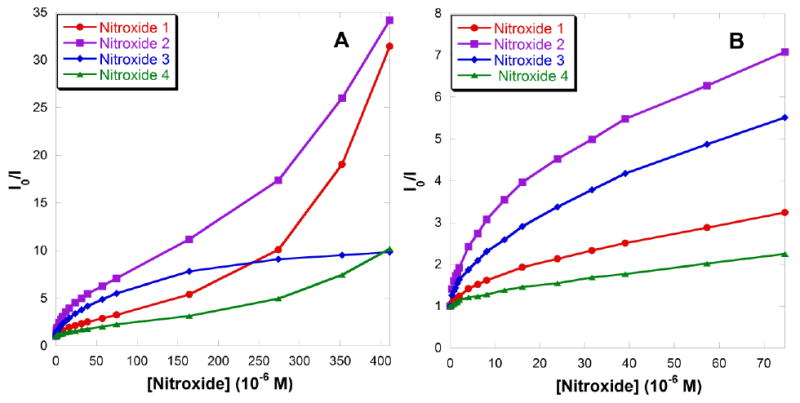
(A) Stern-Volmer plots of fluorescence quenching by nitroxides 1-4 at the emission maximum of 594 nm. (B) Enlargement for [nitroxide] < 77 μM; I = observed fluorescence intensity, Io = fluorescence intensity with no nitroxide.
As dynamic quenching also contributes to fluorescence quenching by the ligand-bearing nitroxides,42 the downward curvatures observed in Fig. 10B are likely due to a combination of dynamic and static quenching, whereas the upward curvature is associated only with dynamic quenching. The data showing a downward curvature (data at low concentrations for nitroxides 1, 2 and 4 and the entire curve for carboxylic acid nitroxide 3 in Fig. 10B) can be fit by a “multi-binding-site” model: equation (4) as reported by Guo et al 42 (see SI; Fig. S6, S8, S10 and S11), where KD is the dynamic quenching constant, KS is the static quenching constant, [nitroxide]0 is the initial concentration of the nitroxide, and n is the average number of immediately available empty binding sites on the QD surface. This modified Stern-Volmer model gives R2 values higher than 0.99, a much better fit than the “sphere of action” model.
| (4) |
An exponential dependence described by equation (5) is observed for the upward curvatures seen at high concentrations for nitroxides 1, 2 and 4, as previously reported for the non-binding nitroxide TEMPO39 where A is the amplitude and α is the dynamic quenching constant (see SI; Fig. S7, S9 and S12).
| (5) |
As summarized in Table 2, it is evident that fluorescence quenching by the ligand-bearing nitroxides 1-4 is predominantly due to a static quenching mechanism, as KS values are much greater than KD values. 4-Amino TEMPO 2 has a higher value of KS than that of carboxylic acid nitroxide 3 due to the close proximity of the radical when it is bound to the QD surface. The low KS value for amino pyrrolidine nitroxide 1 is due to intramolecular hydrogen bonding between the nitroxide oxygen and the amine tethered by a flexible linker. The dynamic quenching efficiencies of amino-substituted nitroxides 1 and 2 are also indicated by the α values at high concentrations, as observed by the upward curvature of the Stern-Volmer plots. This may be understood in terms of the greater mobility of smaller nitroxides 1 and 2 compared to that of carboxylic acid nitroxide 3. The enhanced rotation of smaller molecules facilitates fluorescence quenching even when the nitroxides are not bound to the QD surface. The total effect makes 4-amino TEMPO 2 the most effective quencher, followed by carboxylic acid nitroxide 3 and amino pyrrolidine nitroxide 1, respectively.
Table 2.
Dynamic quenching constants (KD) and static quenching constants (KS) of nitroxides 1-4, average number of immediately available empty binding sites (n) on the QD surface, and dynamic quenching constants at high concentration (α) of nitroxides 1, 2 and 4.
| Nitroxides | KD (M-1) | KS (M-1) | binding sites, n | α (M1) |
|---|---|---|---|---|
| Amino Pyrrolidine 1 | 322 | 1.69 × 10⁵ | 0.60 | 7750 |
| 4-Amino TEMPO 2 | 1240 | 6.71 × 10⁵ | 0.54 | 4710 |
| Carboxylic Acid 3 | 774 | 3.63 × 10⁵ | 0.60 | - |
| Bisamino 4 | 1640 | 7.82 × 10⁴ | 0.59 | 4820 |
Bisamino nitroxide 4 has the smallest KS and the largest KD values. The two long chains of the bisamine make nitroxide 4 sterically large; as a result the nitroxide has limited accessibility to the QD surface, resulting in the smallest KS. Similar examples have been previously reported of hindered access to a semiconductor surface resulting in decreasing quenching effectiveness.77, 78 Apparently, the first molecule of bisamino nitroxide 4 binds to an available empty site (n ≈ 1) on the QD surface; following this, a few more nitroxides can bind by exchange with surrounding ligand molecules. Subsequent bisamines find it difficult to access the QD surface. The static quenching still dominates in this case due to the tight binding of the bisamine bidentate functionality. However, dynamic quenching also plays a significant role at low concentrations, as observed by the greatest KD value. Overall, bisamino nitroxide 4 is the least effective quencher in this study.
The values of α obtained from the upward curved regions in Fig. 10A using equation (5) are 7750, 4710 and 4820 M-1 for nitroxides 1, 2 and 4, respectively. At higher concentrations, quenching is dominated exclusively by the dynamic process, which does not require binding of nitroxides to the QDs. Thus the α values for nitroxides 1, 2 and 4 are all of the same magnitude. Amino pyrrolidine nitroxide 1 has the largest value due to the small size of this molecule, facilitating the dynamic quenching. The average number of immediately available empty binding sites on the QD surface n for all four nitroxides is consistently a little less than one, which is close to the reported values of 1and 1.12 for 2.4-2.5 nm CdSe41 and 2.8 nm CdTe QDs,42 respectively, conjugated with 4-amino TEMPO 2. This indicates that in order to bind additional nitroxides, subsequent nitroxide molecules need to displace existing ligands on the QD surface. The α values are much smaller than KS, indicative of limited accessibility of a second site on the QD surface.
3.3 Fluorescence recovery
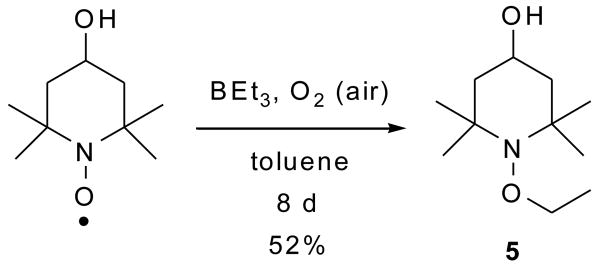
In order to determine if fluorescence can be restored after quenching, the quenched QD-carboxylic acid nitroxide 3 complex was exposed to ethyl radicals generated from triethylborane in the presence of the air (Scheme 1 and Fig. 11).
Scheme 1.
Figure 11.
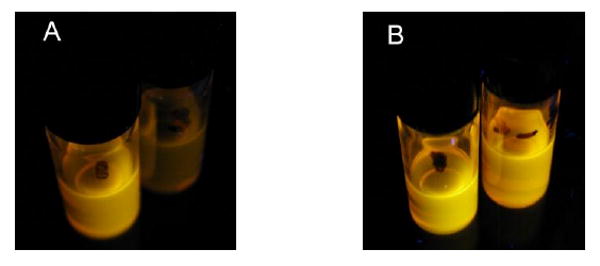
Luminescence visualized with a 366 nm lamp of CdSe QDs (5 μM) in the presence of carboxylic acid nitroxide 3 (1000:1 moles of nitroxide 3:QD) in toluene solution (A) before and (B) after the addition of Et3B (open to air for 1 h; 4:1 moles of BEt3:nitroxide 3). The vial on the left contains CdSe QDs with no additive as a control.
To confirm this chemistry, the trapping of ethyl radical with the nitroxide 4-hydroxy-2,2,6,6-tetramethylpiperidine-N-oxyl (TEMPOL) was carried out on a preparative scale using a longer reaction time (Scheme 2) to give the ethoxyamine 5 in 52% isolated yield. It is evident that the recovery of QD luminescence resulted from the disappearance of nitroxide radical by the formation of ethoxyamine; however the fluorescence was not completely restored, presumably due to incomplete reaction. Alternatively, addition of pre-formed alkoxyamine 6 to a solution of CdSe QDs did not result in any observable quenching of QD fluorescence as seen by the naked eye (Scheme 3 and Fig. 12). This confirms that the carboxylic acid functionality is not responsible for quenching the QD fluorescence: the nitroxide is required.
Scheme 2.
Scheme 3.
Figure 12.
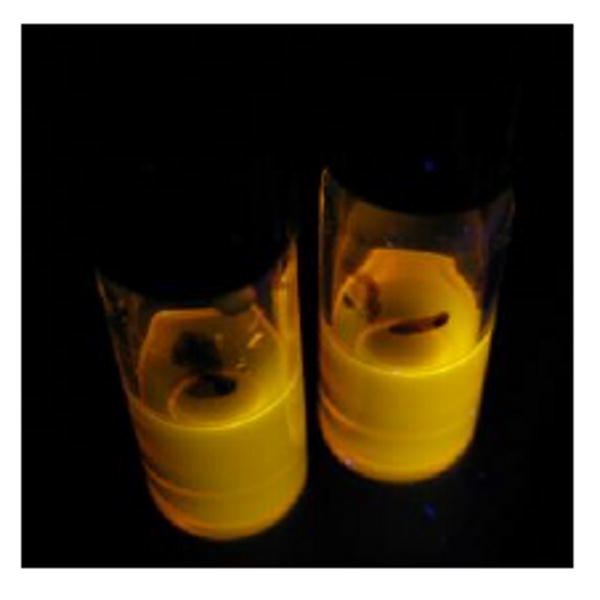
No change in luminescence is observed for CdSe QDs (5 μM) before (left vial) and after (right vial) the addition of alkoxyamine 6 (1000:1 moles of alkoxyamine 6:QD) in toluene solution.
An alternative method to recover the QD fluorescence is the quantitative reduction of nitroxide, as shown in Scheme 4. The reducing agent 1,4-cyclohexadiene was chosen because it is organic soluble, and does not react directly with the QDs. The reductant phenyl hydrazine caused rapid decomposition of a control sample of CdSe QDs. The emission spectra in Fig. 13A illustrate the recovery over time. The plot in Fig. 13B (red line) shows the intensity of the emission at 594 nm as a function of the reaction time following the addition of 1,4-cyclohexadiene. A 30% decrease in QD fluorescence was observed upon addition of carboxylic acid nitroxide 3; the reducing agent was then added, and the emission spectra were recorded. As the nitroxide underwent reduction, the fluorescence recovered, reaching its initial level after 75 minutes. The sample was allowed to stand for two hours: the fluorescence intensity remained unchanged. A control experiment was performed by addition of 1,4-cyclohexadiene to a suspension of CdSe QDs in the absence of nitroxide. The fluorescence intensity remained fairly stable over two hours (Fig. 13B, blue line), indicating that 1,4-cyclohexadiene does not significantly affect QD fluorescence.
Scheme 4.
Figure 13.
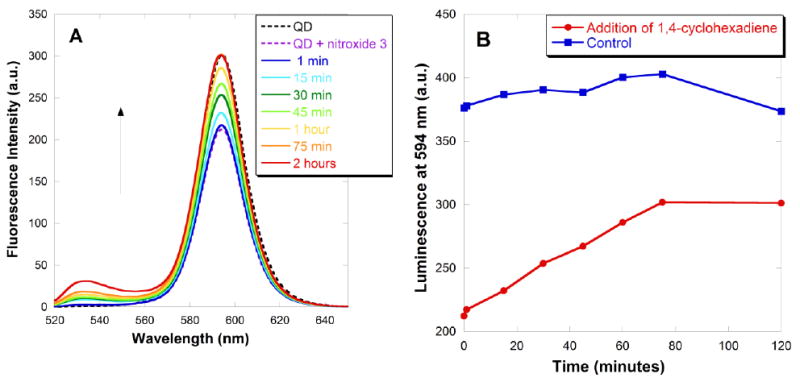
Fluorescence recovery of QD-carboxylic acid nitroxide 3 complex in toluene. Fluorescence emission spectra for an initial toluene suspension containing CdSe QDs (0.4 μM) and carboxylic acid nitroxide 3 (1:17 moles of QD:nitroxide 3). At time = 0: 1,4-cyclohexadiene (100:1 moles of 1,4-cyclohexadiene:nitroxide 3) was added. (A) Emission spectra for excitation at 390 nm, and (B) emission intensity at the peak maximum of 594 nm.
3.4 Fluorescence quenching mechanism based on EPR
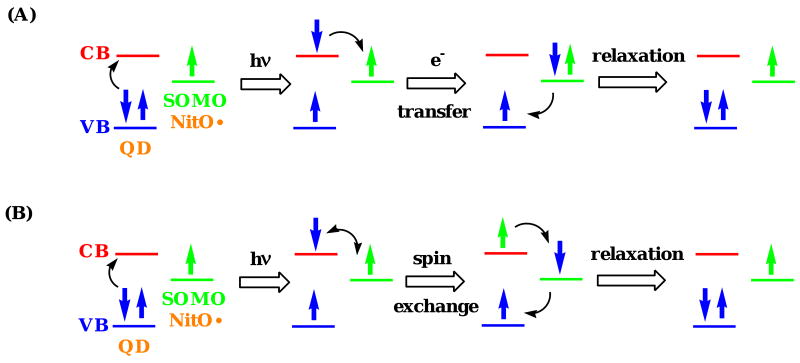
Quenching of tethered fluorescent organic molecules by nitroxides is known to be influenced by the excited state energy of the donor;79, 80 however in this instance, the nitroxide absorption band (350-550 nm) is at higher energy than the band gap of the orange QDs. As a consequence, a simple energy transfer mechanism can be ruled out due to negligible spectral overlap. As quenching efficiency is highly dependent on distance, an electron exchange mechanism is likely. This mechanism requires close proximity between the electron acceptor and the excited electron in the conduction band of the electron donor. Such processes include electron spin exchange and electron transfer. Electron spin exchange involves a paramagnetic-assisted spin relaxation mechanism, analogous to nitroxide-induced intersystem crossing observed previously.81, 82 Reversible electron transfer, also called an electron shuttle mechanism,40 involves electron transfer from the conduction band of the QD to the half-filled SOMO (singly occupied molecular orbital) of the nitroxide, and back electron transfer from the nitroxide to the valence band of the QD. Examples are the proposed mechanisms for the quenching of CdSe QDs by both n-butylamine75 and by nitroxides.40, 42
In order to probe the fluorescence quenching mechanism, photoexcitation studies were performed using a combination of EPR, fluorescence and UV-vis spectroscopies (Scheme 5). As a control, CdSe QDs did not show a signal in the EPR spectrum (Fig. 14A, red line), but strong fluorescence was observed (Fig. 14B, red line: behind blue line). With the aim of photoexciting an electron in the QD from the valence band to the conduction band, with subsequent electron transfer or spin exchange with the ligated nitroxide, photoexcitation was carried out at 365 nm (for absorption spectra for CdSe QDs and for 4-amino TEMPO 2, see SI; Fig. S13-S14). The EPR signal was monitored immediately after irradiation. If electron transfer occurred and was irreversible or slow, a diminution in the EPR signal would be expected. The EPR spectrum of the QD-4-amino TEMPO 2 complex in toluene solution before photoexcitation (Fig. 14A, purple line) shows a broadened signal and a small peak-to-peak height at the high field peak, as expected for a nitroxide with restricted mobility bound to the QD surface. The fluorescence intensity was diminished (Fig. 14B, purple line) due to quenching by the nitroxide radical. Upon photoexcitation of the QD-nitroxide complex, a significant decay of the EPR signal and concurrent enhancement of the fluorescence intensity were observed (Fig. 14, blue lines), indicating that the nitroxide had been transformed to a non-paramagnetic species. The QD concentration determined by UV-vis spectroscopy remained unchanged. The loss of the EPR signal of the photoexcited QD-nitroxide complex remained unchanged after standing for 15 hours (see SI; Fig. S15), suggesting that the reduction process in toluene solution was irreversible. In order to reform the paramagnetic nitroxide, the QD-hydroxylamine complex formed by photoexcitation was oxidized by addition of a catalytic amount of PbO2 with exposure to air. Recovery of the EPR signal was observed (Fig. 14A, green line); however surprisingly the fluorescence intensity (Fig. 14B, green line) diminished further below the original quenching level observed with fresh nitroxide (Fig. 14B, purple line). A control experiment showed that treatment with PbO2 and air quenched the QD luminescence (Fig. 14B, black line). The recovery of the EPR signal confirms that the nitroxide was photoreduced in toluene, and was then successfully chemically reoxidized.
Scheme 5.
Figure 14.
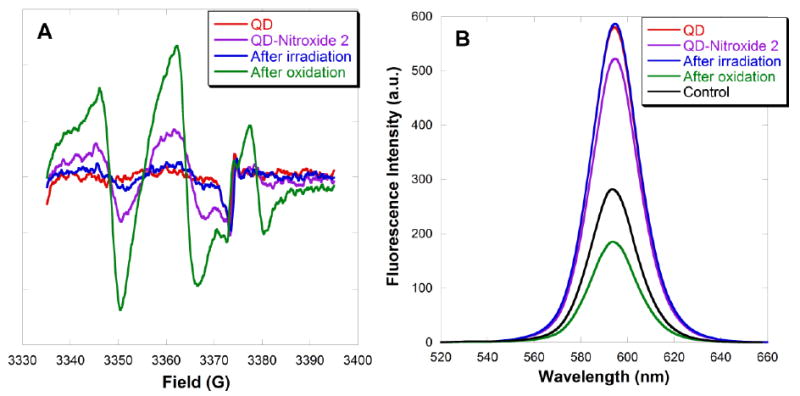
(A) EPR spectra and (B) fluorescence emission spectra of a toluene solution containing CdSe QDs (2 μM), followed by addition of 4-amino TEMPO 2 (1 μM), photoexcitation, and then chemical re-oxidation.
One mechanism for this nitroxide reduction could be electron transfer from the conduction band of the QD to the nitroxide, followed by proton transfer to form the hydroxylamine. However, the reduced EPR signal could also result from photoinduced reduction of the nitroxide in toluene83, 84 by direct photoexcitation of the nitroxide to form an excited state, followed by benzylic hydrogen abstraction from toluene. A control was carried out using free 4-amino TEMPO 2 in toluene. Photoreduction to the alkoxyamine was observed in the absence of QDs (see SI; Fig. S16). The photoexcitation experiment on QD-4-amino TEMPO 2 complex was repeated in benzene solution, where hydrogen abstraction can not occur (for control experiment see SI; Fig. S17). The EPR signal of the QD-nitroxide complex in benzene before photoexcitation showed the expected broadening (Fig. 15A, purple line: behind blue line) compared to the free nitroxide (Fig. 15A, green line). The fluorescence intensity was slightly diminished due to quenching by the nitroxide (Fig. 15B, purple line); however the quenching is less effective compared to that in toluene solution. Addition of 25 equivalents of 4-amino TEMPO 2 quenched the fluorescence to a much greater extent (Fig. 15B, black line: directly behind blue line). The fluorescence intensity and the EPR signal remained unchanged upon photoexcitation (Fig. 15, blue lines).
Figure 15.
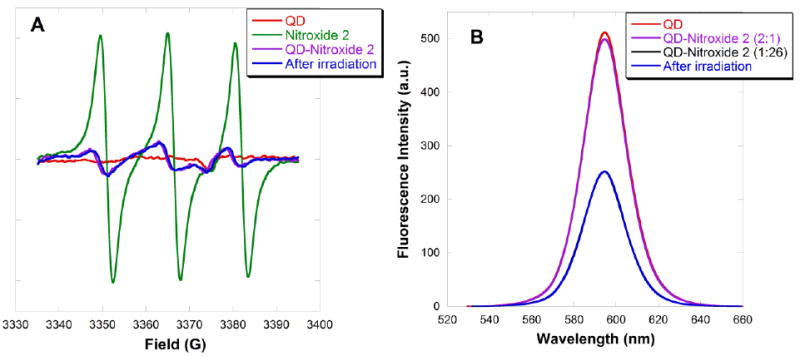
(A) EPR spectra and (B) fluorescence emission spectra of a benzene solution containing CdSe QDs (2 μM), followed by addition of 4-amino TEMPO 2 (1 μM) and then photoexcitation. (Note: an additional 25 equivalents of 4-amino TEMPO 2 was added in the fluorescence study.)
These experiments indicate that the photoreduction process in toluene solution is independent of the fluorescence quenching mechanism, but instead results from hydrogen abstraction by a photoexcited nitroxide. The quenching mechanism appears to be reversible, as no change was observed in the EPR signal upon photoexcitation. In both toluene and benzene solutions, the quenching process is either due to a fast reversible electron transfer mechanism or an electron spin exchange mechanism as illustrated in Fig. 16. These experiments cannot distinguish between these two mechanisms.40
Figure 16.
Diagrams illustrating two possible quenching mechanisms: (A) reversible electron transfer, and (B) electron spin exchange. (Note: CB = conduction band, VB = valence band, SOMO = singly occupied molecular orbital, NitO• = nitroxide radical)
4. Conclusions
In summary, a clear distance dependence in the fluorescence quenching by nitroxides bound to the surface of CdSe QDs has been observed. Among the four nitroxides tested, the order of quenching efficiency is: 4-amino TEMPO 2 > carboxylic acid nitroxide 3 > amino pyrrolidine nitroxide 1 > bisamino nitroxide 4. This sequence correlates with the distance of the bound nitroxide radicals to the QD surface, except for the case of amino pyrrolidine nitroxide 1, which can take part in intramolecular hydrogen bonding, dramatically diminishing its quenching efficiency. The carboxylic acid nitroxide 3 shows tighter binding to the CdSe QDs than 4-amino TEMPO 2. Intermolecular hydrogen bonding between nitroxides strongly affects the EPR spectra of dilute solutions of the free nitroxides in toluene: the addition of chemically similar competitors breaks up the nitroxide aggregates, resulting in a strong enhancement in the magnitude of the EPR signal. Interaction of QDs with all of these functionalized nitroxides shows bimodal quenching, as reflected in both upward and downward curved Stern-Volmer plots. The large binding constants (Kb) and static quenching constants (KS) confirm that fluorescence quenching by nitroxides 1-4 is dominated by static processes. Restoration of the QD fluorescence was demonstrated by converting the nitroxide moiety to either ethoxyamine or hydroxylamine. The EPR data in conjunction with fluorescence and UV-vis studies support photoinduced reduction in toluene solution. Similar experiments in benzene suggest a reversible fluorescence quenching mechanism. The development of strongly binding QD-nitroxide complexes with multidentate ligands and short tethers is expected to improve the performance of profluorescent probes in the development of QD-based sensors for chemical and biological applications. The insights gained from these studies will lead to a deeper understanding of the fundamental processes that govern both fluorescence quenching of QDs by organic radicals and electron transfer or spin exchange between QDs and radicals.
Supplementary Material
Acknowledgments
The authors thank the NSF (CHE-0453126 to RB) and (CHE-0342912) (NMR) and (DBI-0217922, to GM) and the NIH (CA52955) (ESITOFMS) and (GM65790, to GM). CT thanks the Royal Thai Government for a Higher Education Strategic Scholarship for Frontier Research Network. JZZ is grateful to the US DOE (DE-FG02-05ER46232-A002) for financial support. We thank Steven Bottle for helpful discussions regarding reduction of nitroxides.
Footnotes
Supplementary Information Available: Nonlinear curve fitting of the saturation curves (θ vs [Q]) for 4-amino TEMPO 2 and carboxylic acid nitroxide 3, and for carboxylic acid nitroxide 3 after 24 hrs. EPR spectra of bisamino nitroxide 4 and TEMPO before and after the addition of benzylamine. EPR spectra of carboxylic acid nitroxide 3 taken at t = 0 and t = 24 hrs. Nonlinear curve fitting of the Stern-Volmer plots with the “multi-binding-site” model and the exponential equation 5 for nitroxides 1-4. Absorption spectra of CdSe QDs and 4-amino TEMPO 2 in toluene. EPR spectra of photoexcitation studies of QD-4-amino TEMPO 2 complex (before irradiation, 10 minutes and 15 hours after irradiation), photoinduced reduction of nitroxide 2 in toluene solution, and photoexcitation of 4-amino TEMPO 2 in benzene solution. Synthesis and characterizations of nitroxides 1-4, alkoxyamines 5 and 6 and their precursors. This material is available free of charge via the Internet at http://pubs.acs.org.
References
- 1.Snee PT, Somers RC, Nair G, Zimmer JP, Bawendi MG, Nocera DG. J Am Chem Soc. 2006;128:13320–13321. doi: 10.1021/ja0618999. [DOI] [PubMed] [Google Scholar]
- 2.Giepmans BNG, Adams SR, Ellisman MH, Tsien RY. Science. 2006;312:217–224. doi: 10.1126/science.1124618. [DOI] [PubMed] [Google Scholar]
- 3.Selvan ST, Patra PK, Ang CY, Ying JY. Angew Chem Int Ed. 2007;46:2448–2452. doi: 10.1002/anie.200604245. [DOI] [PubMed] [Google Scholar]
- 4.Liu W, Howarth M, Greytak AB, Zheng Y, Nocera DG, Ting AY, Bawendi MG. J Am Chem Soc. 2008;130:1274–1284. doi: 10.1021/ja076069p. [DOI] [PMC free article] [PubMed] [Google Scholar]
- 5.Schroeder T. Nature. 2008;453:345–351. doi: 10.1038/nature07043. [DOI] [PubMed] [Google Scholar]
- 6.Resch-Genger U, Grabolle M, Cavaliere-Jaricot S, Nitschke R, Nann T. Nat Methods. 2008;5:763–775. doi: 10.1038/nmeth.1248. [DOI] [PubMed] [Google Scholar]
- 7.Smith AM, Gao X, Nie S. Photochem Photobiol. 2004;80:377–385. doi: 10.1562/0031-8655(2004)080<0377:QDNFIV>2.0.CO;2. [DOI] [PubMed] [Google Scholar]
- 8.Smith AM, Nie S. Analyst. 2004;129:672–677. doi: 10.1039/b404498n. [DOI] [PubMed] [Google Scholar]
- 9.Gao X, Yang L, Petros JA, Marshal FF, Simons JW, Nie S. Curr Opin Biotechnol. 2005;16:63–72. doi: 10.1016/j.copbio.2004.11.003. [DOI] [PubMed] [Google Scholar]
- 10.Raymo FM, Yildiz I. Phys Chem Chem Phys. 2007;9:2036–2043. doi: 10.1039/b616017d. [DOI] [PubMed] [Google Scholar]
- 11.Somers RC, Bawendi MG, Nocera DG. Chem Soc Rev. 2007;36:579–591. doi: 10.1039/b517613c. [DOI] [PubMed] [Google Scholar]
- 12.Walker GW, Sundar VC, Rudzinski CM, Wun AW, Bawendi MG, Nocera DG. Appl Phys Lett. 2003;83:3555–3557. [Google Scholar]
- 13.Chang E, Miller JS, Sun J, Yu WW, Colvin VL, Drezek R, West JL. Biochem Biophys Res Commun. 2005;334:1317–1321. doi: 10.1016/j.bbrc.2005.07.028. [DOI] [PubMed] [Google Scholar]
- 14.Dyadyusha L, Yin H, Jaiswal S, Brown T, Baumberg JJ, Booy FP, Melvin T. Chem Commun. 2005:3201–3203. doi: 10.1039/b500664c. [DOI] [PubMed] [Google Scholar]
- 15.Liang J, Huang S, Zeng D, He Z, Ji X, Ai X, Yang H. Talanta. 2006;69:126–130. doi: 10.1016/j.talanta.2005.09.004. [DOI] [PubMed] [Google Scholar]
- 16.Cordes DB, Gamsey S, Singaram B. Angew Chem Int Ed. 2006;45:3829–3832. doi: 10.1002/anie.200504390. [DOI] [PubMed] [Google Scholar]
- 17.Jin T, Fujii F, Yamada E, Nodasaka Y, Kinjo M. Comb Chem High Throughput Screening. 2007;10:473–479. doi: 10.2174/138620707781996466. [DOI] [PubMed] [Google Scholar]
- 18.Callen JF, Mulrooney RC, Kamila S, McCaughan B. J Fluoresc. 2008;18:527–532. doi: 10.1007/s10895-007-0295-9. [DOI] [PubMed] [Google Scholar]
- 19.Neuman D, Ostrowski AD, Mikhailovsky AA, Absalonson RO, Strouse GF, Ford PC. J Am Chem Soc. 2008;130:168–175. doi: 10.1021/ja074164s. [DOI] [PMC free article] [PubMed] [Google Scholar]
- 20.Ma Y, Yang C, Li N, Yang X. Talanta. 2005;67:979–983. doi: 10.1016/j.talanta.2005.04.027. [DOI] [PubMed] [Google Scholar]
- 21.Likhtenstein GI, Ishii K, Nakatsuji S. Photochem Photobiol. 2007;83:871–881. doi: 10.1111/j.1751-1097.2007.00141.x. [DOI] [PubMed] [Google Scholar]
- 22.Ivan MG, Scaiano JC. Photochem Photobiol. 2003;78:416–419. doi: 10.1562/0031-8655(2003)078<0416:anaftd>2.0.co;2. [DOI] [PubMed] [Google Scholar]
- 23.Nagy VY, Bystryak IM, Kotel'nikov AI, Likhtenshtein GI, Petrukhin OM, Zolotov YA, Voloarskii LB. Analyst. 1990;115:839–841. [Google Scholar]
- 24.Coenjarts C, Garcia O, Llauger L, Palfreyman J, Vinette AL, Scaiano JC. J Am Chem Soc. 2003;125:620–621. doi: 10.1021/ja028835s. [DOI] [PubMed] [Google Scholar]
- 25.Meineke P, Rauen U, de Groot H, Korth HG, Sustmann R. Chem Eur J. 1999;5:1738–1747. [Google Scholar]
- 26.Meineke P, Rauen U, de Groot H, Korth HG, Sustmann R. Biol Chem. 2000;381:575–582. doi: 10.1515/BC.2000.074. [DOI] [PubMed] [Google Scholar]
- 27.Lozinsky EM, Martina LV, Shames AI, Uzlaner N, Masarwa A, Likhtenshtein GI, Meyerstein D, Martin VV, Priel Z. Anal Biochem. 2004;326:139–145. doi: 10.1016/j.ab.2003.12.004. [DOI] [PubMed] [Google Scholar]
- 28.Hornig FS, Korth HG, Rauen U, de Groot H, Sustmann R. Helv Chim Acta. 2006;89:2281–2296. [Google Scholar]
- 29.Hideg É, Kálai T, Kós PB, Asada K, Hideg K. Photochem Photobiol. 2006;82:1211–1218. doi: 10.1562/2006-02-06-RA-797. [DOI] [PubMed] [Google Scholar]
- 30.Borisenko GG, Martin I, Zhao Q, Amoscato AA, Kagan VE. J Am Chem Soc. 2004;126:9221–9232. doi: 10.1021/ja0495157. [DOI] [PubMed] [Google Scholar]
- 31.Medvedeva N, Martin VV, Weis AL, Likhtenshtein GI. J Photochem Photobiol, A: Chemistry. 2004;163:45–51. [Google Scholar]
- 32.Rosen GM, Pou S, Britigan BE, Cohen MS. Methods Enzymol. 1994;233:105–111. doi: 10.1016/s0076-6879(94)33012-3. [DOI] [PubMed] [Google Scholar]
- 33.Bian ZY, Guo XQ, Zhao YB, Du JO. Anal Sci. 2005;21:553–559. doi: 10.2116/analsci.21.553. [DOI] [PubMed] [Google Scholar]
- 34.Blough NV, Simpson DJ. J Am Chem Soc. 1988;110:1915–1917. [Google Scholar]
- 35.Lozinsky E, Martin VV, Berezina TA, Shames AI, Weis AL, Likhtenshtein GI. J Biochem Biophys Methods. 1999;38:29–42. doi: 10.1016/s0165-022x(98)00029-3. [DOI] [PubMed] [Google Scholar]
- 36.Parkhomyuk-Ben Arye P, Strashnikova N, Likhtenshtein GI. J Biochem Biophys Methods. 2002;51:1–15. doi: 10.1016/s0165-022x(01)00234-2. [DOI] [PubMed] [Google Scholar]
- 37.Tang Y, He F, Yu M, Wang S, Li Y, Zhu D. Chem Mater. 2006;18:3605–3610. [Google Scholar]
- 38.Sato S, Tsunoda M, Suzuki M, Kutsuna M, Takido-uchi K, Shindo M, Mizugushi H, Obara H, Ohya H. Spectrochim Acta, Part A. 2009;71:2030–2039. doi: 10.1016/j.saa.2008.07.045. [DOI] [PubMed] [Google Scholar]
- 38.Aliaga C, Juárez-Ruiz JM, Scaiano JC, Aspée A. Org Lett. 2008;10:2147–2150. doi: 10.1021/ol800446c. [DOI] [PubMed] [Google Scholar]
- 39.Laferriére M, Galian RE, Maurel V, Scaiano JC. Chem Commun. 2006:257–259. doi: 10.1039/b511515a. [DOI] [PubMed] [Google Scholar]
- 40.Scaiano JC, Laferriére M, Galian RE, Maurel V, Billone P. Phys Stat Sol A. 2006;203:1337–1343. [Google Scholar]
- 41.Maurel V, Laferriére M, Billone P, Godin R, Scaiano JC. J Phys Chem B. 2006;110:16353–16358. doi: 10.1021/jp061115d. [DOI] [PubMed] [Google Scholar]
- 42.Chen W, Wang X, Tu X, Pei D, Zhao Y, Guo X. Small. 2008;4:759–764. doi: 10.1002/smll.200700788. [DOI] [PubMed] [Google Scholar]
- 43.Choudary BM, Kantam ML, Bharathi B, Reddy CRV. J Molecular Catal A: Chem. 2001;168:69–73. [Google Scholar]
- 44.Reiss P, Bleuse J, Pron A. Nano Lett. 2002;2:781–784. [Google Scholar]
- 45.Zaitseva N, Dai ZR, Leon FR, Krol D. J Am Chem Soc. 2005;127:10221–10226. doi: 10.1021/ja051069f. [DOI] [PubMed] [Google Scholar]
- 46.Yu WW, Qu L, Guo W, Peng X. Chem Mater. 2003;15:2854–2860. [Google Scholar]
- 47.Knauer BR, Napier JJ. J Am Chem Soc. 1976;98:4395–4400. [Google Scholar]
- 48.Chechik V, Wellsted HJ, Korte A, Gilbert BC, Caldararu H, Ionita P, Caragheorgheopol A. Faraday Discuss. 2004;125:279–291. doi: 10.1039/b302730a. [DOI] [PubMed] [Google Scholar]
- 49.Barhate N, Cekan P, Massey AP, Sigurdsson STh. Angew Chem Int Ed. 2007;46:2655–2658. doi: 10.1002/anie.200603993. [DOI] [PubMed] [Google Scholar]
- 50.Bahri MA, Heyne BJ, Hans P, Seret AE, Mouithys-Mickalad AA, Hoebeke MD. Biophys Chem. 2004;114:53–61. doi: 10.1016/j.bpc.2004.11.006. [DOI] [PubMed] [Google Scholar]
- 51.Hafner A, Hrast M, Pečar S, Mravljak J. Tetrahedron Lett. 2009;50:564–566. [Google Scholar]
- 52.Sharma SN, Pillai ZS, Kamat PV. J Phys Chem B. 2003;107:10088–10093. [Google Scholar]
- 53.Jones M, Nedeljkovic J, Ellingson RJ, Nozik AJ, Rumbles G. J Phys Chem B. 2003;107:11346–11352. [Google Scholar]
- 54.Kalyuzhny G, Murray RW. J Phys Chem B. 2005;109:7012–7021. doi: 10.1021/jp045352x. [DOI] [PubMed] [Google Scholar]
- 55.Roberti TW, Cherepy NJ, Zhang JZ. J Chem Phys. 1998;108:2143–2151. [Google Scholar]
- 56.Zotti G, Vercelli B. Chem Mater. 2009;21:2258–2271. [Google Scholar]
- 57.Marshall JH. J Chem Phys. 1971;54:2762–2763. [Google Scholar]
- 58.Veloso DP, Rassat A. J Chem Res (S) 1979:168. [Google Scholar]
- 59.Kosser RG. Macromol. 1987;20:435–436. [Google Scholar]
- 60.Rozantsev EG. Free Nitroxyl Radicals, Plenum Press: New York. 1970:128. [Google Scholar]
- 61.Tkacheva OP, Martin VV, Volodarskii LB, Buchachenko AL. Bull Acad Sci USSR. 1981;30:913–915. [Google Scholar]
- 62.Janzen EG, Lopp IG. J Magn Reson. 1972;7:107–110. [Google Scholar]
- 63.Kotake Y, Kuwata K. Can J Chem. 1982;60:1610–1613. [Google Scholar]
- 64.Matsushita MM, Izuoka A, Sugawara T, Kobayashi T, Wada N, Takeda N, Ishikawa M. J Am Chem Soc. 1997;119:4369–4379. [Google Scholar]
- 65.Marque S, Fisher H, Baier E, Studer A. J Org Chem. 2001;66:1146–1156. doi: 10.1021/jo001190z. [DOI] [PubMed] [Google Scholar]
- 66.Ahrens B, Davidson MG, Forsyth VT, Mahon MF, Johnson AL, Mason SA, Price RD, Raithby PR. J Am Chem Soc. 2001;123:9164–9165. doi: 10.1021/ja015849+. [DOI] [PubMed] [Google Scholar]
- 67.Russ JL, Gu J, Tsai KH, Glass T, Duchamp JC, Dorn HC. J Am Chem Soc. 2007;129:7018–7027. doi: 10.1021/ja064632i. [DOI] [PubMed] [Google Scholar]
- 68.Rajadurai C, Enkelmann V, Zoppellaro G, Baumgarten M. J Phys Chem B. 2007;111:4327–4334. doi: 10.1021/jp066605k. [DOI] [PubMed] [Google Scholar]
- 69.Kálai T, Hideg É, Vass I, Hideg K. Free Rad Biol Med. 1998;24:649–652. doi: 10.1016/s0891-5849(97)00339-0. [DOI] [PubMed] [Google Scholar]
- 70.Lakowicz JR. Principles of Fluorescence Spectroscopy. 3rd. Springer Science/Business Media; Singapore: 2006. pp. 282–287. [Google Scholar]
- 71.Smoluchowski MV. Z Phys Chem. 1917;92:129. [Google Scholar]
- 72.Frank IM, Vaviiov SI. Z Phys Chem. 1931;69:100. [Google Scholar]
- 73.Boaz H, Rollefson GK. J Am Chem Soc. 1950;72:3435–3443. [Google Scholar]
- 74.Zelent B, Kuba J, Gryczynski I, Johnson ML, Lakowisz JR. J Phys Chem. 1996;100:18592–18602. doi: 10.1021/jp9618688. [DOI] [PMC free article] [PubMed] [Google Scholar]
- 75.Landes C, Burda C, Braun M, El-Sayed MA. J Phys Chem B. 2001;105:2981–2986. [Google Scholar]
- 76.Landes CF, Braun M, El-Sayed MA. J Phys Chem B. 2001;105:10554–10558. [Google Scholar]
- 77.Alivisatos AP. Science. 1996;271:933–937. [Google Scholar]
- 78.Alivisatos AP. J Phys Chem. 1996;100:13226–13239. [Google Scholar]
- 79.Gijzeman OLJ, Kaufman F, Porter G. J Chem Soc, Faraday Trans 2. 1973;69:727–737. [Google Scholar]
- 80.Watkins AR. Chem Phys Lett. 1974;70:262–265. [Google Scholar]
- 81.Scaiano JC. Tetrahedron. 1982;38:819. [Google Scholar]
- 82.Giacobbe EM, Mi Q, Colvin MT, Cohen B, Ramanan C, Scott AM, Yeganeh S, Marks TJ, Ratner MA, Wasielewski MR. J Am Chem Soc. 2009;131:3700–3712. doi: 10.1021/ja808924f. [DOI] [PubMed] [Google Scholar]
- 83.Keana JFW, Dinerstein RJ, Baitis F. J Org Chem. 1971;36:209–211. [Google Scholar]
- 84.Johnston LJ, Tencer M, Scaiano JC. J Org Chem. 1986;51:2806–2808. [Google Scholar]
Associated Data
This section collects any data citations, data availability statements, or supplementary materials included in this article.


