

Abstract
Optical detection of the frequency-dependent magnetic relaxation signal is used to monitor the binding of biological molecules to magnetic nanoparticles in a ferrofluid. Biological binding reactions cause changes in the magnetic relaxation signal due to an increase in the average hydrodynamic diameter of the nanoparticles. To allow the relaxation signal to be detected in dilute ferrofluids, measurements are made using a balanced photodetector, resulting in a 25 μV/√Hz noise floor, within 50% of the theoretical limit imposed by photon shot noise. Measurements of a ferrofluid composed of magnetite nanoparticles coated with anti-IgG antibodies show that the average hydrodynamic diameter increases from 115.2 to 125.4 nm after reaction with IgG.
Keywords: Field-induced magnetic birefringence, Magnetic nanoparticles, Ferrofluid, Brownian relaxation, Immunoassay
1. Introduction
Ferrofluids are stable colloids of magnetic nanoparticles suspended in a non-magnetic fluid such as oil or water [1]. Biocompatible ferrofluids have wide-ranging applications in biology and medicine including cell sorting, targeted drug delivery, and as contrast agents for magnetic resonance imaging (MRI) [2]. Since ferrofluids may be easily manipulated using magnetic force, there is growing interest in employing them for various applications within microfluidic lab-on-a-chip devices [3,4]. One such application is microfluidic immunoassays in which magnetic nanoparticles functionalized with an appropriate antibody are used as labels to detect antigen–antibody binding.
Several magnetically labeled immunoassays have recently been demonstrated. These can be generally categorized as being either solid-phase or solution-phase assays. In a solid-phase assay, capture antibodies are immobilized onto a solid support, such as the surface of a magnetic sensor array, and the assay is performed by detecting the signature of magnetic material bound to the antibodies [5,6]. In contrast, solution-phase assays detect changes in the magnetic relaxation dynamics of a ferrofluid when antibody–antigen binding occurs [7–9]. The change in relaxation signal is induced by the larger hydrodynamic size of the particles bound to antigen molecules. Solution-phase assays have several potential advantages relative to solid-phase assays including: shorter incubation time due to reduced diffusion length, simpler assay procedures resulting from the elimination of washing steps used to separate bound and unbound magnetic labels, and lower-cost assay chips since there is no need to selectively functionalize the interior surface of the chip with capture antibodies.
The relaxation signal of a ferrofluid is produced by an ensemble of particles of various sizes. Detecting the relaxation signal of a small number of antigen–particle complexes in the presence of a large number of unbound particles is challenging. Therefore, the detection of small quantities of antigen molecules requires the use of a ferrofluid with a very low concentration of magnetic material. In turn, the low ferrofluid concentration necessitates an extremely sensitive detection method. Optical measurements based on magnetic field-induced birefringence provide a low-noise means of measuring relaxation in ferrofluids [10]. Particle sizing based on birefringence has been shown to compare well with sizing based on gel filtration [11], and a birefringence-based immunoassay [12] has been demonstrated to allow the detection of 0.2 ng/ml of human immunoglobulin G (hIgG).
Here we describe a magnetically labeled immunoassay based on a low-noise optical measurement system. The measurement system incorporates a novel differential measurement scheme that cancels laser intensity noise, reducing the detection limit by more than an order of magnitude. Our approach employs a short 1 mm optical path length and is amenable to further miniaturization using low-cost passive microfluidic measurement cells.
2. Background
When a DC magnetic field is applied to a ferrofluid, each magnetic particle in the fluid experiences a torque, causing the particle's magnetization to align towards the field axis. As a result, the ferrofluid behaves like a birefringent crystal with different refractive indices parallel to and perpendicular to the magnetic field. Assuming a monodisperse ferrofluid composed of nanoparticles with magnetic core diameter dm, the magnetic energy of each nanoparticle is given by Emag = μ0MdVH, where μ0 is the permeability, Md is the magnetization, H is the applied magnetic field, and is the volume of each magnetic core. The birefringence Δn is a function of the ratio of the magnetic energy to the thermal energy ξ = Emag/Eth, where Eth = kBT, kB is Boltzmann's constant, and T is the temperature. Using this parameter, the birefringence is given by
| (1) |
where L(ξ) is the first Langevin function, Φ is the volume fraction of magnetic material in the ferrofluid, and δn0 is the intrinsic birefringence of each nanoparticle [10]. The magnetic core diameter can be estimated by measuring the static birefringence as a function of magnetic field and fitting with Eq. (1). Note that the magnitude of the birefringence signal depends strongly on H. In the low-field limit, when ξ ≪ 1, Δn is proportional to H2 so a 10× increase in field strength results in 100× increase in the birefringence signal.
Dynamic birefringence measurements allow the nanoparticle hydrodynamic diameter to be estimated. When the field is extinguished, the magnetization m(t) and birefringence Δn(t) of the ferrofluid decay exponentially according to Debye's law and Perrin's law, respectively [13]. The time constants of these decay processes are related to the particle's rotational diffusion constant D by τm = 1/(2D) and τn = 1/(6D). For a spherical particle of diameter dh in a fluid with viscosity η, . Relaxation measurements can be performed in the time domain by recording the exponential decay curve in response to a pulsed magnetic field signal. Here, we perform frequency-domain measurements by subjecting the sample to an AC magnetic field and recording the imaginary component of the AC birefringence as a function of input frequency f:
| (2) |
where Δn0 is the static birefringence and τn is the relaxation time constant. The peak value of Δn″(f) occurs at fp = 1/(2πτn), allowing τn to be identified and the average nanoparticle diameter to be inferred.
3. Materials and methods
3.1. Birefringence measurements
Field-induced birefringence creates a phase difference between light beams polarized parallel and perpendicular to the magnetic field as they pass through the sample. The phase difference is φ = (2πL/λ)Δn, where λ is the optical wavelength and L is the thickness of the sample. One approach that has been used [14] to detect the phase difference is illustrated in Fig. 1(a). The sample is positioned between a crossed polarizer–analyzer pair and the output intensity signal is given by I/I0 = sin2(φ/2), where I0 is the input optical intensity. When an AC magnetic field H(t) = H0 sin ωt is applied to the sample, the intensity signal at frequency 2ω has an RMS amplitude , where φ0 is the phase difference produced at H0. Since the DC light intensity is nearly zero, the noise is dominated by electronic and dark-current noise in the photodetector. The minimum detectable phase difference, resulting in a 0 dB signal-to-noise ratio (SNR) in a given measurement bandwidth B, is given by , where NEP is the noise-equivalent power of the photodetector. Assuming I0 = 1 mW and NEP = 3 pW/√Hz, the minimum detectable phase difference in a 1 Hz bandwidth is 1.84 × 10⁻⁴ rad.
Fig. 1.
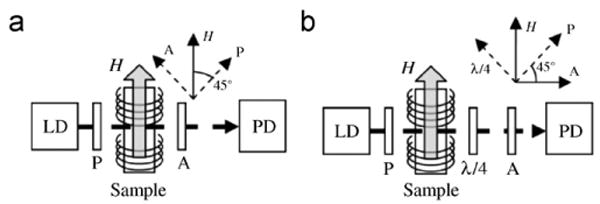
Block diagrams of the two optical configurations for measuring the birefringence in a ferrofluid sample. In each figure, the inset shows the orientation of the various optical components relative to the applied magnetic field H. In (a) a crossed polarizer–analyzer configuration is used, while in (b) a quarter wave plate is added. LD: laser diode; PD: photodetector; P: polarizer; A: analyzer; λ/4: quarter wave plate.
An alternative configuration with an additional quarter wave plate is illustrated in Fig. 1(b). The output intensity signal is . Since the field-induced birefringence is positive regardless of the polarity of the field, the applied field is varied from 0 to H0 to maintain linearity, , and the intensity signal at frequency ω has an RMS amplitude , where φ0 is the phase difference produced at H0. In comparison to the polarizer–analyzer configuration described above, this second configuration has both a larger signal level and a much higher noise floor due to presence of a large DC intensity term, which introduces laser intensity noise and increases the relative contribution of shot noise. Laser intensity noise can be cancelled by splitting the laser beam into signal and reference beams and detecting the two beams with a balanced photoreceiver [15]. Assuming perfect cancellation of the laser noise, the noise floor is determined by the combined shot noise of the two photodetectors, where q is the electron charge, and ipd is the photocurrent on each detector. The minimum detectable phase difference is then given by where R denotes the responsivity of the photodetector. Assuming I0 = 1 mW and R = 0.42 A/W, the minimum detectable phase difference in a 1 Hz bandwidth is 1.6 × 10⁻⁷ rad, roughly three orders of magnitude smaller than the value calculated for a crossed polarizer–analyzer configuration.
A block diagram of the experimental setup is shown in Fig. 2. A low-noise 5 mW diode laser (Coherent Lab Laser ULN) with 635 nm output wavelength is attenuated and split into two 1 mW beams. The first beam serves as a reference, while the second beam is the signal beam that passes through the ferrofluid sample. Both beams are detected with a balanced photoreceiver (New Focus Nirvana 2007) with R = 0.42 A/W at λ = 635 nm and a transimpedance gain of 1 MΩ. Measured noise spectra for our setup comparing differential and single-beam measurements along with the dark-photodiode noise level are shown in Fig. 3. The single-beam measurement noise is 300 μV/√Hz at f = 1 kHz, and is dominated by laser intensity noise fluctuations. In balanced photoreceiver mode, the noise floor is 25 μV/√Hz at f = 1 kHz. This compares well to the calculated shot noise limit of 16 μV/√Hz. The dark noise level of 1.3 μV/√Hz agrees well with the specified NEP (3 pW/√Hz) and represents the noise floor that would be present for a dark background measurement like the crossed polarizer–analyzer configuration described above.
Fig. 2.
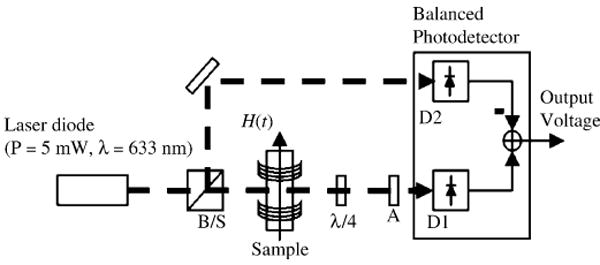
Schematic of the experimental setup using the differential measurement scheme. A beam splitter (B/S) splits the polarized laser beam into measurement and reference beams which are detected using a balanced photodetector
Fig. 3.
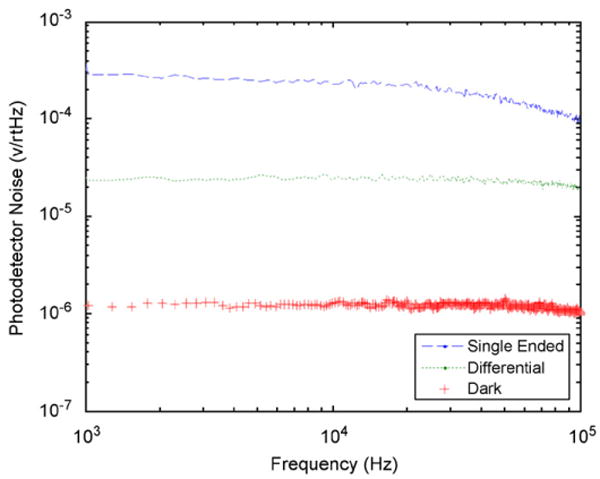
Photodetector output voltage noise for dark, single-beam and dual-beam measurements.
3.2. Antibody-functionalized ferrofluid
Binding experiments were performed using an antibody-functionalized ferrofluid prepared from carboxylated magnetite (Fe3O4) nanoparticles. A schematic of the nanoparticle diameter at various phases in the binding experiment is presented in Fig. 4. Ferrofluid samples were prepared by suspending 0.1 mg of nanoparticles in 500 μl of MES buffer (pH 5.92), resulting in Φ = 4 × 10⁻⁵ magnetite by volume. The ferrofluid solution was mixed with 100 μg of 1-ethyl-3-(3-dimethyl aminopropyl) carbodiimide (EDC) in preparation for coupling with avidin. After 2 h, 17.5 μg of avidin was mixed into the ferrofluid solution and the mixture was incubated at 4 °C overnight. Antibody-functionalized nanoparticles were synthesized by introducing 116 μg of biotinylated goat anti-rabbit immunoglobulin-G (IgG) antibodies (Invitrogen) to the solution. The samples were left to incubate for 4 h at 4 °C. Finally, antigen binding experiments were conducted with rabbit IgG antigen with birefringence measurements performed following 4 h of incubation. All birefringence measurements were performed following each of the incubation steps without any additional centrifugation or magnetic separation procedures to remove excess protein in solution.
Fig. 4.
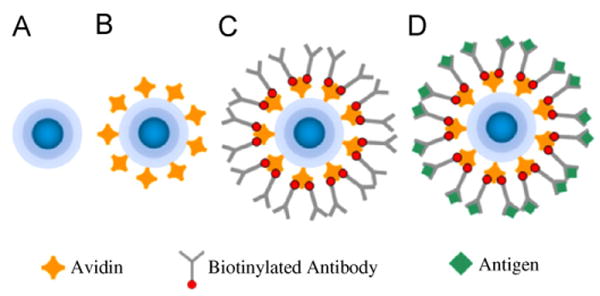
Schematic representation of a magnetite nanoparticle throughout the four steps of the biological binding process. The COOH-terminated FeO4 nanoparticle (a) is coated with avidin (b), then functionalized with a biotinylated antibody (c), and is finally reacted with the antigen molecule (d).
4. Results
Preliminary experiments were performed using a commercial aqueous ferrofluid based on dextran-stabilized magnetite (Fe3O4) nanoparticles (Liquids Research Ltd, UK). Dynamic light scattering (DLS) measurements, shown in Fig. 5, indicate a log-normal size distribution with an average hydrodynamic diameter of dh = 98 nm. The temperature dependence of magnetization of a dried ferrofluid sample after zero-field cooling (ZFC) and field cooling (FC) was measured in a 100 Oe field using a quantum design superconducting quantum interference device (SQUID) magnetometer. The results of this measurement, shown in Fig. 6, indicate a blocking temperature of Tb = 45 K. The blocking temperature can be used to estimate the average magnetic diameter using the relationship τ/τ0 = exp(KaV/kBT), where τ is the measurement interval (30 s), τ0 is a constant (10−9 s), V is the magnetic volume, and Ka is the anisotropy energy density. Bulk magnetite with Ka = 2×10⁵ erg/cm3 corresponds to an average magnetic diameter of dm = 11 nm. Surface effects increase the effective anisotropy energy density in nanoparticles, experimental measurements [16] suggest Ka∼3 ×10⁵ erg/cm3 for magnetite nanoparticles in this size range, a value that would yield an average core diameter of dm = 10 nm.
Fig. 5.
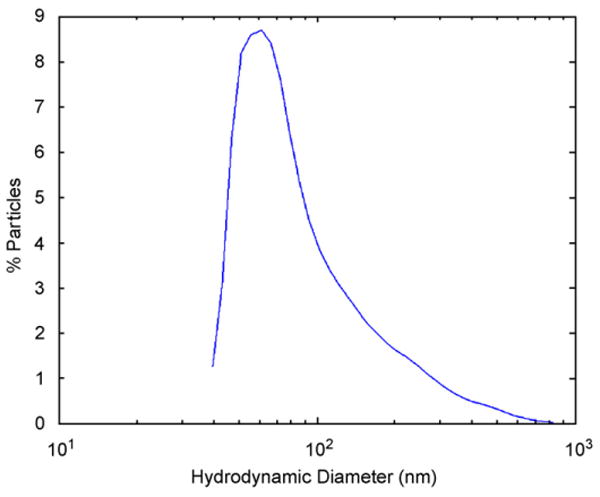
Hydrodynamic diameter of dextran-stabilized ferrofluid measured using DLS. The average hydrodynamic diameter is dh = 98 nm.
Fig. 6.
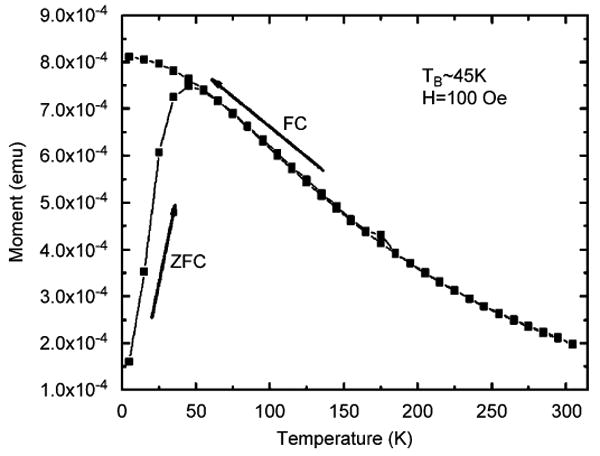
Temperature dependence of magnetization of a dried ferrofluid sample after zero-field cooling (ZFC) and field cooling (FC).
Static birefringence measurements were performed to identify the magnetic core diameter and intrinsic birefringence δn0. Measurements of a ferrofluid containing a magnetite concentration of 0.2 mg/ml are shown in Fig. 7. Fitting the measured data with the analytical birefringence model (1) using Md = 4.46 A/m for Fe3O4, we obtained dm = 10.8 nm and δn0 = 0.11. The magnetic diameter is within the range expected from the magnetization measurements, while the extrapolated value for δn0 agrees with published data for particles of this size [10] and is consistent with form birefringence for prolate spheroids [17].
Fig. 7.
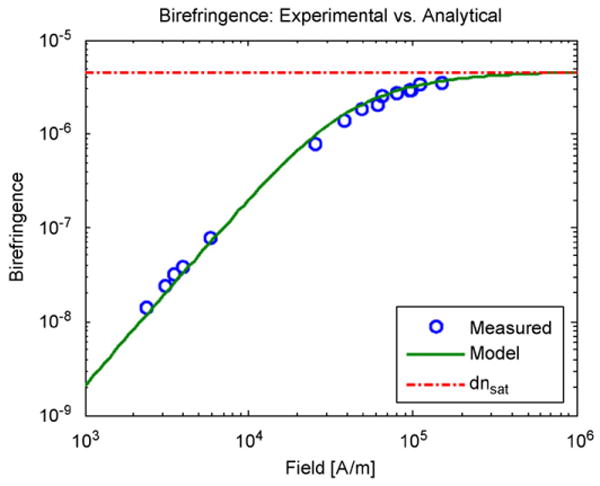
Static birefringence measurements of a ferrofluid with a concentration Φ = 4 × 10⁻⁵ magnetite by volume. The circles indicate measured values while the solid line represents a fit of Eq. (1) to the data with magnetic core diameter dm = 10.8 nm and δn0 = 0.11.
Dynamic birefringence measurements were performed at H0 = 4.8 kA/m (= 60 Oe). The real and imaginary components of the birefringence frequency response are shown in Fig. 8. Fitting the measured frequency response with the first order model from Eq. (2) yields a relaxation time constant of τn = 138 μs, corresponding to an average hydrodynamic diameter of dh = 103 nm, approximately 5% larger than the average diameter measured through DLS.
Fig. 8.
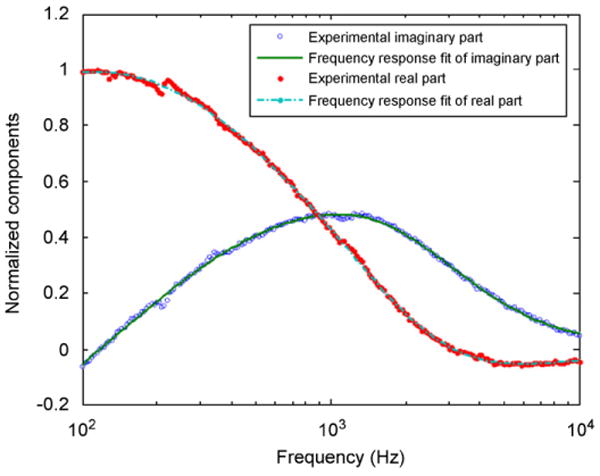
Real and imaginary components of the birefringence frequency response of a dextran-stabilized ferrofluid with a concentration Φ = 4× 10⁻⁵ magnetite by volume.
Biological binding experiments were performed on the antibody-functionalized Fe3O4 ferrofluid using dynamic birefringence measurements to monitor the average nanoparticle diameter following four reaction steps: first, using a suspension of bare (COOH-terminated) nanoparticles; second, following avidin coating; third, following reaction with the biotinylated antibody; and finally, after reaction with the IgG antigen. The imaginary component of the birefringence frequency response after each reaction is shown in Fig. 9. The peak birefringence frequency (fp), average nanoparticle diameter (dh), and change in diameter (Δdh) following each biological binding reaction are summarized in Table 1. The measured nanoparticle diameter increases by 7.8 nm following avidin coating, an increase that is consistent with the addition of a monolayer of avidin, which has a ∼4 nm diameter [18]. Similarly, the diameter increases by 14.2 nm following functionalization with anti-IgG antibodies and by 10.2 nm following incubation with IgG. The measured increase in diameter is in reasonable agreement with the known hydrodynamic diameter of IgG, which is ∼6 nm [19].
Fig. 9.
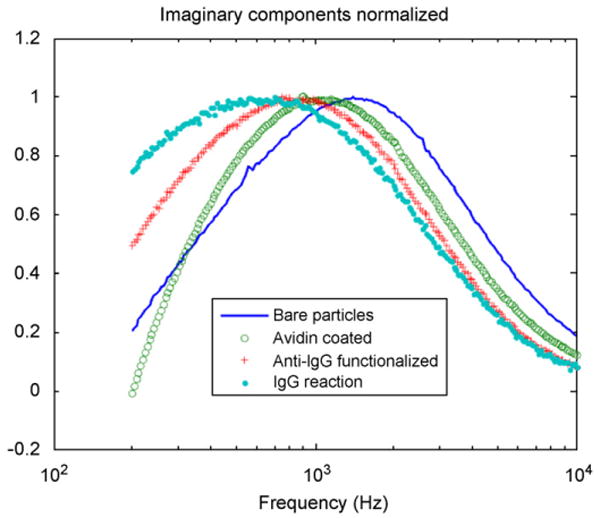
Imaginary component of the birefringence frequency response of the initial ferrofluid sample containing COOH-terminated FeO4 nanoparticles (solid line), after avidin coating (open circles), after reaction with the biotinylated antibody (crosses), and after reaction with the IgG antigen (dotted line).
Table 1.
Birefringence peak frequency (fp), average nanoparticle diameter (dh), and change in diameter (Δdh) following each biological binding reaction
| Reaction step | fp (Hz) | dh (nm) | Δdh (nm) |
|---|---|---|---|
| A. Bare Fe3O4 | 1582 | 92.6 | – |
| B. Avidin coated | 1242 | 100.4 | 7.8 |
| C. Anti-IgG functionalized | 822 | 115.2 | 14.8 |
| D. IgG reaction | 638 | 125.4 | 10.2 |
5. Discussion
To detect a small concentration of antigen molecules requires a very dilute ferrofluid since a significant fraction of the nanoparticles must form complexes with the antigen molecules. In the experiments presented here, measurements were performed on samples with a magnetite concentration of Φ = 40 ppm by volume, with a birefringence of Δn = 3 × 10⁻⁸ resulting at H0 = 4.8 kA/m. With a measurement wavelength of λ = 635 nm and a 1 mm thick ferrofluid sample, the birefringence results in a phase difference of φ0 = 3 × 10⁻⁴ rad. To increase measurement speed, a 100 ms integration time was used at each frequency point, resulting in an effective bandwidth of 15.7 Hz. Based on the measured 25 μV/√Hz noise floor of the balanced photodetector, the minimum detectable phase difference is φ0 = 1.3 × 10⁻⁶ rad, suggesting that measurements should be possible at magnetite concentrations on the order of 0.1 ppm. The measurement speed is sufficiently fast to allow continuous monitoring of the antibody–antigen binding reaction throughout the incubation period. Currently, a complete frequency response measurement is collected in 53 s. Based on this, up to 271 measurements of the nanoparticle diameter can be performed over the course of a 4-h incubation. Using such a continuous-monitoring scheme, the kinetics of antibody–antigen binding can be measured.
Our frequency response analysis assumes a first order system in which a single time constant dominates. Thus, an increase in the average particle diameter only shifts the peak of the imaginary component without changing the width of this peak. However, examination of Fig. 9 shows that the peak broadens after the addition of avidin and the antigen molecules. We attribute this broadening to an increase in the distribution of particle sizes. The increased size distribution may reflect the formation of dimers or chains of nanoparticles. More detailed analysis may allow the size distribution to be extracted from the frequency response data.
6. Conclusion
Dynamic birefringence measurements of antibody-functionalized ferrofluids provide a means to monitor biological binding reactions. The average hydrodynamic diameter estimated from these measurements compares well to diameter measurements made with DLS. Additionally, the increase in average hydrodynamic diameter after each binding reaction is consistent with the addition of a monolayer of molecules. The fact that birefringence measurements can be performed on very dilute ferrofluids suggests that this technique may be suitable for detecting low concentrations of antigen molecules. In addition, measurements may be made on extremely small sample volumes by reducing the diameter of the measurement beam, making this approach compatible with future lab-on-a-chip immunoassay devices.
Acknowledgments
The authors thank Kai Liu and Randy Dumas for magnetic property measurements, Mikaela Nichkova-Doseva for assistance with immunoassay protocols, and Angelique Louie and Zane Starkewolfe for DLS measurements. This publication was made possible by NSF award ECCS-0601383, the Materials Design Institute at UC Davis funded by the Los Alamos National Laboratory/UC Davis Educational Collaborative, Subcontract no. 2511-002-06, and Grant number 5 P42 ES004699 from the National Institute of Environmental Health Sciences (NIEHS), NIH. The contents are solely the responsibility of the authors and do not necessarily represent the official views of the NIEHS, NIH.
References
- 1.Rinaldi C, Franklin T, Zahn M, Cader T. Dekker Encyclopedia of Nanoscience and Nanotechnology. Marcel Dekker; 2004. [Google Scholar]
- 2.Pankhurst QA, Connolly J, Jones SK, Dobson J. J Phys D Appl Phys. 2003;36:R167. [Google Scholar]
- 3.Pamme N. Lab Chip. 2006;6:24. doi: 10.1039/b513005k. [DOI] [PubMed] [Google Scholar]
- 4.Gijs MAM. Microfluidics Nanofluidics. 2004;1:22. [Google Scholar]
- 5.Aytur T, Foley J, Anwar M, Boser B, Harris E, Beatty PR. J Immunol Methods. 2006;314:21. doi: 10.1016/j.jim.2006.05.006. [DOI] [PubMed] [Google Scholar]
- 6.Li GX, Wang SX, Sun SH. IEEE Trans Magn. 2004;40:3000. [Google Scholar]
- 7.Chemla YR, Grossman HL, Poon Y, McDermott R, Stevens R, Alper MD, Clarke J. Proc Natl Acad Sci USA. 1999;97:14268. doi: 10.1073/pnas.97.26.14268. [DOI] [PMC free article] [PubMed] [Google Scholar]
- 8.Chung SH, Hoffmann A, Guslienko K, Bader SD, Liu C, Kay B, Makowski L, Chen L. J Appl Phys. 2005;97:10R101. [Google Scholar]
- 9.Mao LD, Koser H. Nanotechnology. 2006;17:S34. doi: 10.1088/0957-4484/17/4/007. [DOI] [PubMed] [Google Scholar]
- 10.Hasmonay E, Dubois E, Bacri JC, Perzynski R, Raikher YL, Stepanov VI. Eur Phys J B. 1998;5:859. [Google Scholar]
- 11.Wilhelm C, Gazeau F, Roger J, Pons JN, Salis MF, Perzynski R, Bacri JC. Phys Rev E. 2002;65:031404. doi: 10.1103/PhysRevE.65.031404. [DOI] [PubMed] [Google Scholar]
- 12.Glockl G, Brinkmeier V, Aurich K, Romanus E, Weber P, Weitschies W. J Magn Magn Mater. 2005;289:480. [Google Scholar]
- 13.Meriguet G, Jardat M, Turq P. J Chem Phys. 2005;123 doi: 10.1063/1.2056551. [DOI] [PubMed] [Google Scholar]
- 14.Romanus E, Gross C, Glockl G, Weber P, Weitschies W. J Magn Magn Mater. 2002;252:384. [Google Scholar]
- 15.Hobbs PCD. Appl Opt. 1997;36:903. doi: 10.1364/ao.36.000903. [DOI] [PubMed] [Google Scholar]
- 16.Gilmore K, Idzerda YU, Klem MT, Allen M, Douglas T, Young M. J Appl Phys. 2005;97 doi: 10.1063/1.4757964. [DOI] [PMC free article] [PubMed] [Google Scholar]
- 17.Bragg WL, Pippard AB. Acta Crystallogr. 1953;6:865. [Google Scholar]
- 18.Pugliese L, Coda A, Malcovati M, Bolognesi M. J Mol Biol. 1993;231:698. doi: 10.1006/jmbi.1993.1321. [DOI] [PubMed] [Google Scholar]
- 19.Jossang T, Feder J, Rosenqvist E. J Protein Chem. 1988;7:165. doi: 10.1007/BF01025246. [DOI] [PubMed] [Google Scholar]