Abstract
Early detection of pediatric viruses is critical to effective intervention. A successful clinical tool must have a low detection limit, be simple to use and report results quickly. No current method meets all three of these criteria. In this report, we describe an approach that combines simple, rapid processing and label free detection. The method detects viral RNA using DNA hairpin structures covalently attached to a gold filament. In this design, the gold filament serves both to simplify processing and enable fluorescence detection. The approach was evaluated by assaying for the presence of respiratory syncytial virus (RSV) using the DNA hairpin probe 5′ [C6Thiol]TTTTTTTTTTCGACGAAAAATGGGGCAAATACGTCG[CAL] 3′ covalently attached to a 5 cm length of a 100 μm diameter gold-clad filament. This sequence was designed to target a portion of the gene end-intergenic gene start signals which is repeated multiple times within the negative-sense genome giving multiple targets for each strand of genomic viral RNA present. The filament functionalized with probes was immersed in a 200 μm capillary tube containing viral RNA, moved to subsequent capillary tubes for rinsing and then scanned for fluorescence. The response curve had a typical sigmoidal shape and plateaued at about 300 plaque forming units (PFU) of viral RNA in 20 μL. The lower limit of detection was determined to be 11.9 PFU. This lower limit of detection was ~200 times better than a standard comparison ELISA. The simplicity of the core assay makes this approach attractive for further development as a viral detection platform in a clinical setting.
Introduction
Respiratory viral infections are among the leading causes of medical care in the United States. The most common respiratory viruses in humans are influenza virus, parainfluenza, meta-pneumavirus and respiratory syncytial virus (RSV).1,2 RSV, a paramyxovirus, is the leading cause of lower respiratory tract infections in infants and young children and results in an estimated 90 000 hospitalizations annually in children under five years of age.3–5 Worldwide, RSV is the cause of death of over 1 million children per year.6 Furthermore, RSV is problematic for elderly and immuno-compromised populations.7,8
Recently, antivirals have been made available for treatment of RSV, but they are only effective when given in the early stages of infection, creating a need for early-stage diagnostics.9,10 The importance of these diagnostic tests is further emphasized by the fact that there is no approved vaccine for RSV.11 Rapid, simple and accurate diagnostic tests for early respiratory virus infections would give physicians additional information and help avoid the use of unnecessary antibiotics which has led to soaring rates of antibiotic resistance in the US.12–15
Although a number of diagnostic alternatives exist, none of them are fast, easy and sensitive enough to be an attractive option in a clinical setting. Viral infections are typically detected in clinical diagnostic labs using cell cultures, serology, or direct antigen detection, but each has a significant drawback. Cell cultures usually require expertise and extended observation time of up to ten days. Serological methods, which detect antibodies in response to a viral infection, are difficult to interpret when diagnosing repetitive or chronic viral infections such as RSV. Direct antigen detection, such as immunofluorescence, requires technical expertise in using a fluorescence microscope and is far from a simple diagnostic.16,17 Alternatively, PCR and immuno-PCR have proven to be very sensitive diagnostics; however, they require technical expertise and often suffer from high false positive rates due to DNA contamination.18–20
From the clinical perspective, one of the most attractive features of a recently published antibody-based virus detection technology approach is the simplicity of sample processing. This filament-based antibody recognition assay (FARA) utilizes an ELISA-like sandwich detection strategy that employs antibodies immobilized on a moveable polyester filament to capture antigen.21–23 The filament is then pulled through a series of capillary tubes to achieve assay processing and detection. Although FARA allows for rapid processing and detection, to date its sensitivity is comparable to ELISA, with a lower limit of detection of ~1.7 × 10⁷ virus particles.21
In this report, this filament-based design is modified to incorporate the use of a gold-clad filament as a fluorescence quencher for molecular beacon hairpin structures coupled along the construct at known locations. Molecular beacon detection strategies have proven very successful for identifying a variety of DNA targets, ranging from pathogens24 and cancer cells25,26 to single nucleotide polymorphisms.27 Molecular beacons are composed of single stranded DNA designed with 5′ and 3′ ends that are complementary to each other, ensuring that the beacon remains in a hairpin conformation in the absence of target DNA. One end of the beacon is functionalized with a fluorophore and the other with a quencher. While the beacon is in a hairpin conformation, the fluorophore is spatially close to the quencher and fluorescence is not observed, rendering the beacon in a “dark” state. In the presence of target DNA, however, the target anneals to the beacon, and the hairpin opens. As a result, the two ends of the beacon are spatially separated, eliminating quenching, resulting in a “bright” signal state. As shown in this report, the combination of molecular beacons with filament processing retains the simple and rapid processing design and improves the lower level of detection significantly.
Methods and materials
DNA preparation and immobilization on filaments
RSV hairpin DNA was purchased from Biosearch Technologies, the sequence of which can be found in Table 1 (RSV Probe) and is discussed in Results and discussion. Gold-plated tungsten filament (100 μm diameter) was purchased from Luma Metall Fine Wire Products (Kalmar, Sweden). 6-Mercapto-1-hexanol was purchased from Aldrich chemical company. All H2O used was Gibco ultraPURE DNAse RNAse Free. The buffer used was 10 mM phosphate buffer with 0.3 M NaCl, pH 7.0 (PB).
Table 1.
Oligonucleotide sequences used. The underlined regions of the sequence indicate the “stem” which keeps the hairpin closed in the absence of target RNA. CAL indicates the position of a CAL Fluor Red 590 dye which is a TAMRA equivalent
| Name | Sequence 5′ → 3′ |
|---|---|
| RSV probe | [C6Thiol]TTTTTTTTTTCGACGAAAAATGGGGCAAATACGTCG[CAL] |
| FemA target | ACGCTCACTATGAGTTAAAGCTTGCTGAAGGTTATGA |
| RSV target | TTTTTTATTTGCCCCATTTTTTTTTT |
| RSV primer1 | GCTCTTAGCAAAGTCAAGTTGAATGA |
| RSV primer2 | TGCTCCGTTGGATGGTGTATT |
| GAPDH primer1 | GGTGGTCTCCTCTGACTTC |
| GAPDH primer2 | CTCTTCCTCTTGTGCTCTTG |
Thiolated probe DNA sequences were received as disulfides and were activated by cleaving the disulfide bond. Cleavage was performed in 100 mM dithiothreitol (DTT), 0.1 M phosphate buffer, pH 8.3. After 0.5 h, thiolated DNA was purified using Millipore Microcon YM-3 spin filters. The purified DNA was diluted to 30 μM in H2O and stored in small aliquots at −80 °C.
Gold-plated filaments were cleaned by thorough rinsing in PB. The cleaned gold filament was incubated overnight at room temperature in a solution of PB containing 1 μM of activated DNA and 10 μM mercaptohexanol. After a minimum of 8 h, the filaments were removed from the DNA solution and rinsed with PB. The filaments were then stored at 4 °C in PB until use.
RSV infection of HEp-2 cells
Uninfected HEp-2 cells were incubated at 37 °C with 5% CO2 and grown to 80% confluency in OPTI-MEM media containing 2% fetal bovine serum, 200 mM L-glutamine, 250 μg mL−1 of amphotericin-B and 10 mg mL−1 gentamicin (c/OPTI-MEM/2%). Quick thawed virus diluted in c/OPTI-MEM/2% was used to infect 80% confluent HEp-2 cultures. Following infection, flasks were incubated at 37 °C, 5% CO2 for 4 days.
Titer of infected cells
An aliquot of infected cells was suspended in 1 mL c/OPTI-MEM/2% and used to determine the titer of the virus. The 1 mL of stock was then frozen using a slurry of ethanol and dry ice. After freezing, the supernatant was thawed in a 37 °C water bath. The freeze/thaw cycle was repeated three times to maximize the release of virus particles from the cell wall. After the third cycle, the supernatant was separated and used to infect three columns (18 wells) of a 24-well microtiter plate. Each successive row of the column was infected with a 10-fold serial dilution of the stock. After infection, the cells were incubated for 1 h at 37 °C and 5% CO2. The cells were then overlaid with 1 mL of media containing 0.75% (w/v) methylcellulose and incubated for 4 days at 37 °C and 5% CO2.
After incubation, the cells were fixed with cold 80% methanol and stored at 4 °C for at least 1 h. Cells were blocked with 2% BSA in Dulbeccos’ PBS (Mg2+ and Ca2+ free) for 1 h. After blocking, the cells were incubated for 30 min at room temperature with a 1 : 1000 dilution of anti-RSV F protein antibodies (final concentration of 20 μg mL−1). The cells were then washed with PBS and incubated in a 1 : 1000 dilution of secondary antibody (goat anti-mouse horseradish peroxidase (HRP) conjugate, product number SC-2005, Santa Cruz Biotechnology) for 1 h. Excess antibody was removed by rinsing with PBS. The HRP was then developed with a TrueBlue peroxidase precipitating substrate (KPL Protein Research Products) which rendered a colored dot. The dots were then counted to quantify the amount of plaque forming units (PFU).
RNA isolation from HEp-2 cells
Four days post-infection (for infected cells) or at 100% con-fluency (for uninfected cells), the cells were washed two times with PBS and then scraped from the flasks. The scraped cells were centrifuged at 1500 × g for five min to pellet the cells. The supernatant was removed and RNA was extracted in approximately 30 min using a 5-Prime PerfectPure RNA Cell and Tissue kit. Cells were lysed in lysis buffer and passed 10 times through a 22 gauge needle. The cell lysate was passed through a spin filter to bind nucleic acids. The filter was washed, treated with DNAse and washed two more times. Finally, the extracted RNA was eluted from the filter with H2O, and the concentration was obtained via UV-vis spectroscopy.
Viral RNA hydrolysis
Hydrolysis was performed by adding an equal volume of H2O to extracted RNA, followed by the addition of two volumes of carbonate buffer (pH 10.2). The RNA was then incubated at 65 °C for up to 60 min, depending on the amount of desired hydrolysis. In this experiment, samples were incubated for 0, 1, 5, 15, 30 and 60 min. After incubation, the hydrolysis was stopped with neutralization buffer (3 M sodium acetate, 1% (v/v) acetic acid; pH 6.0). Following neutralization, the hydrolyzed RNA was ethanol precipitated and, finally, resuspended in H2O and stored at −85 °C. To verify hydrolysis, the hydrolyzed samples were run on an Agilent 2100 Bioanalyzer, and the resulting electropherograms were examined.
RNA capture and detection
Gold-clad filaments were functionalized, as described above, with molecular beacon style capture DNA. The functionalized filament was then incubated for 2 h at room temperature in PB containing 3 ng μL−1 of total RNA extracted from RSV-infected and uninfected cells. Following capture of the target RNA, the filament was washed for 1 min in 2X sodium citrate/sodium chloride (SSC), 1X SSC, 0.1X SSC and finally in PB. The filament was then mounted on a glass slide and imaged. Fluorescence measurements of the filament were performed on an Axon Instruments GenePix 4000B microarray scanner. The scanner is equipped with excitation lasers of 532 nm (green) and 635 nm (red), and 575DF35 and 670DF40 emission filters. Fluorescence was quantified using GenePix software. Regions of interest (ROI) were created along the entire length of the filaments, and the ROIs were averaged to obtain the average fluorescence along the filament.
Real time RT-PCR for PFU quantitation of RNA samples
In order to compare these results to other diagnostics, such as ELISA, a portion of each sample was used to determine the number of PFUs in that sample. This conversion from RNA concentration to PFU was done using real time RT-PCR (reverse transcription-polymerase chain reaction) to generate a standard curve relating delta (Δ) cycle threshold (Ct) of RSV RNA and GAPDH RNA to PFU. In PCR based RSV diagnostics, GAPDH has been shown to be a potential internal control when comparing samples. Therefore, samples of known PFU were processed using real time RT-PCR to determine the Ct with either RSV specific primers or GAPDH specific primers. The GAPDH Ct was then subtracted from the RSV Ct to calculate the ΔCt of the sample. When plotted against the log10 of PFU, a simple linear relationship was determined. This linear relationship was then used to calculate the PFU of unknown samples using only the ΔCt of the sample.
Real time RT-PCR was performed using a SmartCycler II thermal cycler system (Cepheid, Sunnyvale, CA, USA). Reactions were done in a 25 μL volume with 12.5 μL of 2X One-Step qRT-PCR Buffer plus SYBR (product #639518, Clontech), 0.5 μL of 50X QTaq DNA Polymerase Mix (product #639518, Clontech), 0.4 μL of 60X qRT Mix (product #639518, Clontech), 200 nM left and right primers (RSV or GAPDH primers, Table 1), and H2O. The protocol consisted of RT followed by a three-step PCR. RT was performed at 48 °C for 20 min followed by an initial QTaq DNA polymerase activation step of 95 °C for 3 min and 40 cycles at 95 °C for 15 s to denature, 60 °C for 60 s to anneal and extend, and 72 °C for 15 s to detect fluorescence.
ELISA
A standard indirect sandwich ELISA was performed.28 A stock solution of RSV-infected HEp-2 cell lysate (3.0 × 10⁴ PFU mL−1) was serially diluted 1 : 2 and used to determine the lower limit of detection. To allow capture antibodies to bind to the Immulon 2HB microtiter plate, 100 μL of 2 μg mL−1 F-mix (an equal mixture of two anti-RSV fusion protein antibodies, clones 1269 and 1214) was added to three rows of the 96-well plate and placed in a humidified box at room temperature for 1 h. After 1 h, the wells were rinsed three times with PBS and blocked with 2% BSA for 10 min. After blocking, BSA was removed from the wells and 100 μL of infected cell lysate stock was placed in the three rows of column 1 and serial dilutions in columns 2 through 11, leaving column 12 for PBS. The plate was then placed back in a humidified box at room temperature for 1 h. Following antigen binding, the wells were rinsed three times with PBS and 100 μL of 10 μg mL−1 of primary antibody (Synagis, humanized monoclonal antibody, MedImmune Inc. NDC 60574-4114-1) was added to each well. The plate was placed in a humidified box at room temperature for 1 h. The wells were then rinsed three times with PBS and 100 μL of secondary antibody (1 : 1000 dilution of goat anti-human HRP conjugated, Pierce 31410) was added to each well. After 1 h in a humidified box at room temperature, the wells were rinsed five times with PBS. Next, 100 μL of substrate (tetramethylbenzidine, Pierce T4444) was added to each well and the enzymatic reaction was allowed to proceed for 10 min, after which it was quenched with 100 μL 2 M H2SO4. Finally, absorbance at 450 nm was measured using a Bio-Tek Synergy HT microplate reader.
Results and discussion
Design
The following viral detection design utilizes a molecular beacon style hairpin DNA covalently coupled to a moveable gold-clad filament. This allows the viral probes attached to the filament to be easily added to and removed from processing solutions. In adapting molecular beacons for use with the simple processing offered by FARA, the quenching function is performed by the gold-clad filament itself. Studies have shown that fluorophores in close proximity to metal surfaces can experience changes in emission intensity.29,30 Specifically, metal surfaces have been shown to quench a beacon while it is in a hairpin conformation.31–34 This quenching effect is typically only observed at fluorophore to metal distances of ≤5–10 nm, which is on the scale of Forster energy transfer processes.30,34 By using a metal filament for probe DNA attachment, the metal filament can be used as a quencher for the beacon in the closed state.
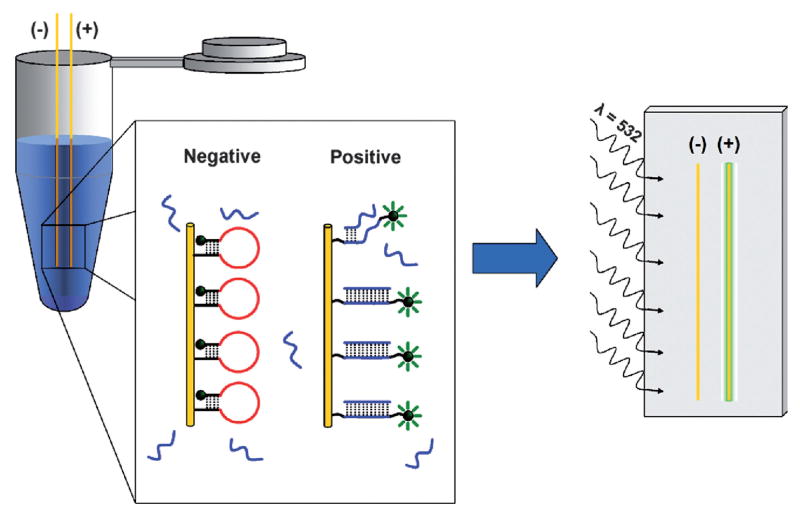
The sequence of hairpin DNA used in this study to target RSV viral RNA is shown in Table 1. The RSV specific probe is designed so that the initial loop region targets a gene end-intergenic start sequence which has three exact repeats and six almost-exact repeats with various numbers of nucleotide mismatches throughout the RSV genome.35,36 Similar intergenic repeats are common in other RNA viruses,37 suggesting that the approach may be generalized to the study of other viruses. Successfully used in antisense and small interfering RNA experiments,36–38 this site was considered the most accessible and, therefore, a prime site for oligonucleotide binding and probe targeting. As shown in Table 1, this RSV specific sequence is then flanked by five base stem regions that hold the DNA in a closed conformation in the absence of RSV RNA. The 5′ end of the hairpin is further functionalized with a 10-base poly-T linker. Of the four possible nucleotides, thymines are the least reactive with gold surfaces.39 This sequence promotes favorable orientation and binding of the DNA through the 5′ thiol with minimal adsorption to the surface. Additionally, the 3′ end of the hairpin is functionalized with a TAMRA equivalent dye to facilitate detection. Prior to RNA binding, the stem region of the probe ensures that the DNA maintains a hairpin conformation. Upon binding of viral RNA, the probe undergoes a conformational change that increases the distance between the fluorophore and the gold-clad filament which results in an increased fluorescence signal (Fig. 1).
Fig. 1.
Illustration of the filament-based assay method. In an analyte solution, a conformational change is observed when the molecular beacon style probe DNA binds target DNA/RNA. In the closed conformation (negative), the fluorophore is in close proximity to the gold surface and is quenched. Upon binding the target (positive), the fluorophore becomes spatially separated from the gold surface. After binding the target, the filaments are rinsed and mounted to a glass slide for imaging. Upon excitation at the desired wavelength (532 nm), fluorophores that have bound target and are in an open conformation will exhibit a distinct fluorescence signal (575 nm).
Effect of probe density on signal-to-noise
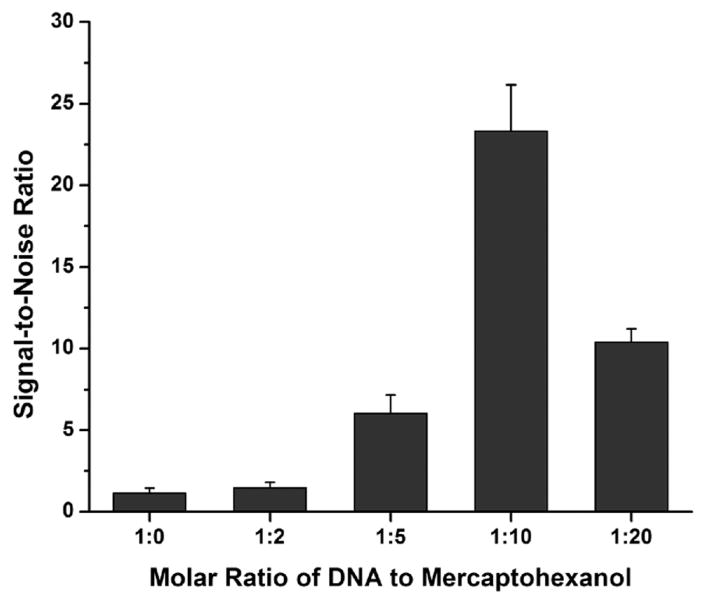
Initial studies indicated that the gold surface quenches the 3′ hairpin fluorophore when the hairpin is in a closed state and that this quenching is dependent on probe density at the gold surface. Gold-clad filaments were functionalized with various molar ratios (1 : 0 to 1 : 20) of RSV probe DNA (Table 1) and mercaptohexanol. The mercaptohexanol competes with the probe DNA for binding at the gold surface, separating DNA beacons at higher molar ratios of mercaptohexanol. After being functionalized, half of the filaments were imaged to gather information about the dark state at each of the molar ratios. The other half of the filaments were incubated with 100 nM RSV target DNA (Table 1) to open the hairpin probes and then imaged for information about the bright state at each of the molar ratios. Fluorescence data from both the dark and bright states was then used to calculate the signal-to-noise ratio for each of the conditions (Fig. 2). These results were then used to optimize the probe density along the filament for all subsequent experiments.
Fig. 2.
Effect of probe spacing on fluorescence. Comparison of the signal-to-noise ratio of filaments functionalized with mixed monolayers of RSV probe DNA and mercaptohexanol.
At low concentrations of mercaptohexanol (1 : 0, 1 : 2 and 1 : 5), the signal-to-noise ratio is low due to the lack of quenching in the dark state. At these concentrations, the monolayer is principally composed of probe DNA. At this attachment density, the DNA strands are too close together to fold into the hairpin conformation, thus resulting in substantial fluorescence in the dark state. In higher mercaptohexanol concentrations (1 : 10), the DNA strands have sufficient room to fold into the hairpin conformation, resulting in adequate quenching and a substantially higher signal-to-noise ratio. At the highest mercaptohexanol concentration tested (1 : 20), the noise no longer decreased as the DNA had sufficient room to adopt the hairpin conformation. Additionally, the signal-to-noise ratio was reduced due to a lower density of probe DNA on the gold surface.
Specificity of filament-based detection
The specificity of the RSV-targeted filament was examined against positive (RSV) and negative (femA) control compliments (Table 1). RSV target DNA is the synthetic DNA equivalent of the RSV RNA targeted by the RSV probe. The femA sequence, a portion of the femA gene32 which encodes a protein whose expression is necessary for methicillin resistance in Staphylococcus aureus, was selected to be a biologically significant probe with a similar GC content to that of the RSV target.
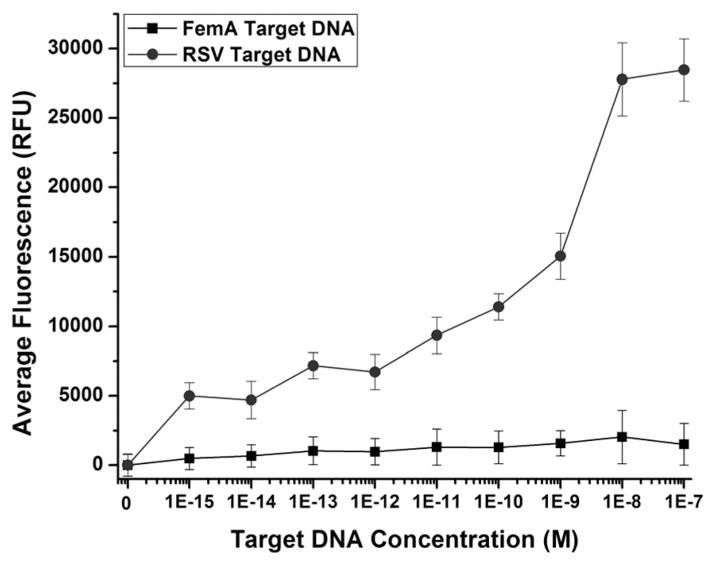
As Fig. 3 illustrates, hairpin opening due to target capture was highly dependent on the sequence of the target DNA in solution. To test this, filaments functionalized with RSV specific probe DNA were incubated with various concentrations of either RSV target DNA or femA target DNA (Table 1), ranging from 1 fM to 100 nM. At femtomolar concentrations of femA target DNA, the filaments functionalized with RSV probes remain primarily in the dark state. At high nanomolar concentrations of femA, probes begin to open slightly, but this signal is still below a 5σ limit of detection and significantly less than the signal generated by the RSV probes at 1 fM RSV target DNA. It is apparent that concentrations greater than 100 nM femA target DNA can force nonspecific interactions; however, across the range of concentrations tested, the signal was significantly higher in RSV target DNA than in the nonspecific femA target DNA.
Fig. 3.
Specificity of probe functionalized filaments. Comparison of filament-functionalized RSV probes in the presence of increasing concentrations of RSV target DNA and nonspecific femA target DNA.
Detection of viral RNA
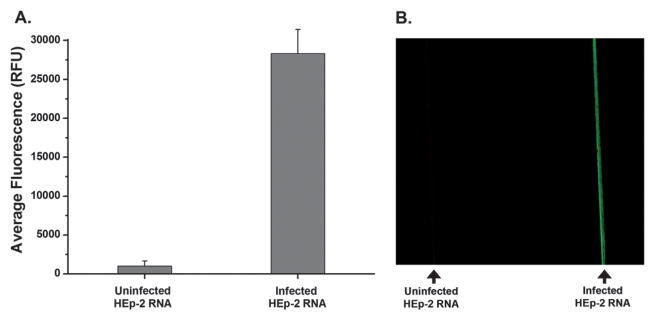
As expected, RSV-targeted filaments detect viral RNA isolated from infected cells. This was demonstrated using functionalized gold-clad filaments incubated in capillaries with 20 μL of RNA (3 ng μL−1) from either uninfected or RSV-infected HEp-2 cells. As seen in Fig. 4, the filament-coupled DNA probes have two states: a dark state corresponding to a probe that remains in a closed conformation and a bright state corresponding to a probe that has captured viral RNA. The high quenching efficiency for the closed state allows for ease of detection when comparing uninfected cells (1006 RFU) to RSV-infected cells (28 325 RFU). Using the average fluorescence values along the entire length of the filaments; the quenching efficiency of the gold filament for probe DNA in a hairpin conformation was found to be ~97%.
Fig. 4.
Response of probe DNA upon target binding. (A) The average fluorescence along filaments functionalized with RSV probe DNA that have been exposed to lysates from either uninfected HEp-2 cells (left) or RSV-infected cells (right). (B) An image of these same filaments.
Optimum length of target RNA
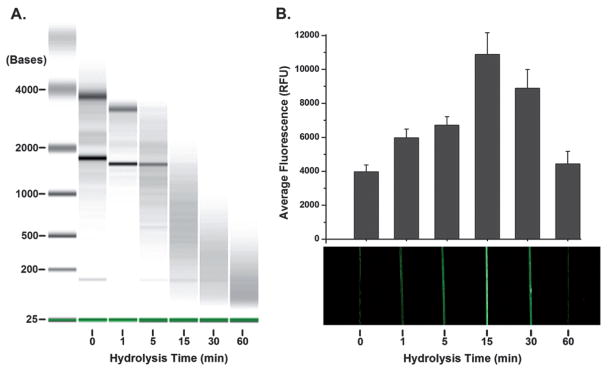
The genomic sequence targeted was selected because it is not only specific to RSV but also repeated throughout the genome. Therefore, hydrolyzing the RSV into smaller fragments would make the repeated sites more available for capture by probe DNA and improve capture efficiency.40 As expected, the changes in the RNA lengths confirm an increase in hydrolysis over time when measured by an Agilent bioanalyzer (Fig. 5A). Signal increased to 2.5-fold of full length genomic RNA after 15 min of hydrolysis (Fig. 5B). These results indicate that short hydrolysis times result in decreased viral RNA lengths, making the target easier to capture and also increasing the number of target sites available for capture. However, with hydrolysis times greater than 30 min, these benefits are overcome by degradation of target sequences.
Fig. 5.
Effect of target RNA length on detection. (A) Electropherogram verifying the hydrolysis of RNA at each of the time points. (B) Average fluorescence and an image showing the effect of target RNA length on the resulting signal. At fifteen minutes the highest signal was observed.
Beacon-filament limit of detection
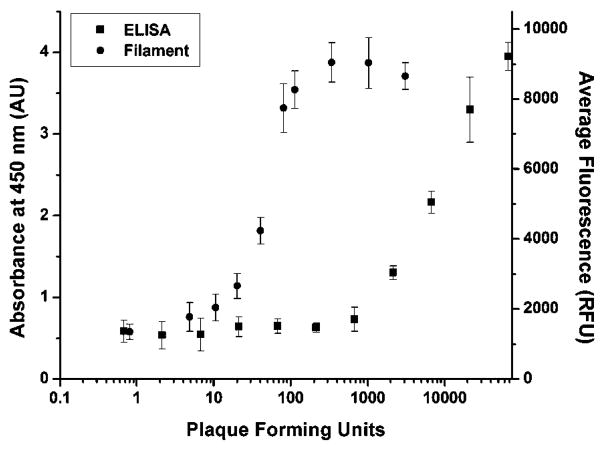
The beacon-filament lower limit of detection was approximately 200 times lower than a comparison ELISA. Filaments were incubated in solutions containing increasing amounts of RNA isolated from RSV-infected cells while keeping the concentration of total RNA constant at 3 ng μL−1. The amount of the RNA isolated from RSV-infected cells ranged from RNA isolated from uninfected cells (0 ng μL−1), to that isolated from infected cells (3 ng μL−1). Real time RT-PCR was then used to convert the nanograms of RNA from infected cells to PFU. Fig. 6 compares the limit of detection of the filament-based assay and ELISA. Using a 5σ limit of detection, the filament-based assay was able to detect as few as 11.9 PFU while the limit of detection for ELISA was 1750 PFU. Using real time RT-PCR and a stock of RSV-N gene of a known concentration, the 11.9 PFU limit of detection was calculated to be equivalent to ~5000 copies of genomic RSV viral RNA in 20 μL. This corresponds to a limit of detection of 4.15 × 10⁻¹⁶ M (~400 aM) RSV viral RNA. Additionally, the linear range of the filament assay was reliable up to 115 PFU (R2 = 0.97) after which the signal generated from the filaments saturated (ESI).†
Fig. 6.
Comparison of the RSV detection using ELISA or the developed filament-based assay. The limit of detection using ELISA was 1750 PFU while the filament had a limit of detection of 11.9 PFU.
Conclusions
DNA functionalized gold-clad filaments responded only to RSV RNA, even in high concentrations of cellular RNA from uninfected HEp-2 cells. Although these studies focused on the detection of viral RNA from cultured cells, ongoing research is exploring the functionality of the filaments in clinical samples. These samples, nasopharyngeal aspirates from RSV-infected children, will further demonstrate the clinical utility of the DNA functionalized filaments. The filament assays represent a core technology that has the potential to be much simpler than ELISAs, requiring only movement from one capillary to another, whereas an ELISA requires pipetting, washing, blocking and enzymes to develop the signal. Additionally, the filaments proved to be much more sensitive than ELISA, detecting as few as 12 PFU. Both the sensitivity and simplicity of DNA functionalized filaments make them a promising alternative in the development of an improved clinical diagnostic.
Supplementary Material
Footnotes
Electronic supplementary information (ESI) available: Standard curve showing the linear range of the filament-based assay. See DOI:10.1039/b904191e
References
- 1.Boivin G, Cote S, De Serres G, Gilca R, Bergeron MG, Dery P. Intersci Conf Antimicrob Agents Chemother. 2003. [Google Scholar]
- 2.Clyde WA., Jr Environ Health Perspect. 1980;35:107–112. doi: 10.1289/ehp.8035107. [DOI] [PMC free article] [PubMed] [Google Scholar]
- 3.Davidson T. In: Gale Encyclopedia of Medicine. Olendorf D, Jeryan C, Boydon K, Fyke MK, editors. Vol. 4. Gale Group; Detriot, MI: 1999. pp. 2478–2480. [Google Scholar]
- 4.Shay DK, Holman RC, Roosevelt GE, Clarke MJ, Anderson LJ. J Infect Dis. 2001;183:16–22. doi: 10.1086/317655. [DOI] [PubMed] [Google Scholar]
- 5.Tang RS, Spaete RR, Thompson MW, MacPhail M, Guzzetta JM, Ryan PC, Reisinger K, Chandler P, Hilty M, Walker RE, Gomez MM, Losonsky GA. Vaccine. 2008;26:6373–6382. doi: 10.1016/j.vaccine.2008.09.018. [DOI] [PubMed] [Google Scholar]
- 6.Cruz AT, Cazacu AC, Greer JM, Demmler GJ. J Clin Microbiol. 2007;45:1993–1995. doi: 10.1128/JCM.00279-07. [DOI] [PMC free article] [PubMed] [Google Scholar]
- 7.Falsey AR, Hennessey PA, Formica MA, Cox C, Walsh EE. New Engl J Med. 2005;352:1749–1759. doi: 10.1056/NEJMoa043951. [DOI] [PubMed] [Google Scholar]
- 8.Sethi S, Murphy TF. New Engl J Med. 2005;352:1810–1812. doi: 10.1056/NEJMe058036. [DOI] [PubMed] [Google Scholar]
- 9.Iwane MK, Edwards KM, Szilagyi PG, Walker FJ, Griffin MR, Weinberg GA, Coulen C, Poehling KA, Shone LP, Balter S, Hall CB, Erdman DD, Wooten K, Schwartz B for the New Vaccine Surveillance Network. Pediatrics. 2004;113:1758–1764. doi: 10.1542/peds.113.6.1758. [DOI] [PubMed] [Google Scholar]
- 10.Shay DK, Holman RC, Newman RD, Liu LL, Stout JW, Anderson LJ. JAMA. 1999;282:1440–1446. doi: 10.1001/jama.282.15.1440. [DOI] [PubMed] [Google Scholar]
- 11.Kaur J, Tang RS, Spaete RR, Schickli JH. J Virol Methods. 2008;153:196–202. doi: 10.1016/j.jviromet.2008.07.012. [DOI] [PubMed] [Google Scholar]
- 12.Cohen ML. Science. 1992;257:1050–1055. doi: 10.1126/science.257.5073.1050. [DOI] [PubMed] [Google Scholar]
- 13.Dowell SF, Schwartz B. Am Fam Physician. 1997;55:1647. [PubMed] [Google Scholar]
- 14.Kunin CM. Ann Intern Med. 1993;118:557–561. doi: 10.7326/0003-4819-118-7-199304010-00011. [DOI] [PubMed] [Google Scholar]
- 15.Neu HC. Science. 1992;257:1064. doi: 10.1126/science.257.5073.1064. [DOI] [PubMed] [Google Scholar]
- 16.Dunn JJ, Gordon C, Kelley C, Carroll KC. J Clin Microbiol. 2003;41:2180–2183. doi: 10.1128/JCM.41.5.2180-2183.2003. [DOI] [PMC free article] [PubMed] [Google Scholar]
- 17.Welliver RC. Clin Microbiol Rev. 1988;1:27–39. doi: 10.1128/cmr.1.1.27. [DOI] [PMC free article] [PubMed] [Google Scholar]
- 18.Barletta J. Mol Aspects Med. 2006;27:224–253. doi: 10.1016/j.mam.2005.12.008. [DOI] [PubMed] [Google Scholar]
- 19.Kox LF, Rhienthong D, Miranda AM, Udomsantisuk N, Ellis K, van Leeuwen J, van Heusden S, Kuijper S, Kolk AH. J Clin Microbiol. 1994;32:672–678. doi: 10.1128/jcm.32.3.672-678.1994. [DOI] [PMC free article] [PubMed] [Google Scholar]
- 20.LeGoff J, Kara R, Moulin F, Si-Mohamed A, Krivine A, Belec L, Lebon P. J Clin Microbiol. 2008;46:789–791. doi: 10.1128/JCM.00959-07. [DOI] [PMC free article] [PubMed] [Google Scholar]
- 21.Stone G, Wetzel J, Russ P, Dermody T, Haselton F. Ann Biomed Eng. 2006;34:1778–1785. doi: 10.1007/s10439-006-9199-0. [DOI] [PMC free article] [PubMed] [Google Scholar]
- 22.Stone GP, Lin KS, Haselton FR. J Biomed Opt. 2006;11:034012. doi: 10.1117/1.2209907. [DOI] [PMC free article] [PubMed] [Google Scholar]
- 23.Stone GP, Mernaugh R, Haselton FR. Biotechnol Bioeng. 2005;91:699–706. doi: 10.1002/bit.20537. [DOI] [PMC free article] [PubMed] [Google Scholar]
- 24.Vet JAM, Majithia AR, Marras SAE, Tyagi S, Dube S, Poiesz BJ, Kramer FR. Proc Natl Acad Sci. 1999;96:6394–6399. doi: 10.1073/pnas.96.11.6394. [DOI] [PMC free article] [PubMed] [Google Scholar]
- 25.Peng XH, Cao ZH, Xia JT, Carlson GW, Lewis MM, Wood WC, Yang L. Cancer Res. 2005;65:1909–1917. doi: 10.1158/0008-5472.CAN-04-3196. [DOI] [PubMed] [Google Scholar]
- 26.Santangelo P, Yang L, Bao G. Summer Bioengineering Conference. Key Biscayne; Florida: 2003. [Google Scholar]
- 27.Mhlanga MM, Malmberg L. Methods. 2001;25:463–471. doi: 10.1006/meth.2001.1269. [DOI] [PubMed] [Google Scholar]
- 28.Crowther JR. The ELISA Guidebook. 2. Humana Press; Totowa, NJ: 2001. [Google Scholar]
- 29.Lakowicz JR. Anal Biochem. 2005;337:171–194. doi: 10.1016/j.ab.2004.11.026. [DOI] [PMC free article] [PubMed] [Google Scholar]
- 30.Neumann T, Johansson ML, Kambhampati D, Knoll W. Adv Funct Mater. 2002;12:575–586. [Google Scholar]
- 31.Du H, Disney MD, Miller BL, Krauss TD. J Am Chem Soc. 2003;125:4012–4013. doi: 10.1021/ja0290781. [DOI] [PubMed] [Google Scholar]
- 32.Du H, Strohsahl CM, Camera J, Miller BL, Krauss TD. J Am Chem Soc. 2005;127:7932–7940. doi: 10.1021/ja042482a. [DOI] [PubMed] [Google Scholar]
- 33.Sha MY, Yamanaka M, Walton ID, Norton SM, Stoermer RL, Keating CD, Natan MJ, Penn SG. Nanobiotechnology. 2005;1:327–336. doi: 10.1385/NBT:1:4:327. [DOI] [PMC free article] [PubMed] [Google Scholar]
- 34.Stoermer RL, Keating CD. J Am Chem Soc. 2006;128:13243–13254. doi: 10.1021/ja0637200. [DOI] [PMC free article] [PubMed] [Google Scholar]
- 35.Fearns R, Peeples ME, Collins PL. J Virol. 2002;76:1663–1672. doi: 10.1128/JVI.76.4.1663-1672.2002. [DOI] [PMC free article] [PubMed] [Google Scholar]
- 36.Jairath S, Brown Vargas P, Hamlin HA, Field AK, Kilkuskie RE. Antiviral Res. 1997;33:201–213. doi: 10.1016/s0166-3542(96)01015-7. [DOI] [PubMed] [Google Scholar]
- 37.Xu Z, Kuang M, Okicki JR, Cramer H, Chaudhary N. Antiviral Res. 2004;61:195–206. doi: 10.1016/j.antiviral.2003.10.005. [DOI] [PubMed] [Google Scholar]
- 38.Player MR, Barnard DL, Torrence PF. Proc Natl Acad Sci USA. 1998;95:8874–8879. doi: 10.1073/pnas.95.15.8874. [DOI] [PMC free article] [PubMed] [Google Scholar]
- 39.Storhoff JJ, Elghanian R, Mirkin CA, Letsinger RL. Langmuir. 2002;18:6666–6670. [Google Scholar]
- 40.Liu WT, Guo H, Wu JH. Appl Environ Microbiol. 2007;73:73–82. doi: 10.1128/AEM.01468-06. [DOI] [PMC free article] [PubMed] [Google Scholar]
Associated Data
This section collects any data citations, data availability statements, or supplementary materials included in this article.


