Abstract
The double knockout mouse for utrophin and dystrophin (utr−/−/mdx) has been proposed to be a better model of Duchenne Muscular Dystrophy (DMD) than the mdx mouse because the former displays more similar muscle pathology to that of the DMD patients. In this paper the properties of action potentials (APs) and Ca2+ transients elicited by single and repetitive stimulation were studied to understand the excitation-contraction (EC) coupling alterations observed in muscle fibers from mdx and utr−/−/mdx mice. Based on the comparison of the AP durations with those of fibers from wild-type (WT) mice, fibers from both mdx and utr−/−/mdx mice could be divided in two groups: fibers with WT-like APs (group 1) and fibers with significantly longer APs (group 2). Although the proportion of fibers in group 2 was larger in utr−/−/mdx (36%) than in mdx mice (27%), the Ca2+ release elicited by single stimulation was found to be similarly depressed (32–38%) in utr−/−/mdx and mdx fibers compared with WT counterparts regardless of the fiber's group. Stimulation at 100 Hz revealed that, with the exception of those from utr−/−/mdx mice, group 1 fibers were able to sustain Ca2+ release for longer than group 2 fibers, which displayed an abrupt limitation even at the onset of the train. The differences in behavior between fibers in groups 1 and 2 became almost unnoticeable at 50 Hz stimulation. In general, fibers from utr−/−/mdx mice seem to display more persistent alterations in the EC coupling than those observed in the mdx model.
Keywords: muscular dystrophy, mammalian skeletal muscle, fluorescence microscopy
dmd, the most common and severe form of childhood muscular dystrophy, results from mutations in the dystrophin gene that lead to lack or nonfunctional expression of the membrane-associated cytoskeletal protein dystrophin (10, 18, 20, 25). In healthy muscle, dystrophin is proposed to act as a linker between the cytoskeleton and the extracellular matrix through its interaction with proteins of the dystrophin-glycoprotein complex (DGC) located on the plasma membrane (17). Most of the current knowledge about DMD pathophysiology comes from studies using the mdx mouse as a model because it lacks the expression of dystrophin. Furthermore, in both mdx mice and DMD patients, muscles undergo multiple muscle fiber degeneration/regeneration cycles and display reduced specific active force (18, 28). In this regard, it is noteworthy that the reduction in the Ca2+ release from the sarcoplasmic reticulum (SR) evoked by single AP stimulation (16, 30) in fibers from flexor digitorum brevis (FDB) muscles of mdx mice (with respect to WT mice) may explain the muscle weakness. Our laboratory further demonstrated that the voltage dependence of the excitation-contraction (EC) coupling process is not altered in mdx muscle fibers, and that the Ca2+ release limitation was not related to obvious changes in the properties of the APs nor to noticeable alterations in the structure or electrical characteristics of the transverse tubular system (TTS) (9, 29, 30).
Despite its attractiveness as a model for DMD, mdx mice, unlike DMD patients, have a nearly normal lifespan and do not develop severe myofibrosis and cardiomyopathy (5, 6, 13). As an explanation for the relatively mild pathophysiology exhibited by mdx mice, it has been suggested that utrophin, a dystrophin homologue coded by an autosomic gene (13, 25) and overexpressed in mdx mice, can compensate for the lack of dystrophin. In support of this hypothesis, two different groups (6, 13) developed a double knockout mouse for utrophin and dystrophin (utr−/−/mdx) and discovered that these mice are smaller than age-matched WT mice and display pronounced kyphosis, progressive muscle wasting, impaired mobility, and premature death. Altogether, research with this animal model has revealed that, though not an authentic genetic model of DMD, the utr−/−/mdx mouse better recapitulates the overall human pathology than the mdx mouse.
The purpose of the current work was to investigate whether the more severe phenotype of utr−/−/mdx mice is associated with a worsening of the impairment in the EC coupling seen in mdx muscle fibers. Overall, we found that fibers from utr−/−/mdx mice display a similar impairment in the Ca2+ release to that observed in mdx muscle fibers. However, these limitations become complicated by alterations in the electrical properties of the fibers, which are particularly pervasive in a subpopulation of fibers from the utr−/−/mdx animal model. We further demonstrate that high-frequency stimulation (e.g., 100 Hz), which is more akin the normal pattern of stimulation of mammalian skeletal muscle fibers under central nervous system (CNS) control (14), help to unmask intrinsic limitations in the EC coupling process, which may not be readily observable with low frequency or single pulse stimulation. A preliminary version of this work has been presented to the Biophysical Society (4).
MATERIALS AND METHODS
All the procedures involving animals were approved and carried out according to the guidelines of the UCLA Animal Care Committee. WT mice (C57Bl/10J) were purchased from the Jackson Laboratories (Bar Harbor, ME), and mdx (C57BL/10ScSn-mdx/J) and utr−/−/mdx mice (>2–3 mo old) came from colonies established in our laboratory using founders obtained from the Jackson Laboratories and from Dr. J. R. Sanes, respectively. Genotyping was done by using PCR protocols as previously described (1, 12). Isolated fibers from FDB or interosseus (IO) muscles were obtained by enzymatic dissociation [40 min treatment with 3 mg/ml collagenase type 2 (Worthington) in a shaking bath (40 spm at 36°C) (29)]. Since FDB and IO muscles from utr−/−/mdx mice contain fibers of smaller diameter than those from mdx and WT mice (see Table 1), all the experiments were performed in small fibers while attempting to match their diameters. In addition, only nonbranched muscle fibers were used.
Table 1.
Dimensions of muscle fibers isolated from WT, mdx, and utr−/−/mdx mice
| Mice Strain | n | Fiber Diameter, μm | Fiber Length, μm |
|---|---|---|---|
| WT | 27 | 42.6 ± 9.9 | 456 ± 7 |
| mdx | 28 | 41.5 ± 7.9 | 479 ± 8 |
| utr−/−/mdx | 22 | 36.2 ± 8.6* | 409 ± 8* |
Values are means ± SD; n is the number of mice. WT, wild-type mice; mdx, dystrophin mice; utr, utrophin mice. utr−/−/mdx, double knockout mice for utrophin and dystrophin.
P < 0.05 ANOVA unpaired t-test comparison with WT values.
Electrophysiological techniques.
A two-microelectrode amplifier was used to stimulate the fibers and to record the membrane potential as described previously (9, 29, 30). Both current and voltage electrodes were filled with an internal solution containing (in mM): 78 K-aspartate, 30 EGTA, 15 Ca(OH)2, 20 K-MOPS, 5 ATP disodium, 5 MgCl2, 5 phosphocreatine disodium, and 5 glutathione, plus 0.1 g/l phosphocreatine kinase; pH adjusted to 7.2 with KOH. The resistance of the electrodes was ∼10 MΩ. The composition of the external Tyrode solution was (in mM): 145 NaCl, 5 KCl, 2 CaCl2, 1 MgCl2, 10 Na-MOPS, and 10 dextrose; pH 7.2. The resting potential of the fibers was maintained at −90 mV by the injection of a small steady current through the current electrode (<15 nA, see Ref. 30); fibers requiring more than 15 nA were discarded. Single suprathreshold current pulses of 0.5 ms in duration, or trains of 30 pulses of the same duration delivered at frequencies ranging from 25 to 100 Hz, were used. The pulse amplitude was in the range of 200–300 nA. A resting period of 2 min was allowed between consecutive single pulse stimulations or 5 min between trains.
Ca2+ release measurements.
Intracellular Ca2+ concentration changes elicited by single APs, or trains of APs, were detected by using the low-affinity fluorescent Ca2+ indicator Oregon Green BAPTA-5N [OGB-5N (Invitrogen), 250 μM]. Fluorescence changes, hereafter called OGB-5N transients, or Ca2+ transients, are normalized in ΔF/F units (8, 29, 30). A period of 30 min was allowed for dye diffusion and equilibration before starting the stimulation protocols. The optical setup used for global illumination/detection is based on an inverted fluorescence microscope (IX-70, Olympus, Japan). A 100-W tungsten-halogen lamp was used as a source of light, and excitation/emission wavelengths were selected using the following filter combination: 460–500 nm/505DRLP/512-558 nm (excitation/dichroic/emission; Chroma). A photodiode (UV-100, UDT) connected to a patch-clamp amplifier (Axopatch 200A, Axon Instruments) was used to detect the OGB-5N fluorescence. Experiments were performed at room temperature (18–19°C).
Data acquisition, analysis, and statistics.
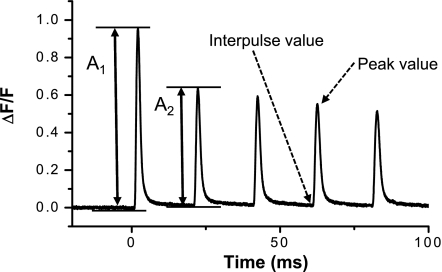
Electrical and optical data were acquired simultaneously, filtered at 5 kHz, and digitized with 16-bits resolution. The amplitude of APs and OGB-5N transients was calculated as the difference between peak and prestimulus (or interpulse) values as shown in Fig. 1. The ratio A2/A1, where A2 and A1 correspond to the amplitudes of the second and first OGB-5N transients of a train, respectively (Fig. 1), was calculated to measure the abrupt depression in Ca2+ release occurring in this particular interval. The full duration at half-maximum (FDHM) of the signals (APs and OGB-5N transients) were measured as described previously (30).
Fig. 1.
Signal parameters. Example of OGB-5N transients recorded in response to 50 Hz stimulation. Critical parameters that will be used to characterize both the electrical and the optical signals obtained in response to a train of pulses are shown. Throughout the text, the amplitude of the signals will be calculated as: (peak value − interpulse value).
For single pulse stimulation, Ca2+ release fluxes were calculated from theoretical predictions with parameters adjusted to fit experimental ΔF/F transients using a single compartment model as previously described (9, 29, 30). Here, we used the following kinetic parameters for the OGB-5N dye: kon = 0.16 μM−1·ms−1, koff = 8 ms−1, and Fmax/Fmin = 37. They provided the best prediction (data not shown) of equilibrium and kinetic dye calibrations using DM-nitrophen flash photolysis techniques (11, 19). The concentrations and properties of the main endogenous buffers were reported previously (9, 29, 30) and assumed the same for all the fiber types in this work. For repetitive stimulation, the theoretical model was modified to allow for the generation of multiple Ca2+ transients; the decay of the amplitudes of the modeled Ca2+ transients during the train was adjusted using a double-exponential function to predict the experimental data.
Unless otherwise indicated, the experimental results were expressed as means ± SD of n observations. Sets of data were compared using Student's t-test with P < 0.05.
RESULTS
Morphological characteristics of utr−/−/mdx skeletal muscle fibers.
FDB and IO muscles in utr−/−/mdx mice are smaller than those in age-matched mdx and WT mice. Despite this morphological difference, enzymatic dissociation of utr−/−/mdx muscles yields a large amount of healthy fibers. This suggests that utr−/−/mdx muscle fibers actually do not display greater fragility compared with WT and mdx counterparts. As shown in Table 1, the diameter of dissociated fibers from utr−/−/mdx FDB and IO muscles is variable; nevertheless, the fibers are shorter and thinner than those from WT and mdx muscles. Branched fibers are less abundant in utr−/−/mdx than in mdx muscle fibers but, when present, the branches were considerably smaller in diameter than those in mdx fibers (data not shown). Because of the morphological differences among fibers from the three strains, we decided to use only nonbranched fibers with similar dimensions.
Action potentials and Ca2+ signals in utr−/−/mdx fibers.
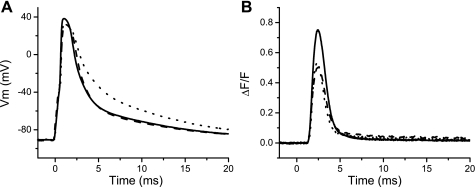
Since a goal of this work is to investigate whether knocking off the expression of utrophin in an mdx background resulted in further impairment of the EC coupling beyond what has been found in fibers from mdx mice (9, 16, 29, 30), APs and OGB-5N fluorescence transients were simultaneously recorded from WT, mdx, and utr−/−/mdx fibers (Fig. 2). It is apparent from Fig. 2A that while the durations of the APs recorded from WT (solid trace) and mdx fibers (dashed trace) are almost identical, the one from the utr−/−/mdx fiber (dotted trace) is longer. Figure 2B shows that though the OGB-5N transient recorded from the utr−/−/mdx muscle fiber is ∼32% smaller than that from a WT fiber, it is not significantly different from that recorded from the mdx fiber (∼38% smaller than WT), despite the aggravated phenotype and/or the prolongation of the AP exhibited by the utr−/−/mdx fibers.
Fig. 2.
Action potential (APs) and Oregon Green BAPTA-5N (OGB-5N) transients recorded from WT, mdx, and utr−/−/mdx fibers. A: superimposed APs recorded from WT (solid trace), mdx (dashed trace), and utr−/−/mdx (dotted trace) fibers in response to a single pulse of stimulation. AP peak (mV) and full duration at half-maximum (FDHM, in ms) were 128 and 2.46; 123 and 2.73; and 123 and 3.9 for the WT, mdx, and utr−/−/mdx fiber, respectively. B: typical OGB-5N transients elicited by single AP in WT (solid trace), mdx (dashed trace), and utr−/−/mdx (dotted trace) fibers. ΔF/F peak and FDHM (in ms) of OGB-5N transients were 0.75 and 1.68; 0.50 and 1.8; and 0.52 and 1.5; for the WT, mdx, and utr−/−/mdx fiber, respectively.
Mean values of the amplitudes and durations of APs and OGB-5N transients of pooled data recorded from WT, mdx, and utr−/−/mdx fibers are shown in Table 2. The most relevant result regarding the electrical activity in the three populations of fibers is that both the amplitudes and durations of the APs recorded from utr−/−/mdx muscle are significantly altered with respect to those of WT and mdx fibers. Namely, Table 2 shows that the AP amplitude is reduced by ∼6.5%, and the FDHM is increased by ∼46% in utr−/−/mdx fibers with respect to their WT counterparts, whereas mdx fibers did not display significant differences. It can also be observed from Table 2 that fibers from mdx and utr−/−/mdx mice display a significant reduction in the amplitude of the OGB-5N transients (∼38 and 32%, respectively) when compared with the WT ones (P < 0.001). In contrast, differences in the amplitudes of OGB-5N transients between mdx and utr−/−/mdx fibers are not significant (P > 0.3). Though individual OGB-5N transients in Fig. 2B seem to display similar durations, data in Table 2 reveal a slight prolongation in the FDHM of OGB-5N transients recorded from mdx fibers with respect to those from WT fibers (from ∼1.6 to 1.8 ms, P < 0.02); a comparable prolongation was not significant for transients from utr−/−/mdx fibers (P > 0.07). In agreement with previous reports, the peak Ca2+ release flux calculated from OGB-5N transients of mdx fibers (150.3 ± 32.1 μM/ms) was significantly smaller than that of their WT counterparts (242.4 ± 58.4 μM/ms). Utr−/−/mdx fibers also showed a depressed Ca2+ release flux, calculated to be 165.7 ± 47.3 μM/ms, which is ∼32% smaller than that in WT fibers.
Table 2.
Amplitude and duration of APs and OGB-5N transients from control, mdx, and utr−/−/mdx fibers
| AP |
ΔF/F |
|||||
|---|---|---|---|---|---|---|
| Mice Strain | n | Amplitude, mV | FDHM, ms | Amplitude | FDHM, ms | Peak Ca2+ Release Flux, μM/ms |
| WT | 15 | 124.8 ± 7.1 | 2.17 ± 0.48 | 0.79 ± 0.19 | 1.57 ± 0.18 | 242.4 ± 58.4 |
| mdx | 11 | 122.6 ± 9.7 | 2.48 ± 0.68 | 0.49 ± 0.10* | 1.80 ± 0.30* | 150.3 ± 32.1* |
| utr−/−/mdx | 14 | 116.7 ± 9.5* | 3.15 ± 1.25* | 0.54 ± 0.15* | 1.74 ± 0.29 | 165.7 ± 47.3* |
Values are means ± SD; n is the number of mice. APs, action potentials; FDHM, full duration at half-maximum amplitude; OGB-5N, Oregon Green 488 BAPTA-5N.1
P < 0.05 ANOVA unpaired t-test comparison with WT values.
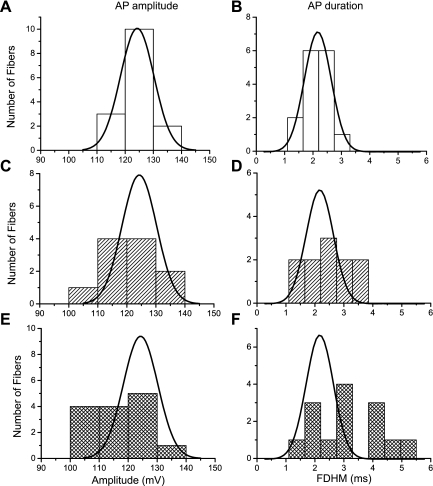
A detailed statistical analysis of the distribution of amplitudes and durations of the APs in fibers from the three mice strains was performed to uncover possible sources of variability in the data contained in Table 2. Figure 3 shows frequency histograms of the amplitudes (Fig. 3, A, C, and E) and durations (Fig. 3, B, D, and F) of the APs recorded from WT (open bars), mdx (hatched bars), and utr−/−/mdx (double-hatched bars) fibers. The histogram in Fig. 3A shows that the AP amplitudes recorded from WT fibers fall within a normal distribution curve centered at 124.8 mV with a width of 14.2 mV (2×SD). This curve is also shown superimposed with the corresponding data from mdx (Fig. 3C) and utr−/−/mdx (Fig. 3E). It can be seen that most of the AP amplitudes measured from mdx fibers are enclosed within the same normal distribution of the WT mice, demonstrating that the amplitudes of APs in these two populations of fibers are not significantly different from each other. AP amplitudes in utr−/−/mdx mice, on the other hand, are weighed toward smaller values; ∼73% of utr−/−/mdx fibers display AP amplitudes that fall within the normal distribution of AP amplitudes from WT fibers, but the remaining ∼27% of the fibers have AP amplitudes smaller than those from WT fibers (Table 3).
Fig. 3.
Frequency histograms of the amplitude and duration of APs recorded from the three mice strains. Histograms of the amplitude and duration of APs recorded (in response to a single pulse) from WT (A and B), mdx (C and D), and utr−/−/mdx fibers (E and F). The same binning was used for each parameter. The normal distribution curves for the amplitude and duration data from WT mice (solid lines) are shown superimposed on top of the mdx and utr−/−/mdx histograms; they were scaled according to the total number of fibers in each population.
Table 3.
AP and OGB-5N transient characterization from groups 1 and 2 of mdx and utr−/−/mdx fibers
| AP |
ΔF/F |
|||||
|---|---|---|---|---|---|---|
| Fiber Type | n | Peak Value, mV | FDHM, ms | Peak Value | FDHM, ms | Peak Ca2+ Release Flux, μM/ms |
| WT | 15 | 124.80 ± 7.06 | 2.17 ± 0.48 | 0.79 ± 0.19 | 1.57 ± 0.18 | 242.4 ± 58.4 |
| mdx-1 | 8/11 | 124.56 ± 10.13 | 2.18 ± 0.54 | 0.50 ± 0.12* | 1.71 ± 0.29 | 152.2 ± 36.7* |
| mdx-2 | 3/11 | 117.36 ± 7.41 | 3.26 ± 0.15* | 0.48 ± 0.06* | 2.04 ± 0.19* | 145.2 ± 19.6* |
| utr−/−/mdx-1 | 9/14 | 119.90 ± 9.03 | 2.35 ± 0.61 | 0.56 ± 0.17* | 1.65 ± 0.29 | 183.8 ± 50.0* |
| utr−/−/mdx-2 | 5/14 | 111.01 ± 7.96* | 4.58 ± 0.61* | 0.50 ± 0.12* | 1.97 ± 0.14* | 144.6 ± 37.2* |
Values are means ± SD; n is number of mice.
P < 0.05 ANOVA unpaired t-test comparison with WT values.
As shown in Fig. 3B, the distribution of the FDHM of APs from WT fibers is described by a Gaussian distribution centered at 2.17 ms with a width of 0.96 ms. Those from mdx fibers (Fig. 3D), though more widely distributed and shifted toward slightly longer values, are still within the range of the normal distribution from WT fibers. In contrast, ∼36% of the APs recorded from utr−/−/mdx fibers exhibit FDHM values that are significantly longer than those from WT fibers (Fig. 3F and see Table 3).
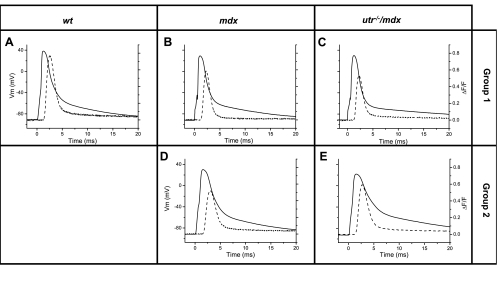
The distributions of AP amplitudes and FDHMs shown in Fig. 3 suggests that fibers from mdx and utr−/−/mdx muscles constitute functionally heterogeneous populations, when compared with those from WT muscles. To further investigate the EC coupling properties of these populations of fibers, we defined two groups using the FDHM of their APs as a criterion: group 1 (for both mdx and utr−/−/mdx mice) included fibers with APs FDHMs within 95% (average ± 2×SD) of those in WT fibers, and group 2 included fibers displaying values significantly longer. As shown in Table 3, 73% of the fibers from mdx mice belong to group 1 (mdx-1), whereas only ∼64% of fibers from utr−/−/mdx mice belong to this group (utr−/−/mdx-1). The APs recorded from mdx-1 fibers (Fig. 4B) and utr−/−/mdx-1 (Fig. 4C) are not significantly different in amplitude and duration from those recorded from WT fibers (Fig. 4A); in contrast, APs from mdx-2 (Fig. 4D) and utr−/−/mdx-2 (Figs. 4E) fibers are smaller and considerably longer than those from control fibers (see also Table 3). Notably, Fig. 4 and Table 3 show that the amplitude of OGB-5N transients from mdx and utr−/−/mdx fibers are similarly impaired with respect to those from WT fibers (29–40% reduction in amplitude) regardless of the disparity in the AP parameters for each group of fibers. However, the FDHM of OGB-5N transients in mdx-2 and utr−/−/mdx-2 fibers are significantly longer than those from WT and group 1 fibers.
Fig. 4.
APs and OGB-5N transients recorded from WT and pregrouped mdx and utr−/−/mdx fibers. A–E: superimposed electric (solid lines) and OGB-5N (dashed lines) signals responses in response to single stimulation recorded from a WT (A), a mdx-1 (B), a mdx-2 (D), an utr−/−/mdx-1 (C), and an utr−/−/mdx-2 (E) fiber. AP peak, AP FDHM, ΔF/F peak, ΔF/F FDHM values for each of these experiments were 128 mV, 2.46 ms, 0.75, 1.83 ms (WT); 119 mV, 2.07 ms, 0.59, 1.44 ms (mdx-1); 120 mV, 3.33 ms, 0.52, 2.1 ms (mdx-2); 120 mV, 1.95 ms, 0.52, 1.5 ms (utr−/−/mdx-1); 112 mV, 4.26 ms, 0.60, 2.07 ms (utr−/−/mdx-2).
APs and Ca2+ transients elicited by high-frequency stimulation in mdx and utr−/−/mdx fibers.
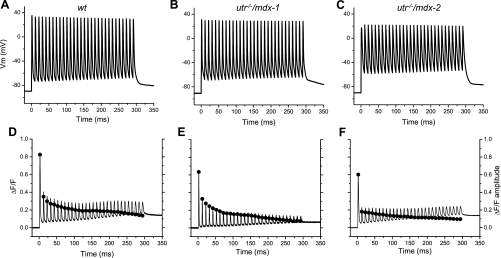
The CNS controls mechanical output during voluntary movement by recruiting various numbers of motor units and/or by activating the muscle fibers with multiple patterns of stimulation, which in mammals can reach frequencies exceeding 100 Hz (14). Thus it seemed relevant to investigate how is the Ca2+ release impairment manifested in both utr−/−/mdx and mdx fibers when they are stimulated with patterns that emulate the in vivo situation. We first studied the electrical activity and Ca2+ release in response to trains of 30 pulses applied at 100 Hz; as can be seen (Fig. 5A), APs with almost constant peak values (approximately +35 mV) are recorded from control fibers. Furthermore, membrane potential values at the interpulse repolarizations are maintained at a slightly depolarized level of approximately −70 mV throughout the train (Fig. 5A). For the same fiber, OGB-5N transients elicited by the train of APs are shown in Fig. 5D; unlike the APs, the peak values of the OGB-5N transients decay significantly along the train and the ΔF/F values between consecutive transients (interpulse ΔF/F) along the train increases, altogether making the amplitude of the OGB-5N transients (solid circles, Fig. 5D) to decay drastically during the train. Interestingly, the largest drop in amplitude of the OGB-5N transients is seen between the first and second pulse of the train, yielding an estimated A2/A1 ratio of ∼0.5.
Fig. 5.
APs and OGB-5N transients elicited by a train of high-frequency pulses. APs (solid traces, A–C) and corresponding OGB-5N (solid traces in D–F) elicited by trains of 30 pulses applied at 100 Hz. Data from WT, utr−/−/mdx-1, and utr−/−/mdx-2 fibers are shown in A and D, B and E, and C and F, respectively. Filled circles in D–F represent the amplitude of OGB-5N transients.
When the same pattern of stimulation was applied to fibers from utr−/−/mdx mice, two paradigms of electrical and optical responses were recorded. The APs of utr−/−/mdx-1 fibers (Fig. 5B) followed a pattern comparable to that observed in WT fibers. The only appreciable difference is that the interpulse membrane potential (approximately −65 mV) is slightly more positive than that typically observed in WT fibers. Furthermore, other than the fact that OGB-5N transients are significantly smaller than those recorded from WT fibers (as described previously for single AP stimulation), in utr−/−/mdx-1 fibers the A2/A1 ratio (∼0.5) and the subsequent decay of the amplitude of the Ca2+ transients are similar to those seen in WT fibers as can be appreciated by comparing the solid circles in Fig. 5, D and E. In contrast, utr−/−/mdx-2 fibers (Fig. 5, C and F) demonstrate smaller AP amplitudes and more depolarized interpulse membrane potentials (approximately −55 mV) along the train, in a pattern that is unlike that observed in WT and utr−/−/mdx-1 fibers. In addition, Ca2+ transients from utr−/−/mdx-2 fibers display a significantly smaller A2/A1 ratio (∼0.3), which is contrasted by a relatively smaller decay in the amplitude of the transients thereafter, until it reaches a value of ∼17% that of the first transient at the end of the train (solid circles in Fig. 5F).
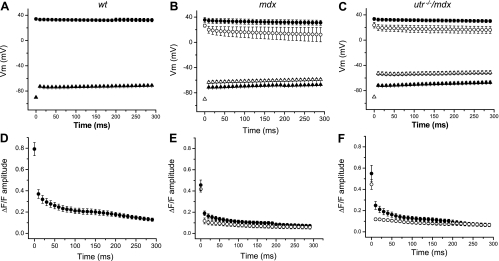
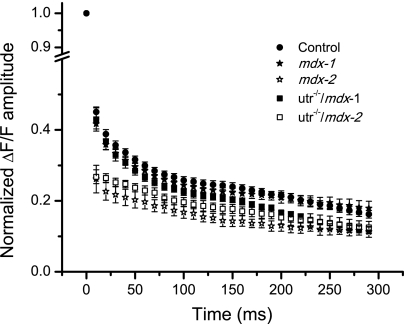
Figure 6 display the time dependence of average data, measured in response to 100-Hz stimulation, from WT (n = 11), mdx-1 (n = 9), mdx-2 (n = 3), utr−/−/mdx-1 (n = 5), and utr−/−/mdx-2 (n = 6) fibers. It can be observed that the properties of the APs and Ca2+ transients during the train were highly conserved among WT fibers (Fig. 6, A and D). For them, the A2/A1 value was 0.45 ± 0.05; thereafter, the amplitude of the OGB-5N transients decays until it reaches steady values of ∼15% that of the first transient at the end of the train (Fig. 6D). This secondary decay process was fitted to a single exponential function with a decay time constant (τ) of 176 ± 79 ms (n = 11). Conversely, pooled data from single and double mutant mice (mdx and utr−/−/mdx) illustrate that the two different patterns of electrical and optical responses described in Fig. 5 for individual utr−/−/mdx fibers are preserved in the overall fiber populations. Namely, electrical responses from group 1 fibers from both mdx and utr−/−/mdx (solid symbols, Fig. 6, B and C) are similar between them and with those recorded in WT fibers (Fig. 6A). OGB-5N transients of group 1 fibers display values of A2/A1 (0.42 ± 0.05 for mdx-1, 0.43 ± 0.08 for utr−/−/mdx-1), and decay time constant (τ = 119 ± 41 ms for mdx-1, τ = 174 ± 83 ms for utr−/−/mdx-1), which are comparable to those in WT fibers. In contrast, the features of the APs elicited in group 2 fibers by 100-Hz stimulation (empty symbols, Fig. 6, B and C) are significantly different to those of APs from WT fibers. It can be seen that mdx-2 fibers show the larger differences in peak AP, whereas utr−/−/mdx-2 fibers show the more depolarized interpulse potential (compare AP peaks and interpulse potentials in Fig. 6, B and C). Also, OGB-5N transients from mdx-2 and utr−/−/mdx-2 fibers display smaller A2/A1 values (0.26 ± 0.07 and 0.27 ± 0.05, respectively) and shorter time constants at the subsequent decay (103 ± 69 ms, 103 ± 53 ms, respectively), with respect to group 1 and WT fibers (Fig. 6, D–F). To facilitate a more in-depth comparison of the process of decay in the amplitude of OGB-5N transients during the train of APs in fibers from WT, mdx, and utr−/−/mdx mice, the data from Fig. 6, D–F, were normalized and superimposed in Fig. 7. It can be observed that during the first ∼50 ms of the tetanic stimulation, the decay in both mdx-1 and utr−/−/mdx-1 fibers is comparable to that observed in WT fibers but significantly different from those in mdx-2 and utr−/−/mdx-2 fibers. Interestingly, after ∼100 ms, whereas the amplitudes of the transients in mdx-1 fibers decay similarly to WT fibers, those in utr−/−/mdx-1 fibers decay abruptly to reach values comparable to those of both mdx-2 and utr−/−/mdx-2 fibers.
Fig. 6.
Peak and interpulse values of APs and OGB-5N transients during high-frequency stimulation. A–C: pooled data of the mean peak values (circles) and interpulse potentials (triangles) of APs recorded in response to 100-Hz stimulation from WT (n = 8); mdx-1 (closed symbols, n = 8), and mdx-2 (open symbols, n = 3); and utr−/−/mdx-1 (closed symbols, n = 3) and utr−/−/mdx-2 (open symbols, n = 3). D–F corresponding mean amplitude values of pooled data (circles) of OGB-5N transient recorded in correspondence to data in A–C respectively. Symbols represent means ± SE.
Fig. 7.
Normalized amplitudes of OGB-5N transients in WT, mdx, and utr−/−/mdx during high-frequency trains. Superimposed pooled data of the normalized amplitudes of OGB-5N transients recorded in response to 100-Hz stimulation from WT (filled circles), mdx-1 (filled stars), mdx-2 (open stars), utr−/−/mdx-1 (filled squares), and utr−/−/mdx-2 (open squares) fibers.
Rate of Ca2+ release during high-frequency trains.
To assess the impact that the lack of both dystrophin and utrophin had on the Ca2+ release mechanisms of adult mammalian muscle fibers, we compared the Ca2+ release fluxes underlying OGB-5N transients recorded from WT and utr−/−/mdx fibers. Representative results, shown in Fig. 8, A–C, were calculated from the data in Fig. 5, D–F, respectively. For a typical WT fiber (Fig. 8A), the peak Ca2+ release for the first transient of the train was ∼230 μM/ms. This value falls to ∼109 μM/ms at the second transient, and decays progressively thereafter reaching ∼35 μM/ms at the end of the train (Fig. 8A). As shown in Table 3, the Ca2+ release flux calculated in response to a single stimulus, or the first stimulus of a train, is always significantly smaller for fibers from mutant mice than for WT fibers. A value of ∼175 μM/ms was calculated for the utr−/−/mdx-1 and utr−/−/mdx-2 fibers shown in Fig. 8, B and C, which is ∼24% smaller than those from WT mice. It should be noted that group 1 displayed a drop in peak Ca2+ release to approximately ∼100 μM/ms in the second transient and ∼31 μM/ms at the end of the train. In contrast, group 2 fibers displayed an abrupt depression in the Ca2+ release to ∼49 μM/ms at the second transient and reached ∼19 μM/ms at the end of the train.
Fig. 8.
Ca2+ release fluxes and total [Ca] changes calculated from transients at 100 Hz stimulation. A–C: Ca2+ release fluxes used to simulate the OGB-5N transients from WT, utr−/−/mdx-1, and utr−/−/mdx-2 fibers as shown in Fig. 5, D–F, respectively.
APs and Ca2+ transients in fibers stimulated at 50 Hz.
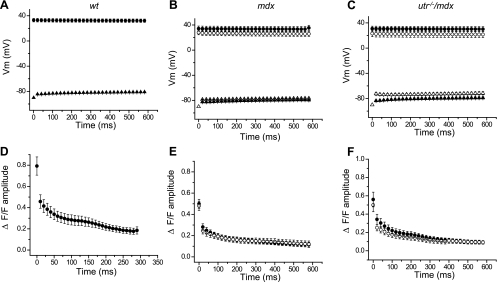
It could be reasoned that the electrical responses and OGB-5N transients recorded from group 2 fibers (from both mdx and utr−/−/mdx mice) in response to trains of repetitive stimulation would be less impacted by the prolongation of individual APs if the frequency of stimulation is reduced. To verify if this is the case, fibers from the three mice strains were stimulated with trains of 30 pulses at 50 Hz. Interestingly, unlike what was shown for 100 Hz (Fig. 6), at 50 Hz, the peak and interpulse values of APs (Fig. 9, B–C) and the amplitudes of OGB-5N transients (Fig. 9, E–F) recorded from groups 1 and 2 fibers became more similar to each other. In fact, for mdx mice, the differences in the features of APs and OGB-5N transients recorded from the mdx-1 and mdx-2 fibers become negligible. For utr−/−/mdx mice, the difference in the amplitude of the OGB-5N transients (Fig. 9F) between groups 1 and 2 fibers is smaller than that seen at 100 Hz but still significant for the first 60 ms of the train (P < 0.05). In addition, the A1/A2 ratios of OGN-5N transients recorded from fibers belonging to the five fibers’ populations [0.57 ± 0.04 (n = 11), 0.56 ± 0.04 (n = 9), 0.50 ± 0.04 (n = 3), 0.61 ± 0.04 (n = 5), and 0.50 ± 0.03 (n = 5) for WT, mdx-1, mdx-2, utr−/−/mdx-1, and utr−/−/mdx-2 fibers, respectively] are quite similar when using 50 Hz stimulation.
Fig. 9.
Peak and interpulse values of APs and OGB-5N transients during 50 Hz stimulation. A–C: pooled data of the mean peak values (circles) and interpulse potentials (triangles) of APs recorded in response to 50-Hz stimulation from WT (closed symbols, n = 6); mdx-1 (closed symbols, n = 8) and mdx-2 (open symbols, n = 3); and utr−/−/mdx-1 (closed symbols, n = 5) and utr−/−/mdx-2 (open symbols, n = 3). D–F shows the corresponding mean amplitude values of pooled data of OGB-5N transient recorded in correspondence to data in A–C respectively. Symbols represent means ± SE.
DISCUSSION
Until now, studies comparing the mechanisms of excitability and EC coupling in fibers from utr−/−/mdx mice, with respect to those of WT and mdx animals, have been lacking. The present work was aimed to fill this void by comparatively studying the three mice strains. We found that FDB muscles from either mdx or utr−/−/mdx mice display heterogeneous populations of fibers, which could be divided in two groups based on the properties of the electrical responses to single pulses and repetitive stimulation. The APs amplitude and FDHM in group 1 fibers were found to be similar to those from WT fibers (Fig. 4, Table 3). Group 2 fibers, on the other hand, display smaller and longer-lasting APs than those recorded in WT and group 1 fibers (Fig. 4, Table 3). Nonetheless, these differences were more noticeable in fibers from utr−/−/mdx mice (Fig. 4, Table 3).
The exact mechanisms underlying the reduction in amplitude and the prolongation of the APs recorded from group 2 fibers are unknown, but they could stem from alterations in the expression, targeting, and/or functional properties of the Nav1.4 channel eventually related to variability in the expression of syntrophins and/or other regulatory proteins in dystrophic fibers (15, 21, 24). In this regard, the proposal by Riboux et al. (24) that an unbalance in the expression of syntrophins may lead to functional deficits in NaV1.4 channels in mdx fibers could provide an explanation for the limitations seen in the mdx-2 fibers. Unfortunately, there are no reports about the expression of syntrophins in utr−/−/mdx mice, but it seems feasible that a more profound disarrangement of these proteins associated with the absence of both dystrophin and utrophin may lead to more severe dysregulation of NaV1.4, thus explaining the smaller and longer APs recorded from utr−/−/mdx-2 fibers. The question that remains though, is why the electrical responses from group 1 fibers from both mdx and utr−/−/mdx mice are spared from these deficits? New experiments using voltage-clamp conditions and potentiometric dyes to evaluate the NaV1.4 channel properties (amplitude, kinetics, and voltage dependence of the sodium currents) and estimate the channel density at the surface and TTS membranes (26), in parallel with the use of immunohystochemical analysis to test for syntrophins’ expression and location, will be necessary to unveil these important mechanistic issues.
In contrast to what we found regarding APs, we observed that the reduction in Ca2+ release elicited by single pulse stimulations is similar for both mdx and utr−/−/mdx mice, regardless of the fiber group (group 1 or 2; see Table 3). Although the exact mechanisms leading to the Ca2+ release impairment observed in both mouse strains remain to be determined, our laboratory has already demonstrated in mdx fibers that alterations in the AP conduction in the TTS, in the voltage dependence of the transduction process at the triads, and in the SR Ca2+ content, do not seem to be critical causes (9, 27, 29, 30). Consequently, we speculate that in fibers from mdx mice, the Ca2+ release limitation is probably confined to the altered expression or physiological dysregulation of the RyR1 Ca2+ release channel (29). From the similarity of results presented here for mdx and utr−/−/mdx fibers, it seems possible to suggest that the Ca2+ release impairments may have a common root for both strains of mice. However, more extensive experiments, similar to those already done in mdx fibers (9, 27, 29, 30), will be necessary to ultimately verify this hypothesis.
Total [Ca2+] changes calculated from single pulse transients in WT, mdx, and utr−/−/mdx fibers were (in μM): 341 ± 79 (n = 15), 238 ± 40 (n = 11), and 261 ± 71 (n = 14), respectively; thus, mutant fibers release ∼70% the total Ca2+ per AP compared with normal fibers. These values, and that of the peak Ca2+ release flux in WT fibers (242 ± 58 μM/ms) are in close agreement with those calculated by other authors for EDL muscle fibers (346 ± 6 μM and 212 ± 4 μM/ms, respectively; means ± SE, 16°C) using a similar single compartment model (3). This coincidence of results for WT fibers not only reinforces the validity of calculations made from data obtained under different experimental conditions, but it also suggests that the reduction in peak Ca2+ fluxes (and total [Ca2+] changes) reported here for mdx and utr−/−/mdx fibers are not accounted for by the abnormal upregulation of genes encoding proteins typical of slow muscles (2, 23) since slow-twitch fibers show significantly smaller values for both calculations (70 μM/ms and 127 μM; Ref. 3). Our results are in general agreement with reports suggesting that the specific twitch force in fast muscles (EDL) from mdx and utr−/−/mdx mice is comparable but smaller than that in WT muscles (7). An important conclusion from the above observations is that the Ca2+ release impairment observed with single pulse stimulation in mdx fibers is not significantly ameliorated by the overexpression of utrophin. This unanticipated result is apparently inconsistent with the claimed role that utrophin is an equivalent functional substitute of dystrophin in muscles from mdx mice (6, 7, 12, 22). However, as discussed below, the presence of utrophin seems to improve the ability of mdx-1 fibers to sustain Ca2+ release during longer periods of 100-Hz tetanic stimulation.
Regarding mdx fibers, the data presented in this paper using 30 mM EGTA are in good agreement with previous results from our laboratory using different ethylene glycol-bis(β-aminoethyl ether)-N,N,N′,N′-tetraacetic acids but otherwise similar experimental conditions (30). We found here that mdx fibers display 38% depression of both OGB-5N transients and peak Ca2+ flux, which are comparable to the 43% and 45% depression for the same respective parameters obtained previously using 5 mM ethylene glycol-bis(β-aminoethyl ether)-N,N,N′,N′-tetraacetic acid (30). Nonetheless, our data are at odds with those recently obtained from intact EDL fibers from mdx mice (16); these authors report a smaller depression (∼26%) of the peak Ca2+ flux. Whereas this discrepancy is intriguing, it may stem from differences in the methodology used to record Ca2+ signals.
Since discharge frequencies up to 100 Hz have been measured in motoneurons from ambulant rodents (14), we measured the electrical activity and calcium release elicited by this frequency. Experiments using this frequency of stimulation revealed that fibers from WT animals showed a very uniform pattern of electrical and optical responses. In contrast, fibers from utr−/−/mdx mice, and to a lesser extent those from mdx mice, exhibited heterogeneous patterns of responses. In general, group 1 fibers behaved similarly to WT fibers (Fig. 7, solid symbols) with the exception of utr−/−/mdx-1 fibers in which the Ca2+ transients show an abrupt decay toward values similar to those of group 2 fibers after ∼60 ms. We propose that the limitation in the ability to sustain Ca2+ release during a high-frequency tetanus, which is not observed in mdx-1 fibers, is linked to the lack of expression of utrophin in these fibers; this argues for a role of this protein on the preservation of EC coupling mechanisms during repetitive stimulation as they may occur in vivo.
Group 2 fibers, on the other hand, displayed Ca2+ responses with highly reduced A2/A1 ratio and depressed amplitudes during the first 50 ms of the train. It seems reasonable to hypothesize that the abrupt limitation in amplitude of the Ca2+ transients during the 100-Hz trains observed in group 2 fibers may be linked to the reduced amplitude and increased duration of the APs (already suggested to emerge from the absence of dystrophin and/or utrophin in these fibers). In support of these ideas, differences in the pattern of Ca2+ release during trains of 30 pulses between group 1 and group 2 mutant fibers became almost unnoticeable at 50 Hz (Fig. 9) or lower frequencies of stimulation (data not shown). Though the actual cause(s) for the prolongation of the APs in group 2 fibers is (are) unknown yet, our results suggests that this alteration may lead to an increased limitation of Ca2+ release at high frequencies of stimulation. Interestingly, our data showing that the proportion of group 2 fibers is significantly larger in utr−/−/mdx than in mdx muscles (Table 3), coupled with these fibers' severe limitations at high-frequency stimulations (Figs. 6 and 8), are in good agreement with data showing that the depression of tetanic tension is more marked for utr−/−/mdx than mdx muscles during 300 ms, 125-Hz trains (7).
In summary, fibers from utr−/−/mdx mice seem to display more pervasive alterations in the EC coupling than those observed in the mdx model; these limitations would have been unnoticed by not using high-frequency stimulation but are quite relevant to the functional performance of the muscle fibers under CNS control.
GRANTS
This work was supported by National Institutes of Health grants AR-047664 and AR-054816 (NIAMS) and GM-074706 (NIGMS).
DISCLOSURES
No conflicts of interest are declared by the author(s).
ACKNOWLEDGMENTS
The authors are indebted with Dr. J. R. Sanes (Washington University, St. Louis, MO) and Dr. M. Spencer (UCLA) for sharing DKO specimens that allowed us to establish a colony in our laboratory. We also thank Marbella Quinonez for helpful discussions.
REFERENCES
- 1.Amalfitano A, Chamberlain JS. The mdx-amplification-resistant mutation system assay, a simple and rapid polymerase chain reaction-based detection of the mdx allele. Muscle Nerve 19: 1549–1553, 1996 [DOI] [PubMed] [Google Scholar]
- 2.Baker PE, Kearney JA, Gong B, Merriam AP, Kuhn DE, Porter JD, Rafael-Fortney JA. Analysis of gene expression differences between utrophin/dystrophin-deficient vs. mdx skeletal muscles reveals a specific upregulation of slow muscle genes in limb muscles. Neurogenetics 7: 81–91, 2006 [DOI] [PubMed] [Google Scholar]
- 3.Baylor SM, Hollingworth S. Sarcoplasmic reticulum calcium release compared in slow-twitch and fast-twitch fibres of mouse muscle. J Physiol 551: 125–138, 2003 [DOI] [PMC free article] [PubMed] [Google Scholar]
- 4.Capote JC, DiFranco M, Vergara JL. The absence of utrophin does not further the impairment of Ca2+ release displayed by mdx muscle. Biophys J 96: 236a–236a, 2009 [Google Scholar]
- 5.Collins CA, Morgan JE. Duchenne's muscular dystrophy: animal models used to investigate pathogenesis and develop therapeutic strategies. Int J Exp Pathol 84: 165–172, 2003 [DOI] [PMC free article] [PubMed] [Google Scholar]
- 6.Deconinck AE, Rafael JA, Skinner JA, Brown SC, Potter AC, Metzinger L, Watt DJ, Dickson JG, Tinsley JM, Davies KE. Utrophin-dystrophin-deficient mice as a model for Duchenne muscular dystrophy. Cell 90: 717–727, 1997 [DOI] [PubMed] [Google Scholar]
- 7.Deconinck N, Rafael JA, Beckers-Bleukx G, Kahn D, Deconinck AE, Davies KE, Gillis JM. Consequences of the combined deficiency in dystrophin and utrophin on the mechanical properties and myosin composition of some limb and respiratory muscles of the mouse. Neuromuscul Disord 8: 362–370, 1998 [DOI] [PubMed] [Google Scholar]
- 8.DiFranco M, Capote J, Vergara JL. Optical imaging and functional characterization of the transverse tubular system of mammalian muscle fibers using the potentiometric indicator di-8-ANEPPS. J Membr Biol 208: 141–153, 2005 [DOI] [PubMed] [Google Scholar]
- 9.DiFranco M, Woods CE, Capote J, Vergara JL. Dystrophic skeletal muscle fibers display alterations at the level of calcium microdomains. Proc Natl Acad Sci USA 105: 14698–14703, 2008 [DOI] [PMC free article] [PubMed] [Google Scholar]
- 10.Emery AE. The muscular dystrophies. Lancet 359: 687–695, 2002 [DOI] [PubMed] [Google Scholar]
- 11.Escobar AL, Velez P, Kim AM, Cifuentes F, Fill M, Vergara JL. Kinetic properties of DM-nitrophen and calcium indicators: rapid transient response to flash photolysis. Pflügers Arch 434: 615–631, 1997 [DOI] [PubMed] [Google Scholar]
- 12.Grady RM, Merlie JP, Sanes JR. Subtle neuromuscular defects in utrophin-deficient mice. J Cell Biol 136: 871–882, 1997 [DOI] [PMC free article] [PubMed] [Google Scholar]
- 13.Grady RM, Teng H, Nichol MC, Cunningham JC, Wilkinson RS, Sanes JR. Skeletal and cardiac myopathies in mice lacking utrophin and dystrophin: a model for Duchenne muscular dystrophy. Cell 90: 729–738, 1997 [DOI] [PubMed] [Google Scholar]
- 14.Hennig R, Lomo T. Firing patterns of motor units in normal rats. Nature 314: 164–166, 1985 [DOI] [PubMed] [Google Scholar]
- 15.Hirn C, Shapovalov G, Petermann O, Roulet E, Ruegg Nav1 UT. 4. Deregulation in dystrophic skeletal muscle leads to Na+ overload and enhanced cell death. J Gen Physiol 132: 199–208, 2008 [DOI] [PMC free article] [PubMed] [Google Scholar]
- 16.Hollingworth S, Zeiger U, Baylor SM. Comparison of the myoplasmic calcium transient elicited by an action potential in intact fibres of mdx and normal mice. J Physiol 586: 5063–5075, 2008 [DOI] [PMC free article] [PubMed] [Google Scholar]
- 17.Keep NH. Structural comparison of actin binding in utrophin and dystrophin. Neurol Sci 21: S929–S937, 2000 [DOI] [PubMed] [Google Scholar]
- 18.Khurana TS, Davies KE. Pharmacological strategies for muscular dystrophy. Nat Rev Drug Discov 2: 379–390, 2003 [DOI] [PubMed] [Google Scholar]
- 19.Nagerl UV, Novo D, Mody I, Vergara JL. Binding kinetics of calbindin-D(28k) determined by flash photolysis of caged Ca(2+). Biophys J 79: 3009–3018, 2000 [DOI] [PMC free article] [PubMed] [Google Scholar]
- 20.O'Brien KF, Kunkel LM. Dystrophin and muscular dystrophy: past, present, and future. Mol Genet Metab 74: 75–88, 2001 [DOI] [PubMed] [Google Scholar]
- 21.Peters MF, Adams ME, Froehner SC. Differential association of syntrophin pairs with the dystrophin complex. J Cell Biol 138: 81–93, 1997 [DOI] [PMC free article] [PubMed] [Google Scholar]
- 22.Rafael JA, Tinsley JM, Potter AC, Deconinck AE, Davies KE. Skeletal muscle-specific expression of a utrophin transgene rescues utrophin-dystrophin deficient mice. Nat Genet 19: 79–82, 1998 [DOI] [PubMed] [Google Scholar]
- 23.Rafael JA, Townsend ER, Squire SE, Potter AC, Chamberlain JS, Davies KE. Dystrophin and utrophin influence fiber type composition and post-synaptic membrane structure. Hum Mol Genet 9: 1357–1367, 2000 [DOI] [PubMed] [Google Scholar]
- 24.Ribaux P, Bleicher F, Couble ML, Amsellem J, Cohen SA, Berthier C, Blaineau S. Voltage-gated sodium channel (SkM1) content in dystrophin-deficient muscle. Pflügers Arch 441: 746–755, 2001 [DOI] [PubMed] [Google Scholar]
- 25.van Deutekom JC, van Ommen GJ. Advances in Duchenne muscular dystrophy gene therapy. Nat Rev Genet 4: 774–783, 2003 [DOI] [PubMed] [Google Scholar]
- 26.Vergara JL, Capote J, DiFranco M. Characterization of the Na and K delayed rectifier conductances of mammalian skeletal muscle fibers’ transverse tubular system using the potentiometric indicator di-8-ANEPPS. Biophys J 92: 22a, 2007 [Google Scholar]
- 27.Vergara JL, DiFranco M. Sarcoplasmic reticulum calcium content in normal and dystrophic mammalian skeletal muscle fibers. Biophys J 96: 235a–236a, 2009 [Google Scholar]
- 28.Watchko JF, O'Day TL, Hoffman EP. Functional characteristics of dystrophic skeletal muscle: insights from animal models. J Appl Physiol 93: 407–417, 2002 [DOI] [PubMed] [Google Scholar]
- 29.Woods CE, Novo D, DiFranco M, Capote J, Vergara JL. Propagation in the transverse tubular system and voltage dependence of calcium release in normal and mdx mouse muscle fibres. J Physiol 568: 867–880, 2005 [DOI] [PMC free article] [PubMed] [Google Scholar]
- 30.Woods CE, Novo D, DiFranco M, Vergara JL. The action potential-evoked sarcoplasmic reticulum calcium release is impaired in mdx mouse muscle fibres. J Physiol 557: 59–75, 2004 [DOI] [PMC free article] [PubMed] [Google Scholar]


