Abstract
Exercise training normalizes enhanced glutamatergic mechanisms within the paraventricular nucleus (PVN) concomitant with the normalization of increased plasma ANG II levels in rats with heart failure (HF). We tested whether ANG II type 1 (AT1) receptors are involved in the normalization of PVN glutamatergic mechanisms using chronic AT1 receptor blockade with losartan (Los; 50 mg·kg−1·day−1 in drinking water for 3 wk). Left ventricular end-diastolic pressure was increased in both HF + vehicle (Veh) and HF + Los groups compared with sham-operated animals (Sham group), although it was significantly attenuated in the HF + Los group compared with the HF + Veh group. The effect of Los on cardiac function was similar to exercise training. At the highest dose of N-methyl-d-aspartate (NMDA; 200 pmol) injected into the PVN, the increase in renal sympathetic nerve activity was 93 ± 13% in the HF + Veh group, which was significantly higher (P < 0.05) than the increase in the Sham + Veh (45 ± 2%) and HF + Los (47 ± 2%) groups. Relative NMDA receptor subunit NR1 mRNA expression within the PVN was increased 120% in the HF + Veh group compared with the Sham + Veh group (P < 0.05) but was significantly attenuated in the HF + Los group compared with the HF + Veh group (P < 0.05). NR1 protein expression increased 87% in the HF + Veh group compared with the Sham + Veh group but was significantly attenuated in the HF + Los group compared with the HF + Veh group (P < 0.05). Furthermore, in in vitro experiments using neuronal NG-108 cells, we found that ANG II treatment stimulated NR1 protein expression and that Los significantly ameliorated the NR1 expression induced by ANG II. These data are consistent with our hypothesis that chronic AT1 receptor blockade normalizes glutamatergic mechanisms within the PVN in rats with HF.
Keywords: paraventricular nucleus, N-methyl-d-aspartate receptor, angiotensin type 1 receptor, sympathetic nerve activity
increased activation of the sympathetic nervous system is associated with heart failure (HF) (46). This increased sympathoexcitation is due, in part, to increased glutamatergic mechanisms within the paraventricular nucleus (PVN) of the hypothalamus (16). Specifically, the increase in renal sympathetic nerve activity (RSNA) in response to N-methyl-d-aspartate (NMDA) microinjected into the PVN is higher in rats with HF than in sham-operated rats (16). Additionally, expression of a subunit of the NMDA receptor, NR1, is increased within the PVN in rats with HF (16). We (15) have recently shown that exercise training normalizes the increased RSNA response to NMDA microinjected into the PVN as well as the increased NR1 expression within the PVN.
A functional NMDA receptor comprises the NR1 subunit and at least one NR2 subunit (8, 37). We (12) have also previously measured the protein expression of an NR2 subunit that is abundant in the PVN (NR2B). These previous data indicated that HF does not alter the expression of NR2B within the PVN and that exercise training also does not alter NR2B in the PVN. This suggests that changes in NMDA subunit expression, with implications for NMDA receptor function, may be limited to NR1. It is possible, however, that expression of at least one other NR subunit (NR2A, NR2C, NR2D, NR3A, or NR3B) may be altered by HF and/or exercise training, which remains to be examined.
The mechanism(s) by which exercise training normalizes PVN glutamatergic mechanisms is not clear. We (15, 19) have observed that exercise training attenuated the elevated plasma ANG II levels associated with HF. An intravenous infusion of ANG II increased Fos immunoreactivity within the PVN (30), suggesting that PVN gene expression can be regulated by plasma ANG II levels. These observations, along with the role of exercise training in normalizing the enhanced RSNA in rats with HF, led us to hypothesize that one mechanism by which exercise training normalizes glutamatergic mechanisms within the PVN in HF is via the normalization of plasma ANG II levels. In the present study, we hypothesized that chronic ANG II type 1 (AT1) receptor blockade with losartan (Los) in rats with HF would normalize PVN NMDA-mediated RSNA responses as well as the increased NR1 expression within the PVN. A portion of this data has been presented in abstract form (14).
METHODS
Animals.
Male Sprague-Dawley rats weighing 220–280 g (Sasco Breeding Laboratories, Omaha, NE) were fed and housed according to institutional guidelines. Protocols were approved by the University of Nebraska Medical Center Institutional Animal Care and Use Committee and were in compliance with the National Institutes of Health Guide for the Care and Use of Laboratory Animals (NIH Pub. No. 85-23, Revised 1996). Rats were given rat chow and water ad libitum and were housed in a room with a 12:12-h light-dark cycle. Rats were allowed to acclimate for 1 wk before cardiac surgery.
Induction of HF.
Rats were randomly assigned to either the sham-operated control (Sham) group or the HF group. HF was induced by ligation of the left coronary artery, which has been previously described (24, 26, 43). Left ventricular (LV) dysfunction was assessed using hemodynamic and anatomic criteria. After 3 wk of Los administration, echocardiograms were performed to measure LV end-systolic diameter (LVESD) and LV end-diastolic diameter (LVEDD); ejection fraction (EF) and LV end-diastolic pressures (LVEDP) were also measured. LVEDP was measured using a Mikro-Tip catheter (Millar Instruments, Houston, TX) inserted into the LV via the right carotid artery. To measure infarct size, the heart was dissected free of adjacent tissues, and the atria were removed. The right ventricle was opened with a lengthwise incision such that the heart was flattened with the LV lying in the middle with the right ventricle on either side of it. The right ventricle was removed, and the remaining LV was laid flat. A digital image of the LV was captured using a Kodak DC290 digital camera (Kodak, Rochester, NY), and the infarcted area and total LV area were quantified using SigmaScan Pro. Infarct size (in %) was determined by dividing the size of the infarcted area by the total size of the LV. Rats with elevated LVEDP (≥15 mmHg) and infarct size >30% of the total LV wall were considered to be in HF. Five rats had infarct sizes <30% and were excluded from data analysis. Plasma ANG II was measured using a radioimmunoassay (Alpco Diagnostics, Salem, NH). The sensitivity of the ANG II assay was 0.68 pg/ml.
Los treatment.
Three weeks after coronary artery ligation, rats were randomly assigned to the vehicle-treated (Veh) group or the Los-treated group, resulting in four experimental groups: Sham + Veh, HF + Veh, Sham + Los, and HF + Los. Los-treated rats received 50 mg·kg−1·day−1 Los (11) (Merck, Whitehouse Station, NJ) in drinking water for a period of 3–5 wk. Veh-treated rats received normal tap water.
General surgery for hemodynamic and RSNA measurements and microinjection.
Experiments were performed 6–8 wk after HF surgery. Rats were anesthetized with urethane (0.75 g/kg ip) and α-chloralose (70 mg/kg ip). The left femoral vein was cannulated with polyethylene tubing (PE-50) for the injection of supplemental anesthesia. The left femoral artery was cannulated and connected via a pressure transducer (Gould P23 1D) to a computer-based data-recording and -analyzing program (PowerLab) to record mean arterial blood pressure (MAP) and heart rate (HR).
The left kidney was exposed through a retroperitoneal flank incision. A branch of the renal nerve was isolated from fat and connective tissue. The central end of the nerve was placed on thin bipolar platinum electrodes. The nerve-electrode junction was fixed and electrically insulated from surrounding tissues with a Wacker Silgel mixture (604 and 601). The electrical signal was amplified with a Grass amplifier with high- and low-frequency cutoffs of 1,000 and 100 Hz, respectively. The rectified output from the amplifier was displayed using the PowerLab system to record and integrate the raw nerve discharge. Basal nerve activity was determined by efferent RSNA at the beginning of the experiment, and background noise was determined by nerve activity recorded at the end of the experiment (after the rat had been euthanized). Nerve activity during the experiment was calculated by subtracting the background noise from the recorded value. The RSNA response to the injection of drugs into the PVN was expressed as the percentage change from the basal value.
For the placement of microinjection cannulas into the PVN, the anesthetized rat was placed in a stereotaxic apparatus (David Kopf Instruments, Tujanga, CA). A longitudinal incision was made on the head, and the bregma was exposed. A small burr hole was made in the skull to allow access to the PVN. The coordinates for the PVN, determined using the Paxinos and Watson atlas (25), were 1.5 mm posterior to the bregma, 0.4 mm lateral to midline, and 7.8 mm ventral to the dura. A thin needle (0.5-mm outer diameter, 0.1-mm inner diameter) connected to a 0.5 μl microsyringe (Hamilton) was lowered into the PVN. NMDA (Calbiochem) was injected into the PVN in three doses (50, 100, and 200 pmol in 50–200 nl over a period of 30 s) in random order. Subsequent injections were made at least 20 min after the prior injections to allow MAP, HR, and RSNA to return to basal levels.
Brain histology.
After the microinjection experiments, Chicago blue dye was injected into the brain to verify that the injection site was located within the PVN in a total of 25 rats. The brains were removed, fixed in 10% formalin for at least 24 h, sectioned (30 μm) on a crytostat, and processed for histology. Sections were mounted on gel-coated microscope slides and stained using 1% neutral red. The location of the injection was visualized on a microscope, and injections with terminations within the boundaries of the PVN were considered to be appropriately targeted to the PVN.
Micropunch of the PVN and isolation of mRNA for real-time RT-PCR and protein for Western blot measurements.
After the animal had been euthanized, the brain was removed and quickly frozen on dry ice from 40 rats (n = 10 rats/group). Six serial coronal sections (100 μm) were cut using a cryostat, and, following the Palkovits technique (23), the PVN was bilaterally punched using a diethylpyrocarbonate (DEPC)-treated blunt 18-gauge needle attached to a syringe, such that there were 12 total punches/brain. For each brain, half of the sample was placed in Tri-Reagent (Molecular Research Center) followed by sonication and extraction of mRNA following the manufacturer's instructions. Briefly, the homogenate was separated into organic and aqueous phases by the addition of bromochloropropane and subsequent centrifugation. The RNA (contained in the aqueous phase) was precipitated with isopropanol, washed with ethanol, and solubilized in 10 μl DEPC-treated water. The other half of the sample was placed in 100 μl protein extraction buffer (10 mM Tris, 1 mM EDTA, 1% SDS, 0.1% Triton X-100, and 1 mM PMSF), sonicated, and incubated for 30 min at 37°C to extract protein. In a subset of animals, the supraoptic nucleus (SON), lateral hypothalamus (LH), and dorsal cortex were punched at the same rostrocaudal level as the PVN to serve as anatomic control regions from the same cross-sectional slices.
Real-time RT-PCR measurement of NR1 mRNA.
After the extraction of mRNA, samples underwent reverse transcription for 40 min at 37°C in the presence of 1.5 M random hexamers and 100 units Moloney murine leukemia virus RTase. Real-time RT-PCR measurements were made using the iCycler iQ Multicolor Real-Time Detection System with output to a computer-based acquisition system (Bio-Rad). The protocol consisted of denaturation (95°C for 3 min), amplification and quantification repeated 50 times (95°C for 10 s and 55°C for 45 s), denaturation at 95°C for 1 min, reannealing at 55°C for 1 min, and a melt curve (55–95°C with a heating rate of 0.5°C/10 s). The reaction mixture consisted of SYBR Green Supermix (Bio-Rad), 10 nM sense primer, 10 nM antisense primer, DEPC-treated H2O, and the cDNA template of interest. For NR1, the sense primer was 5′-ATAGTGACAATCCACCAAGAGCC-3′ and the antisense primer was 5′-GTAGCTCGCCCATCATTCCGTT-3′. For rpl19, which was used as the reference gene, the sense primer was 5′-CCCCAATGAAACCAACGAAA-3′ and the antisense primer was 5′-ATGGACAGTCACAGGCTTC-3′. The relative expression of NR1 was calculated using the Pfaffl equation, which relates the expression of the target gene (NR1) to the expression of a reference gene (rpl19).
Western blot measurement of NR1 protein.
The total protein concentration from the extracted protein described above was measured using a BCA assay kit (Pierce). Samples were adjusted to contain the same concentration of total protein, and equal volumes of 2× 4% SDS sample buffer were then added. Samples were boiled for 3 min and then loaded onto a 7.5% SDS-PAGE gel (40 μg/20 μl per well). Gels were subjected to electrophoresis at 40 mA/gel for 60 min. Fractionated proteins on the gel were electrophoretically transferred to a polyvinylidene difluoride membrane (Millipore) at 300 mA for 90 min. The membrane was probed with primary antibody (rabbit anti-NR1, rabbit anti-NR2B, or rabbit anti-β-tubulin, Santa Cruz Biotechnology), washed with Tris-buffered saline-Tween, and then probed with secondary antibody (peroxidase-conjugated goat anti-rabbit IgG, Pierce). An enhanced chemiluminescence substrate (Pierce) was applied to the membrane for 5 min followed by a 30-s exposure within an Epi Chemi II Darkroom (UVP BioImaging) for visualization using the Worklab digital imaging system. Kodak MI software was used to highlight the bands and quantify the signal. The expression of NR1 or NR2B was calculated as the ratio of intensity of the NR1 or NR2B band, respectively, relative to the intensity of the β-tubulin band.
Cell culture.
The NG-108-15 (neuroblastoma X glioma) hybrid cells were grown in DMEM supplemented with 10% FBS, penicillin G, and streptomycin. The cultures were maintained at 37°C in a humidified atmosphere of 5% CO2. Cells were seeded in six-well plates and grown until 60–70% confluent before treatment with the indicated concentrations of ANG II (0.625 × 10⁻⁵–10 × 10−5M), Los (10−8–10−4M), or both for 24 h. Cells were washed twice with ice-cold PBS, homogenized with sonication in lysis buffer (10 mM Tris, 1 mM EDTA, 1% SDS, 0.1% Triton X-100, and 1 mM PMSF). The lysate was incubated at 37°C for 30 min. The protein content of the lysate was estimated using the BCA method with BSA as the standard (Pierce). NG-108 cell protein lysates (30–40 μg) were processed to measure NR1 protein by Western blot analyis as described above.
Data analysis.
Data are presented as means ± SE. Data were subjected to two-way ANOVA followed by a comparison for individual group differences using the Newman-Keuls test. Statistical significance was indicated by P values of <0.05.
RESULTS
General data.
Hemodynamic and LV pressure data as well as morphological characteristics before the acute experiments are shown in Table 1. Data represent mean values from animals used for RSNA experiments in addition to animals in which NR1 mRNA and protein from the PVN were measured. Only rats with ≥30% infarct of the LV wall were included in the analysis for the HF groups. Hearts from rats in the Sham groups had no visible myocardial damage. LVESD and LVEDD were significantly increased in the HF + Veh group compared with the Sham + Veh group. Los treatment in the HF + Los group had no effect on LVESD and attenuated LVEDD compared with the HF + Veh group, although LVEDD was still significantly elevated compared with both Sham groups. EF was decreased in the HF + Veh (50 ± 4%) and HF + Los (53 ± 14%) groups compared with the Sham + Veh (81 ± 2%) and Sham + Los (80 ± 8%) groups. LVEDP was significantly increased in the HF + Veh group (25.1 ± 2.0 mmHg) compared with the Sham + Veh group (4.7 ± 0.3 mmHg). LVEDP in the HF + Los group (14.4 ± 1.9 mmHg) was significantly attenuated compared with the HF + Veh group but was still significantly higher than that in the Sham + Veh and Sham + Los (6.9 ± 1.6 mmHg) groups. dP/dt was significantly decreased in both the HF + Veh (5,196 ± 413 mmHg/s) and HF + Los (5,754 ± 441 mmHg/s) groups compared with both the Sham + Veh (8,869 ± 363 mmHg/s) and Sham + Los (8,606 ± 566 mmHg/s) groups. Taken together, the ≥30% infarct size, increased LVEDP, LVESD, and LVEDD, and decreased dP/dt and EF indicate that rats in both HF groups were experiencing cardiac dysfunction.
Table 1.
Baseline, LV function, and plasma ANG II data
| Sham + Veh Group | HF + Veh Group | Sham + Los Group | HF + Los Group | |
|---|---|---|---|---|
| n | 16 | 16 | 15 | 16 |
| Body weight (after Los), g | 395 ± 12 | 392 ± 11 | 376 ± 6 | 392 ± 8 |
| Infarct size, %LV | 0 | 37 ± 2* | 0 | 38 ± 1* |
| LVESD, mm | 2.6 ± 0.1 | 6.9 ± 0.4* | 3.4 ± 0.3 | 6.2 ± 0.4 |
| LVEDD, mm | 6.3 ± 0.2 | 9.7 ± 0.4* | 6.9 ± 0.2 | 8.9 ± 0.4 |
| Ejection fraction, % | 81 ± 2 | 50 ± 4* | 80 ± 8 | 53 ± 14* |
| LVEDP, mmHg | 4.7 ± 0.3 | 25.1 ± 2.0* | 6.9 ± 1.6 | 14.4 ± 1.9*† |
| dP/dt, mmHg/s | 8,869 ± 363 | 5,196 ± 413* | 8,606 ± 566 | 5,754 ± 441* |
| Plasma ANG II, pg/ml | 68 ± 8 | 207 ± 40* | 446 ± 90† | 363 ± 54† |
Data are means ± SE; n, no. of rats/group. Rats were divided into the following groups: sham operated (Sham) + vehicle treatment (Veh), heart failure (HF) + Veh, Sham + losartan treatment (Los), and HF + Los. LV, left ventricular; LVESD and LVEDD, LV end-systolic and end-diastolic diameter, respectively; LVEDP, LV end-diastolic pressure.
P < 0.05 vs. Sham groups;
P < vs. Veh groups.
Plasma ANG II data are also shown in Table 1. Plasma ANG II was increased in the HF + Veh group (207 ± 40 pg/ml) compared with the Sham + Veh group (68 ± 8 pg/ml). Rats treated with Los had plasma ANG II levels significantly elevated above that of the HF + Veh group. In the Sham + Los group, the plasma ANG II concentration was 446 ± 90 pg/ml, whereas in the HF + Los group, the value was 363 ± 54 pg/ml.
Microinjection of NMDA into the PVN.
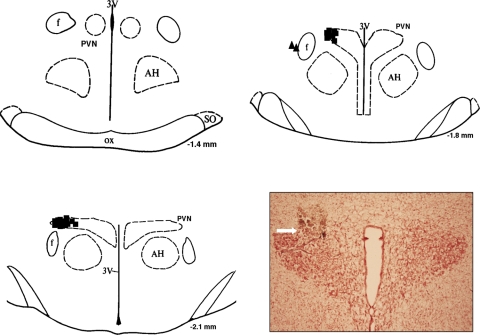
Figure 1 shows a schematic representation of sites of termination of NMDA injections into the PVN. Injections made outside of the PVN were not included in the analyzed data. Of 25 injections, 23 injections were found to be located within the PVN.
Fig. 1.
Injection sites within and around the paraventricular nucleus (PVN). Schematic representations of serial coronal sections from the rostral (−1.4) to caudal (−2.1) regions of the PVN are shown. The distance (in mm) is shown for each section according to the Paxinos and Watson atlas (25). Each solid square represents the site of termination of an injection within the PVN. Each solid triangle represents the site of termination of an injection outside of the PVN, the data from which were not included for analysis. Inset: representative photomicrograph of an injection site within the PVN of a rat. AH, anterior hypothalamus; f, fornix; 3V, third ventricle; SO, supraoptic nucleus; ox, optic tract.
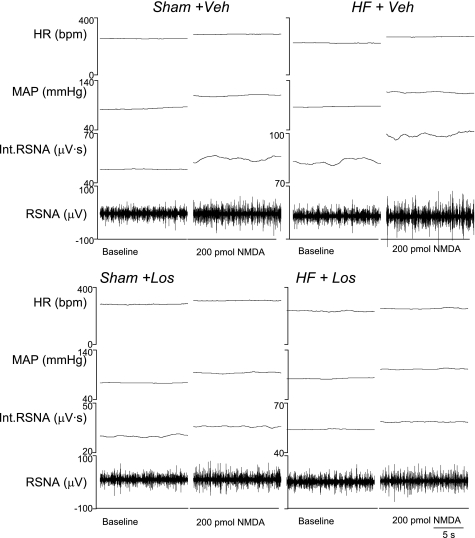
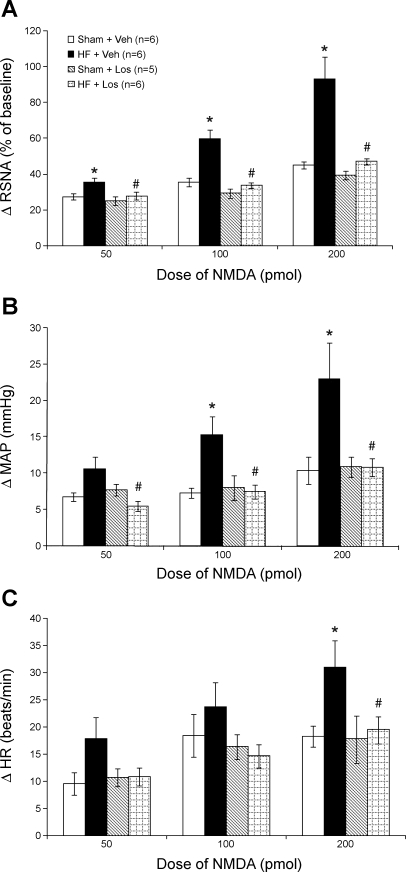
Figure 2 shows examples of responses of RSNA to microinjections of 200 pmol NMDA into the PVN of each of the experimental groups. Mean data demonstrating the increase in RSNA in response to the three doses of NMDA (50, 100, and 200 pmol) microinjected into the PVN are shown in Fig. 3A. At all three doses of NMDA, the increase in RSNA was greater in the HF + Veh group compared with the other groups. At 50 pmol, the response in the HF + Veh group was 35 ± 3% (n = 6), significantly higher (P < 0.05) than in the Sham + Veh (27 ± 2%, n = 6), Sham + Los (25 ± 2%, n = 5), and HF + Los (27 ± 2%, n = 6) groups. Similarly, the increase in RSNA in the HF + Veh group (60 ± 5%) in response to 100 pmol microinjected into the PVN was significantly higher (P < 0.05) than in the Sham + Veh (35 ± 3%), Sham + Los (29 ± 3%), and HF + Los (34 ± 2%) groups. At the highest dose of NMDA (200 pmol) microinjected into the PVN, the RSNA response was also significantly (P < 0.05) higher in the HF + Veh group (93 ± 13%) compared with the Sham + Veh (45 ± 2%), Sham + Los (40 ± 2%), and HF + Los (47 ± 2%) groups. There were no significant differences at any dose between the Sham + Veh, Sham + Los, and HF + Los groups. These data indicate that chronic AT1 receptor blockade by Los treatment normalizes the enhanced RSNA response to NMDA microinjected into the PVN in rats with HF.
Fig. 2.
Renal sympathetic nerve activity (RSNA), mean arterial pressure (MAP), and heart rate [HR; in beats/min (bpm)] responses to N-methyl-d-aspartate (NMDA) injected into the PVN. Segments of original recordings from individual rats from each experimental group [sham operated (Sham) + vehicle (Veh), HF + Veh, Sham + losartan (Los), and HF + Los groups] show the responses of RSNA, integrated (Int)RSNA, MAP, and HR to different doses of NMDA injected into the PVN.
Fig. 3.
Mean RSNA, MAP, and HR responses to NMDA injected into the PVN. A: mean changes in RSNA after injections of NMDA into the PVN. B: mean changes in MAP after injections of NMDA into the PVN. C: mean changes in HR after injections of NMDA into the PVN. *P < 0.05 vs. Sham groups within the same dose of NMDA; #P < 0.05 vs. Veh groups within the same dose of NMDA.
Figure 3B shows the increase in MAP in response to NMDA injected into the PVN. At 50 pmol NMDA, the increase in MAP in the HF + Los group (5 ± 1 mmHg) was significantly lower than in the HF + Veh group (11 ± 2 mmHg), although the response in the HF + Veh group was not significantly different from the Sham + Veh group (7 ± 1 mmHg). At 100 pmol NMDA, the increase in MAP in the HF + Veh group (15 ± 3 mmHg) was significantly (P < 0.05) higher than that in the Sham + Veh (7 ± 1 mmHg), Sham + Los (8 ± 2 mmHg), and HF + Los (7 ± 1 mmHg) groups. Similarly, at 200 pmol NMDA, the increase in MAP in the HF + Veh group (23 ± 5 mmHg) was significantly (P < 0.05) higher compared with the Sham + Veh (10 ± 2 mmHg), Sham + Los (11 ± 1 mmHg), and HF + Los (11 ± 1 mmHg) groups. Furthermore, the increase in MAP in the HF + Los group was not different from either of the Sham groups at any of the three doses of NMDA.
Figure 3C shows the increase in HR in response to three doses of NMDA injected into the PVN. While HR responses in the HF + Veh group tended to be higher than in the other groups at the two lower doses of NMDA (50 and 100 pmol), the differences were not statistically significant. At the highest dose of NMDA (200 pmol), the increase in HR in the HF + Veh group (31 ± 5 beats/min) was significantly (P < 0.05) higher than that in the Sham + Veh (18 ± 2 beats/min), Sham + Los (18 ± 4 beats/min), and HF + Los (19 ± 3 beats/min) groups, and the HF + Los group was not different from the Sham + Veh or Sham + Los groups.
Expression of NR1 subunit mRNA and protein within the PVN.
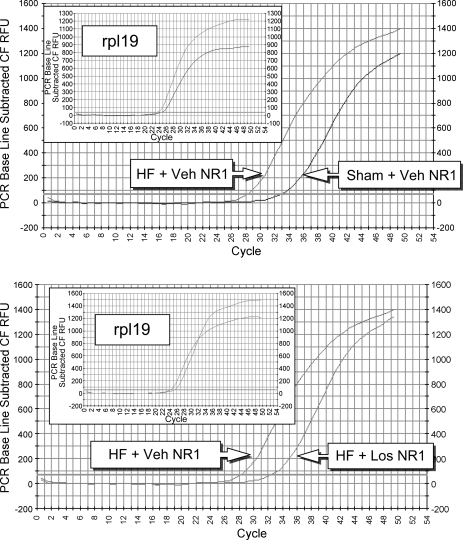
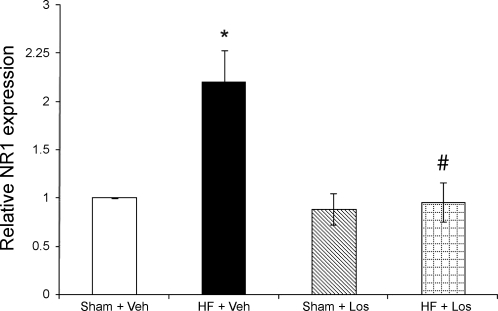
NR1 mRNA expression, as measured by real-time RT-PCR, is shown in Figs. 4 and 5. Examples of original real-time traces are shown in Fig. 4. Figure 5 shows the composite real-time RT-PCR data for the four experimental groups (n = 10 rats/group). Relative NR1 mRNA expression was significantly (P < 0.05) higher in the HF + Veh group (2.2 ± 0.3 relative units) compared with the Sham + Veh group (1.0 relative units). NR1 mRNA expression in the HF + Los group (1.0 ± 0.2 relative units), however, was significantly (P < 0.05) attenuated compared with the HF + Veh group and was not different from the Sham + Veh or Sham + Los groups (0.9 ± 0.2 relative units). These data indicate that chronic AT1 receptor blockade by Los normalizes the increased NR1 mRNA expression within the PVN in rats with HF.
Fig. 4.
mRNA expression of the NMDA receptor NR1 subunit in punched PVN samples measured by real-time RT-PCR. Expression was measured by determining at which cycle the fluorescence of each sample rose above threshold (Ct). Lower Ct values correspond to higher expression. Shown are examples of original real-time RT-PCR traces comparing the Sham + Veh and HF + Veh groups (top) and the HF + Veh and HF + Los groups (bottom). Insets: rpl19 (reference gene) traces.
Fig. 5.
mRNA expression of the NMDA receptor NR1 subunit in punched PVN samples measured by real-time RT-PCR. Mean data of the relative expression of NR1 mRNA to rpl19 mRNA are shown. *P < 0.05 vs. Sham groups; #P < 0.05 vs. Veh groups.
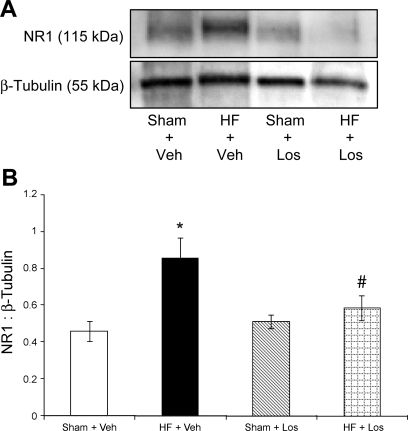
Figure 6 shows NR1 protein expression as measured by Western blot and calculated as the ratio of the density of the NR1 band to the density of the β-tubulin band. Figure 6A shows a sample gel with NR1 bands in the four experimental groups. Composite data for NR1 protein expression are shown in Fig. 6B (n = 10 rats/group). The level of relative NR1 protein expression in the HF + Veh group (0.86 ± 0.11) was significantly (P < 0.05) higher than that in the Sham + Veh group (0.46 ± 0.06). NR1 protein expression was significantly (P < 0.05) attenuated in the HF + Los group (0.59 ± 0.07) compared with the HF + Veh group and was not different from the Sham + Veh or Sham + Los (0.51 ± 0.04) groups.
Fig. 6.
Protein expression of the NMDA receptor NR1 subunit in punched PVN samples measured by Western blot analysis. A: example of visualized electrophoresis bands of NR1 protein. B: mean data of band densities of NR1 relative to β-tubulin. *P < 0.05 vs. Sham groups; #P < 0.05 vs. Veh groups.
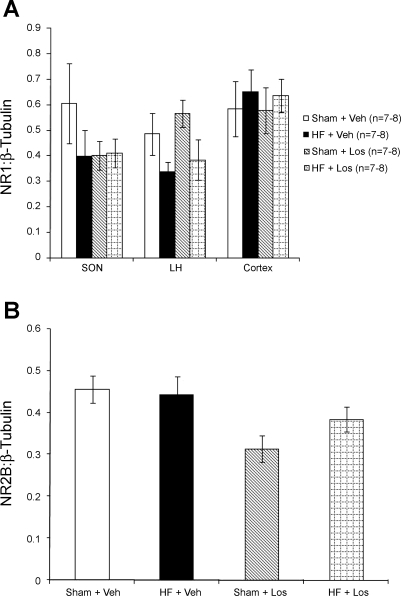
Figure 7 shows NR1 receptor protein expression within the SON, LH, and cortex and NR2B protein expression within the PVN. SON, LH, and cortex samples were obtained from the same coronal sections from which the PVN was punched. As shown in Fig. 7A, there were no significant differences in NR1 protein expression within the SON, LH, or cortex, suggesting that changes in NR1 expression are limited to the PVN. Additionally, as shown in Fig. 7B, there were no differences between groups in the expression of the NR2B subunit of the NMDA receptor within the PVN. Overall, these data show that chronic AT1 receptor blockade by Los normalizes the increased NR1 protein expression within the PVN in rats with HF.
Fig. 7.
Control protein expression of NMDA receptor subunits. A: protein expression of the NR1 subunit in punched supraoptic nucleus (SON), lateral hypothalamus (LH), and cortex samples measured by Western blot analysis. There were no significant differences between groups. B: NMDA receptor subunit NR2B protein expression in punched PVN samples measured by Western blot analysis. There were no significant differences between groups.
Protein expression of NR1 subunit in the NG-108 cell line.
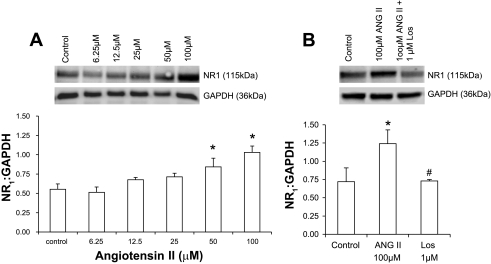
NG-108 cells were treated with different concentrations of ANG II, and changes in NR1 subunit expression were analyzed by Western blot after 24 h (Fig. 8A). NR1 subunit expression, as calculated by the ratio of the density of NR1 band to the density of GAPDH band, showed an increase with increasing concentrations of ANG II compared with the control. There was no significant change at lower doses; however, the effect was more pronounced at higher concentrations. At 50 μM ANG II, NR1 expression was increased by ∼32% compared with the control. To ascertain whether this increase in the expression of NR1 subunit was mediated by an AT1 receptor-mediated mechanism, NG-108 cells were incubated with different concentrations of Los (10–50 μM). Treatment with Los (50 μM) for 24 h significantly ameliorates the NR1 expression in NG-108 cells (Fig. 8B).
Fig. 8.
A: protein expression of NMDA receptor subunit NR1 (Western blot and densitometric analysis) in ANG II-treated NG-108 cells. B: effect of Los on the expression of NMDA receptor subunit NR1 protein in ANG II-treated NG-108 cells. *P < 0.05 vs. control; #P < 0.05 vs. ANG II.
DISCUSSION
In the present study, we showed that, in rats with HF, 3-wk Los treatment normalized the potentiated RSNA increase in response to NMDA microinjected into the PVN. We also showed that Los treatment in rats with HF normalized the increased mRNA and protein expression of the NMDA receptor subunit NR1. Taken together, these data support our hypothesis that chronic AT1 receptor blockade by Los treatment normalizes enhanced glutamatergic mechanisms within the PVN in rats with HF.
The coronary artery ligation model used to produce HF has been used extensively by this laboratory and others (26, 45). It has the advantage over other models of HF, such as ventricular pacing, in that ligation of the artery mimics blockade of the artery, a common observation in patients with HF. LVEDP and dP/dt are increased and EF is decreased in rats 6–8 wk after ligation of the coronary artery. In addition, this model produces an infarct that is >30% of the LV area. Taken together, these characteristics indicate that coronary artery ligation is an effective model of HF in rats.
According to histological data, the dye was distributed within the PVN, suggesting that the effects of the drug administrations were due to actions within the PVN. It is recognized that, although the spread of the dye is within the boundaries of the PVN, the spread of NMDA may not coincide perfectly with distribution of the dye. Our previous work (41–43) and work by others (33) have validated this technique of microinjection and appropriate controls in terms of, for example, adjacent nonactive sites, Veh controls, and leakage into the peripheral circulation. The Veh controls in this study and data with glass micropipette injections (data not shown) also suggest that any response or the absence of a response to microinjection of drugs into the PVN was not due to mechanical damage of the PVN by cannula placement or microinjection volumes.
The PVN, which is located within the forebrain, is involved in fluid balance and vasopressin release (39), receives afferent input from cardiac vagal neurons (20), and is directly involved in the modulation of sympathetic outflow (39). Preautonomic neurons of the dorsal and lateral parvocellular divisions of the PVN project to sympathetic preganglionic neurons within the intermediolateral cell column of the spinal cord (34) as well as to preautonomic neurons located within the rostral ventrolateral medulla (RVLM) (34). Given these characteristics of the PVN, in addition to the increased activity of PVN neurons in HF (9, 24), there is good evidence to indicate that the PVN is involved in the increased sympathoexcitation associated with HF. The results of the present experiments are in agreement with this idea. The excitatory glutamatergic mechanisms of the PVN are increased in HF, including increased responsiveness to NMDA microinjected into the PVN and increased expression of the NR1 subunit of the NMDA receptor.
While the PVN cannot receive direct input from plasma ANG II due to the presence of the blood-brain barrier, there are a number of circumventricular organs that project directly to the PVN, including the subfornical organ (SFO) (21) and organum vasculosum of the lamina terminalis (35). Of these, neurons from the SFO that project to the PVN have been shown to respond to bath-applied ANG II (2). SFO efferents to the PVN use ANG II as a neurotransmitter (18). An intravenous ANG II infusion increases Fos immunoreactivity in neurons within the SFO as well as the PVN (30). Thus, it is possible that the increased plasma ANG II in the HF state chronically activates PVN-projecting SFO neurons to alter the expression of the NMDA receptor via increased NR1 subunits, leading to the increased activation of preautonomic PVN neurons and subsequent augmented RSNA. The mechanism(s) by which NR1 gene expression is altered, however, is not clear.
Another explanation for the effect of Los on the increased glutamatergic mechanism in the PVN in HF may be through modulation of the brain renin-angiotensin system (RAS) in regions of the brain involved in neurohumoral control. RAS components, including renin, angiotensinogen, angiotensin-converting enzyme (ACE), ANG II, and ANG II receptors are found within the brain (4, 13, 27–29). ANG II acts as an excitatory neurotransmitter in the central nervous system (18). AT1 receptors have been immunohistochemically identified in sympathetic control regions, including the PVN (4, 27, 28), nucleus tractus solitarii (28), and RVLM (13), and injection of ANG II into these sites or intracerebroventricular ANG II injection elicits an increase in MAP (1, 5, 36). Additionally, bath-applied ANG II increases the discharge of PVN neurons retrogradely labeled from the RVLM, illustrating the PVN neurons that project to RVLM respond to ANG II (6).
In HF, the brain RAS is activated, particularly in the areas involved in neurohumoral control (10, 40). ACE and AT1 binding density, as measured by autoradiography, are increased in the SFO, organum vasculosum of the lamina terminalis, and PVN 4 and 8 wk after coronary artery ligation in rats (40). AT1 receptor mRNA and protein expression are increased in RVLM punches from rabbits with HF (10). An acute intracerebroventricular ANG II infusion increases RSNA to a greater extent in rabbits with HF than in Sham rabbits, whereas intracerebroventricular Los infusion decreases RSNA in HF but not Sham rabbits (10), suggesting that ANG II, through AT1 receptors, contributes to increased sympathetic outflow (7, 44). Similarly, DiBona et al. (7) demonstrated that an acute intracerebroventricular or intravenous infusion of Los decreased the elevated RSNA in rats with HF. Zhang et al. (44) used a chronic intracerebroventricular infusion of Los to attenuate the potentiated increase in RSNA after air jet stress in rats with HF. The results of these studies suggest molecular and functional upregulation of the brain RAS in HF may be involvement in the elevated sympathoexcitation observed in HF (7, 10, 40, 44).
In an isolated cell culture system, incubation of ANG II with NG-108 cells, which have been known to have both AT1 and NR1 receptors (32), causes a dose-dependent increase in the expression of NR1 receptor protein. Furthermore, coincubation with Los prevents the upregulation of the ANG II-induced increase in NR1 protein. These data are consistent with the idea that increased ANG II in rats with HF may have caused the increase in NR1 protein expression within the PVN of rats with HF.
A neuronal intracellular signaling pathway has been proposed (38) in which activation of the AT1 receptor activates the Ras/Raf/MEK/Erk pathway, increasing the transcription of c-fos and c-jun, and the resulting proteins Fos and Jun, which combine to form the activating protein (AP)-1 transcription factor (38). The gene encoding the NR1 subunit, Grin1, contains an AP-1 consensus element (22), but, to our knowledge, the effect of AT1 receptor activation on AP-1-mediated Grin1 transcription and subsequent NR1 expression has not been examined. Thus, elements of an AT1 receptor-mediated pathway involving a transcription factor that has a binding element on the gene encoding NR1 have been proposed, but a direct effect of AT1 activation on NR1 expression has not been studied until our in vitro data using NG-108 cell cutures. Again, it is important to note that, in our experiments, for a mechanism such as a direct effect of ANG II or Los on PVN neurons to occur, Los must be capable of crossing the blood-brain barrier, which is a matter that remains disputed (3, 17).
Los is an AT1 receptor antagonist that is commonly used in the treatment of patients with HF. In the present study, Los was administered to rats in drinking water, which mimics the method of delivery in HF patients. We chose this method over others, such as chronic infusion, since it was easy to ensure each rat received the correct dose and did not require surgical implantation of an intracerebroventricular catheter or an osmotic minipump. Furthermore, Los in the water did not affect the volume of water consumed per rat.
We found that NR1 protein expression was increased within the PVN. A functional NMDA receptor, however, is composed of both an NR1 and NR2 subunit (8, 37). The NR2B subunit is expressed at a higher level than NR2A, NR2C, and NR2D subunits within the parvocellular subdivisions of the PVN (12). In the present study, however, we found that NR2B expression was not altered by HF or by Los treatment. It is possible, however, that HF and/or Los treatment altered the expression of one or more of the remaining subunits within the PVN.
We also examined NR1 protein expression in three control areas taken from the same coronal section as the PVN punches. The SON, like the PVN, is located within the hypothalamus and is involved in cardiovascular control and fluid balance (31). However, HF and Los treatment did not alter NR1 expression within the SON. Anatomic control samples obtained from the LH, which is adjacent to the PVN (25), and the cortex showed no change in NR1 expression by HF or by Los treatment. Additionally, NMDA injected into sites outside of the PVN caused little or no change in RSNA. Taken together, these data indicate that the alterations in glutamatergic mechanisms associated with HF are limited to the NR1 subunit within the PVN.
In conclusion, the results of the present study indicate that chronic AT1 receptor blockade normalizes the augmented RSNA response to NMDA microinjected into the PVN and the enhanced expression of the NR1 subunit of the NMDA receptor. It is therefore possible that normalization of plasma ANG II levels is one mechanism by which exercise training normalizes enhanced glutamatergic mechanisms associated with HF.
GRANTS
This work was supported by National Heart, Lung, and Blood Institute Grant HL-62222 (to K. P. Patel) and American Heart Association Predoctoral Fellowship 05515518Z (to A. C. Kleiber).
DISCLOSURES
No conflicts of interest are declared by the author(s).
ACKNOWLEDGMENTS
The technical assistance of Dr. Kurtis Cornish, Dr. Xuefei Liu, Dr. Lirong Xu, and Phyllis Anding is greatly appreciated.
REFERENCES
- 1.Allen AM, Dampney RA, Mendelsohn FA. Angiotensin receptor binding and pressor effects in cat subretrofacial nucleus. Am J Physiol Heart Circ Physiol 255: H1011–H1017, 1988 [DOI] [PubMed] [Google Scholar]
- 2.Anderson JW, Smith PM, Ferguson AV. Subfornical organ neurons projecting to paraventricular nucleus: whole-cell properties. Brain Res 921: 78–85, 2001 [DOI] [PubMed] [Google Scholar]
- 3.Bui JD, Kimura B, Phillips MI. Losartan potassium, a nonpeptide antagonist of angiotensin II, chronically administered p.o. does not readily cross the blood-brain barrier. Eur J Pharmacol 219: 147–151, 1992 [DOI] [PubMed] [Google Scholar]
- 4.Bunnemann B, Fuxe K, Ganten D. The renin-angiotensin system in the brain: an update 1993. Regul Pept 46: 487–509, 1993 [DOI] [PubMed] [Google Scholar]
- 5.Casto R, Phillips MI. Cardiovascular actions of microinjections of angiotensin II in the brain stem of rats. Am J Physiol Regul Integr Comp Physiol 246: R811–R816, 1984 [DOI] [PubMed] [Google Scholar]
- 6.Cato MJ, Toney GM. Angiotensin II excites paraventricular nucleus neurons that innervate the rostral ventrolateral medulla: an in vitro patch-clamp study in brain slices. J Neurophysiol 93: 403–413, 2005 [DOI] [PMC free article] [PubMed] [Google Scholar]
- 7.DiBona GF, Jones SY, Brooks VL. ANG II receptor blockade and arterial baroreflex regulation of renal nerve activity in cardiac failure. Am J Physiol Regul Integr Comp Physiol 269: R1189–R1196, 1995 [DOI] [PubMed] [Google Scholar]
- 8.Dingledine R, Borges K, Bowie D, Traynelis SF. The glutamate receptor ion channels. Pharmacol Rev 51: 7–61, 1999 [PubMed] [Google Scholar]
- 9.Feng QP, Carlsson S, Thoren P, Hedner T. Characteristics of renal sympathetic nerve activity in experimental congestive heart failure in the rat. Acta Physiol Scand 150: 259–266, 1994 [DOI] [PubMed] [Google Scholar]
- 10.Gao L, Wang W, Li YF, Schultz HD, Liu D, Cornish KG, Zucker IH. Superoxide mediates sympathoexcitation in heart failure: roles of angiotensin II and NAD(P)H oxidase. Circ Res 95: 937–944, 2004 [DOI] [PubMed] [Google Scholar]
- 11.Gonçalves AR, Fujihara CK, Mattar AL, Malheiros DM, Noronha Ide L, de Nucci G, Zatz R. Renal expression of COX-2, Ang II, and AT1 receptor in remnant kidney: strong renoprotection by therapy with losartan and a nonsteroidal anti-inflammatory. Am J Physiol Renal Physiol 286: F945–F954, 2004 [DOI] [PubMed] [Google Scholar]
- 12.Herman JP, Eyigor O, Ziegler DR, Jennes L. Expression of ionotropic glutamate receptor subunit mRNAs in the hypothalamic paraventricular nucleus of the rat. J Comp Neurol 422: 352–362, 2000 [PubMed] [Google Scholar]
- 13.Hu L, Zhu DN, Yu Z, Wang JQ, Sun ZJ, Yao T. Expression of angiotensin II type 1 (AT1) receptor in the rostral ventrolateral medulla in rats. J Appl Physiol 92: 2153–2161, 2002 [DOI] [PubMed] [Google Scholar]
- 14.Kleiber AC, Zheng H, Patel KP. Chronic AT1 receptor blockade normalizes NR1 expression within the paraventricular nucleus (PVN) in rats with heart failure (HF) (Abstract). FASEB J 21: A1267, 2007 [DOI] [PMC free article] [PubMed] [Google Scholar]
- 15.Kleiber AC, Zheng H, Schultz HD, Peuler JD, Patel KP. Exercise training normalizes enhanced glutamate-mediated sympathetic activation from the PVN in heart failure. Am J Physiol Regul Integr Comp Physiol 294: R1863–R1872, 2008 [DOI] [PMC free article] [PubMed] [Google Scholar]
- 16.Li YF, Cornish KG, Patel KP. Alteration of NMDA NR1 receptors within the paraventricular nucleus of hypothalamus in rats with heart failure. Circ Res 93: 990–997, 2003 [DOI] [PubMed] [Google Scholar]
- 17.Li Z, Bains JS, Ferguson AV. Functional evidence that the angiotensin antagonist losartan crosses the blood-brain barrier in the rat. Brain Res Bull 30: 33–39, 1993 [DOI] [PubMed] [Google Scholar]
- 18.Li Z, Ferguson AV. Subformical organ efferents to paraventricular nucleus utilize angiotensin as a neurotransmitter. Am J Physiol Regul Integr Comp Physiol 265: R302–R309, 1993 [DOI] [PubMed] [Google Scholar]
- 19.Liu JL, Irvine S, Reid IA, Patel KP, Zucker IH. Chronic exercise reduces sympathetic nerve activity in rabbits with pacing-induced heart failure: a role for angiotensin II. Circulation 102: 1854–1862, 2000 [DOI] [PubMed] [Google Scholar]
- 20.Lovick TA, Coote JH. Effects of volume loading on paraventriculo-spinal neurones in the rat. J Auton Nerv Syst 25: 135–140, 1988 [DOI] [PubMed] [Google Scholar]
- 21.Meselis RR. The efferent porjections of the subfornical organ of the rat: a circumventricular organ within a neural network subserving water balance. Brain Res 230: 1–23, 1981 [DOI] [PubMed] [Google Scholar]
- 22.Myers SJ, Dingledine R, Borges K. Genetic regulation of glutamate receptor ion channels. Annu Rev Pharmacol Toxicol 39: 221–241, 1999 [DOI] [PubMed] [Google Scholar]
- 23.Palkovits M, Brownstein M. Brain microdissection techniques. In: Brain Microdissection Techniques, edited by Cuello AE. Chichester: Wiley & Sons, 1983 [Google Scholar]
- 24.Patel KP, Zhang PL, Krukoff TL. Alterations in brain hexokinase activity associated with heart failure in rats. Am J Physiol Regul Integr Comp Physiol 265: R923–R928, 1993 [DOI] [PubMed] [Google Scholar]
- 25.Paxinos G, Watson C. The Rat Brain in Stereotaxic Coordinates Orlando, FL: Academic, 1986 [Google Scholar]
- 26.Pfeffer MA, Pfeffer JM, Fishbein MC, Fletcher PJ, Spadaro J, Kloner RA, Braunwald E. Myocardial infarct size and ventricular function in rats. Circ Res 44: 503–512, 1979 [DOI] [PubMed] [Google Scholar]
- 27.Pfister J, Felix D, Imboden H. Immunohistochemical demonstration of angiotensin II receptors in rat brain by use of an anti-idiotypic antibody. Regul Pept 44: 109–117, 1993 [DOI] [PubMed] [Google Scholar]
- 28.Phillips MI, Shen L, Richards EM, Raizada MK. Immunohistochemical mapping of angiotensin AT1 receptors in the brain. Regul Pept 44: 95–107, 1993 [DOI] [PubMed] [Google Scholar]
- 29.Ramsay DJ. The brain renin angiotensin system: a re-evaluation. Neuroscience 4: 313–321, 1979 [DOI] [PubMed] [Google Scholar]
- 30.Rowland NE, Li BH, Rozelle AK, Fregly MJ, Garcia M, Smith GC. Localization of changes in immediate early genes in brain in relation to hydromineral balance: intravenous angiotensin II. Brain Res Bull 33: 427–436, 1994 [DOI] [PubMed] [Google Scholar]
- 31.Sawchenko PE, Swanson LW. The organization and biochemical specificity of afferent projections to the paraventricular and supraoptic nuclei. Prog Brain Res 60: 19–29, 1983 [DOI] [PubMed] [Google Scholar]
- 32.Schelman WR, Kurth JL, Berdeaux RL, Norby SW, Weyhenmeyer JA. Angiotensin II type-2 (AT2) receptor-mediated inhibition of NMDA receptor signaling in neuronal cells. Mol Brain Res 48: 197–205, 1997 [DOI] [PubMed] [Google Scholar]
- 33.Segura T, Martin DS, Sheridan PJ, Haywood JR. Measurement of the distribution of [3H]bicuculline microinjected into the rat hypothalamus. J Neurosci Methods 41: 175–186, 1992 [DOI] [PubMed] [Google Scholar]
- 34.Shafton AD, Ryan A, Badoer E. Neurons in the hypothalamic paraventricular nucleus send collaterals to the spinal cord and to the rostral ventrolateral medulla in the rat. Brain Res 801: 239–243, 1998 [DOI] [PubMed] [Google Scholar]
- 35.Silverman AJ, Hoffman DL, Zimmerman EA. The descending afferent connections of the paraventricualr nucleus of the hypothalamus (PVN). Brain Res Bull 6: 47–61, 1981 [DOI] [PubMed] [Google Scholar]
- 36.Stadler T, Veltmar A, Qadri F, Unger T. Angiotensin II evokes noradrenaline release from the paraventricular nucleus in conscious rats. Brain Res 569: 117–122, 1992 [DOI] [PubMed] [Google Scholar]
- 37.Sucher NJ, Awobuluyi M, Choi YB, Lipton SA. NMDA receptors: from genes to channels. Trends Pharmacol Sci 17: 348–355, 1996 [PubMed] [Google Scholar]
- 38.Summers C, Fleegal MA, Zhu M. Angiotensin AT1 receptor signaling pathways in neurons. Clin Exp Pharmacol Physiol 29: 483–490, 2002 [DOI] [PubMed] [Google Scholar]
- 39.Swanson LW, Sawchenko PE. Paraventricular nucleus: a site for the integration of neuroendocrine and autonomic mechanisms. Neuroendocrinology 31: 410–417, 1980 [DOI] [PubMed] [Google Scholar]
- 40.Tan J, Wang H, Leenen FH. Increases in brain and cardiac AT1 receptor and ACE densities after myocardial infarct in rats. Am J Physiol Heart Circ Physiol 286: H1665–H1671, 2004 [DOI] [PubMed] [Google Scholar]
- 41.Zhang K, Mayhan WG, Patel KP. Nitric oxide within the paraventricular nucleus mediates changes in renal sympathetic nerve activity. Am J Physiol Regul Integr Comp Physiol 273: R864–R872, 1997 [DOI] [PubMed] [Google Scholar]
- 42.Zhang K, Patel KP. Effect of nitric oxide within the paraventricular nucleus on renal sympathetic nerve discharge: role of GABA. Am J Physiol Regul Integr Comp Physiol 275: R728–R734, 1998 [DOI] [PubMed] [Google Scholar]
- 43.Zhang K, Li YF, Patel KP. Reduced endogenous GABA-mediated inhibition in the PVN on renal nerve discharge in rats with heart failure. Am J Physiol Regul Integr Comp Physiol 282: R1006–R1015, 2002 [DOI] [PubMed] [Google Scholar]
- 44.Zhang WG, Huang BS, Leenen FH. Brain renin-angiotensin system and sympathetic hyperactivity in rats after myocardial infarction. Am J Physiol Heart Circ Physiol 276: H1608–H1615, 1999 [DOI] [PubMed] [Google Scholar]
- 45.Zhang ZH, Francis J, Weiss RM, Felder RB. The renin-angiotensin-aldosterone system excites hypothalamic paraventricular nucleus neurons in heart failure. Am J Physiol Heart Circ Physiol 283: H423–H433, 2002 [DOI] [PubMed] [Google Scholar]
- 46.Zucker IH, Wang W, Brändle M, Schultz HD, Patel KP. Neural regulation of sympathetic nerve activity in heart failure. Prog Cardiovasc Dis 37: 397–414, 1995 [DOI] [PubMed] [Google Scholar]


