

Abstract
In an effort to define novel transcriptional regulatory elements, microarray cotransfection was used to functionally characterize conserved non-coding sequences (CNSs) of three immediate early genes: c-fos, JunB and EGR-1. Cotransfection of fluorescent CNS reporter constructs and expression vectors for constitutively active signaling proteins demonstrated that many of the CNSs alter both the basal and regulated expression of reporter constructs, but the effects of these CNSs were usually specific for their homologous promoter. One CNS located in the first intron of the c-fos gene conferred regulation by cAMP-dependent protein kinase (PKA), cGMP-dependent protein kinase (PKG) and Raf. Mutagenesis and cotransfection experiments showed that PKA regulation of this c-fos intronic element was mediated by two adjacent CRE-like sequences and the transcription factor CREB. In the context of a reporter containing previously characterized regulatory elements, the novel intronic sequence contributed 50% of the transcriptional response to PKA. These studies suggest that microarray transfection studies may be useful in functional characterization of conserved genomic sequences on a larger scale.
Keywords: Microarray transfection, transcriptional regulation, cAMP response element, conserved sequences
Introduction
Analyses of the human and other mammalian genomes shows that 5% of the human genome has evolved under significant evolutionary constraint, but only a third of these sequences can be assigned to protein-coding regions [1]. A detailed understanding of the potential role these conserved non-coding sequences (CNSs) play in transcriptional regulation in vivo remains a major goal for the field of functional genomics [2]. However, this effort is hampered by our limited global understanding of transcription factor (TF) function. Since experimental determinations of TF binding specificity are incomplete, bioinformatic approaches relying on this information can be inaccurate [3; 4]. For example, bioinformatic and experimental approaches have identified 1500 human genes with cognate cAMP response element (CRE) sequences for the well-studied TF, cyclic AMP response element binding protein (CREB), however less than 2% of these genes actually respond transcriptionally to cAMP elevation [5]. The mechanisms responsible for this higher order specificity are not well understood, but are likely to involve chromatin modifications such as histone methylation or acetylation [6; 7].
The transcriptional regulation of the immediate early genes (IEGs) is well studied, in part because this regulation results from the activation of pre-existing transcription factors and does not require protein synthesis [8; 9]. The tissue specific expression of IEGs from the c-fos, Jun and Krox protein families is thought to participate differentially in the tissue-specific transcriptional responses of multiple cell types. Transcription of IEGs is rapidly and transiently increased in response to growth factor activation of the mitogen-activated protein kinase pathway as well as the cAMP and cGMP pathways.
Transfection of cells in a microarray format has been used to characterize the in vivo functional role of individual proteins using siRNA and cotransfection of signaling proteins [10; 11]. However, this strategy has not been previously applied to screen for functional cis-regulatory sequences. We have described a solid phase cotransfection method termed Surface Transfection and Expression Protocol (STEP) that relies on the use of recombinant proteins to mediate the cotransfection of multiple cell types, including neuronal cell lines and neurons [12; 13]. By combining STEP cotransfection with comparative genomic analysis, we show that many of the 22 CNSs associated with 3 immediate early genes (c-fos, JunB and EGR1) are regulated in a microarray transfection assay. We then studied in detail a novel regulatory element within the first intron of the c-fos gene which contributes significantly to regulation of the c-fos gene by PKA, PKG and Raf.
Results
Using a functional genomic approach, we sought to determine if microarray transfection could be used to identify sequences mediating transcriptional regulation of the c-fos, JunB and EGR1 genes. As shown in Fig. 1, genomic sequences from all 3 IEGs are rich in CNSs, particularly in the region upstream of the transcriptional start site. Based on sequence conservation among mammalian genomic sequences, CNSs for each of these genes were targeted for isolation by PCR amplification of genomic sequences (see Supplementary Table 1).
Fig. 1. Identification of highly conserved non-coding sequences (CNSs) within and adjacent to the c-fos, JunB and EGR1 immediate early genes.
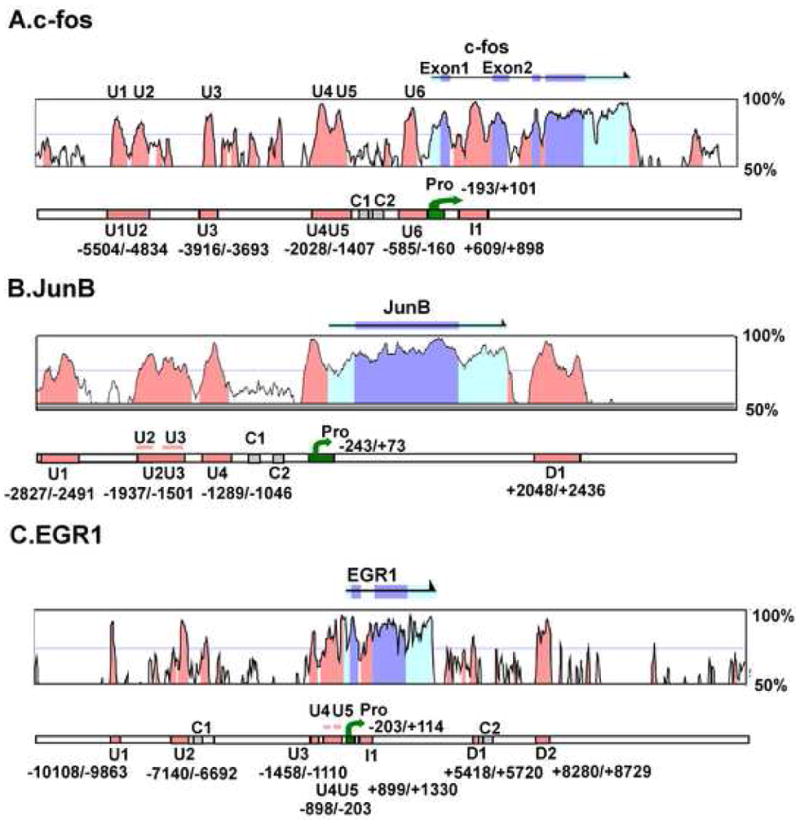
For c-fos (A), JunB (B), and EGR1 (C) the upper panel shows the nucleotide sequence identity between the corresponding mouse and human genomic sequences as analyzed by VISTA(http://pipeline.lbl.gov). The CNSs outside exonic regions which show more than 75% conservation are located and marked with orange. The arrows above the graph indicates the transcribed sequences and exons are marked with blue. The lower panel indicates the regions of CNSs and promoter used to construct reporters in later Fig. s. The promoter fragments are indicated in green, the CNSs are orange, and the control fragment (less than 60% conservation) are gray.
IEGs are transcriptionally regulated by intracellular signaling pathways which result in phosphorylation of many TFs. These signaling pathways include the cAMP/PKA, cGMP/PKG and the Ras/MAPK pathways. We initially chose expression vectors for the Cα catalytic subunit isoform of PKA [14], the CAAX mutant of Raf-1 [15] and the V12G mutant of the Ras protein [16] as co-transfected effector proteins. We determined the ability of these three signaling proteins to regulate CNS reporter activity in the microarray cotransfection assay. Each of these three effector constructs was independently co-transfected with one of the CNS-GFP reporter constructs by spotting STEP complexes onto microscope slides and plating HEK-293T cells onto the arrayed complexes. After 36 h the cellular EGFP fluorescence was determined by fluorescence microscopy of individual spots or by fixing the cells and scanning the slides as described [12] (see Materials and Methods). A representative fluorescence scan image of a fixed slide is shown in Fig. 2A, where regulation of the reporter EGFP fluorescence by the cotransfected effector vectors can be seen.
Fig. 2. The presence of CNSs determine regulation of IEG EGFP reporters by constitutively activated signaling proteins.
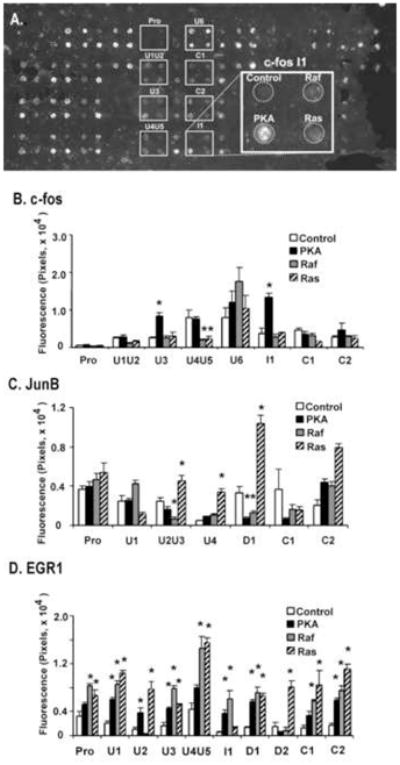
(A) The fluorescence of EGFP reporters in cells 48 hours after transfection is shown. Each small white rectangle indicates a set of four regions where a CNS reporter was co-transfected with one of four different expression vectors for constitutively active signaling proteins. Each rectangle corresponds to a 1.7mm × 2.0 mm region of the microscope slide. The larger rectangle shows at a higher magnification the cellular fluorescence associated with cells transfected with the I1c-fos CNS reporter and the constitutively active signaling proteins (Ras, Raf and PKA). For the c-fos (B), JunB (C) and EGR1 (D) reporters, the panels show representative STEP assay results in HEK-293T cells. The transfected DNA contained 90% of the indicated reporter plasmid and 5% of PKA, Ras or Raf expression vector or the control vector. The STEP assay was performed as described in Materials and Methods. For the results shown here, EGFP fluorescence was monitored from the living cells using fluorescence microscopy. Cellular fluorescence levels that show statistical significant differences (p<0.05)from the corresponding control cotransfections are indicated with an asterix (*).
As shown in Figs. 2B–D, quantitation of the cellular fluorescence 36 h after transfection demonstrated that the basal activity of the reporters in the absence of co-transfected proteins was significantly influenced by the presence of individual CNSs. For the c-fos promoter, all of the CNSs increased the basal activity of over the c-fos promoter alone, but the U4U5 and U6 sequences increased the basal level by more than an order of magnitude. On the other hand, for the JunB and EGR1 promoters the addition of CNSs often decreased basal activity. Cotransfection with the constitutively active PKA expression vector increased transcription over basal levels for the c-fos U3 and I1 reporters (Fig. 2B). PKA cotransfection typically had little effect on the transcription of the JunB CNS reporters, although the D1 CNS sequence showed strong repression by PKA (Fig. 2C). PKA had a small stimulatory effect on the EGR1 promoter construct as well as the various EGR1 CNS reporters, with the exception of the D2 CNS (Fig. 2D). The statistically significant results from these experiments at 36 hr following transfection are summarized in Table 1. PKA was found to positively regulate two c-fos CNS reporters (U3 and I1) but to negatively regulate the JunB-D1 CNS reporter. Raf downregulated two CNS reporters (cfos-U4U5 and JunB-U2U3) but stimulated the EGR1-promoter. Since the EGR1 promoter showed regulation by Raf and Ras, most of the CNS reporters derived from this promoter showed regulation as well and statistically significant from the basal promoter was not found for most CNS reporters.
Table 1.
Statistically significant regulation of IEG CNS reporters.
| Reporter | HEK 36 hr | HEK 48 hr | Neuro2A 60 hr |
|---|---|---|---|
| cfos-pro | - | PKG(+9.5) | Ras(+2.4) |
| cfos-U1U2 | - | PKG(+5.4) | Ras (+3.2) |
| cfos-U3 | PKA(+3.2) | PKA(+2.8), PKG(+1.9) | - |
| cfos-U4U5 | Raf(−3.3), Ras(−3.0) | PKG(+3.2), Raf(−6.9) | - |
| cfos-U6 | - | - | Raf(−1.5), Ras(−2.4) |
| cfos-I1 | PKA(+3.7) | PKA(+12.4), PKG(+6.3) | PKA(+7.9), PKG(+7.7), Ras(+4.9) |
| cfos-C2 | - | PKG(+3.4) | PKA(+1.4), PKG(−1.8) |
| JunB-U2U3 | Raf(−2.8), Ras (+1.8) | nd | nd |
| JunB-U4 | Ras(+4.1) | nd | nd |
| JunB-D1 | PKA(−2.4), Raf(−2.1), Ras(+2.2) | nd | nd |
| EGR1-pro | Raf(+1.9), Ras(+1.7) | nd | nd |
All interactions shown demonstrated p<0.05 for three independent experiments. The numbers in parentheses indicate the average fold regulation observed. A dash (-) indicates that no statistically significant regulation was detected. nd indicates that the experiments were not done.
Because the CNS reporters derived from the c-fos gene showed the greatest diversity in response to cotransfection (Fig. 2B), we compared the c-fos reporters in two different cell types: human Hek293T cells and mouse Neuro2A neuroblastoma cells. These two cell types differ significantly in cell signaling pathways and transcription factors [12]. Conservation of regulation in both these cells would correlate with evolutionary conservation of transcriptional regulation between mouse and human cells. Also, because at longer times following transfection some reporters showed increased fluorescence, we incubated HEK-293T cells for 48 hrs and Neuro2A cells for 60 hours before fluorescence quantitation. These experiments also included an expression vector for an additional constitutively active signaling protein, the S79D constitutively active mutant of type I PKG [14]. PKG and PKA show similar in vitro substrate specificity, but have been shown to differ in their in vivo regulation of gene transcription since PKA readily enters the nucleus but PKG does not [14].
As shown in Fig. 3A, the general trends in promoter regulation in HEK cells at a later 48 h time point were comparable to those seen at 36 h (Fig. 2B) although the basal activity of some of the reporters is higher. In particular, the U3 and I1 reporters again showed show significant increases when co-transfected with PKA in HEK-293T cells (Table 1). Surprisingly, while the minimal c-fos promoter again showed only minor induction by PKA, it was more significantly induced by PKG.
Fig. 3. Cell-type specific regulation of c-fos CNS sequences by five constitutively active signaling proteins.
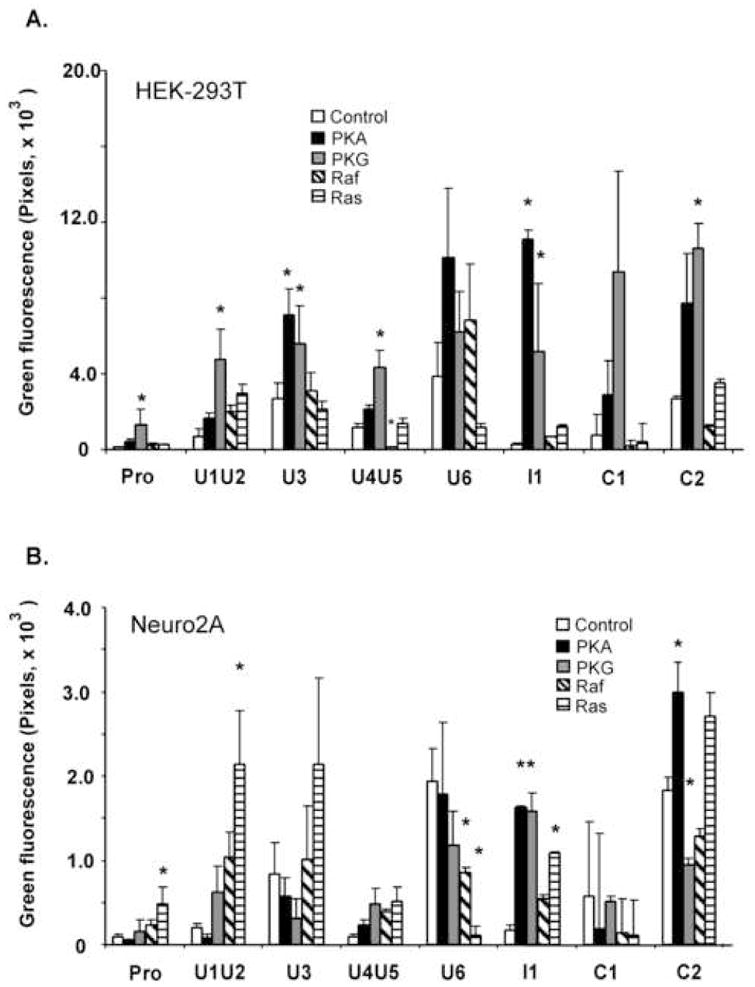
EGFP cellular fluorescence associated with STEP transfected HEK-293T cells (A) and Neuro2A neuroblastoma cells is shown. In both cell types, DNA contains 90% of c-fos CNS reporter plasmid and 10% of expression vector for the indicated constitutively active signaling protein or control vector (see Materials and Methods). At 48 or 60 hours after transfection, EGFP fluorescence was monitored from the living cells using fluorescence microscopy. Cellular fluorescence levels that show statistical significant differences (p<0.05)from the corresponding control cotransfections are indicated with an asterix (*).
In Neuro2A cells, the minimal c-fos promoter showed higher induction by Raf and Ras than by PKG, and it was not induced by PKA. Also, while the c-fos U3 and I1 constructs showed induction by PKA in HEK cells, these constructs yielded different results in Neuro2A cells. The c-fos U3 reporter was not induced by PKA in Neuro2A cells but the I1 reporter showed a strong, significant induction by PKA. Several of the CNS reporters (U1U2, U3, I1 and C2) showed a strong induction by Ras (Table 1).
While many of these regulatory interactions need to be studied further, we chose the c-fos I1 CNS within the first intron of the c-fos gene for a more detailed characterization. In part, this choice was because intronic elements have been characterized less often than extragenic elements and also in part because we observed consistent regulation of this element by both PKA and PKG in both HEK and Neuro2A cells. Furthermore, this sequence is stringently conserved during evolution, with some sequence elements more highly conserved between human and mouse than c-fos coding sequences (see Fig. 1).
As shown in Fig. 4A, the c-fos I1 sequence is predicted to have three conserved SP1 binding sites and two CRE-like sequences (see Materials and Methods). We first created a series of deletion mutants within the I1 sequence (I1-D1 through 11-D6) and oriented these mutants upstream of the basal c-fos promoter, outside of the normal I1 intronic context. Following STEP transfection (Fig. 4B), the D4 and D5 mutants which lacked either one or both of the CRE-like sequences showed no statistically significant regulation by PKA.
Fig. 4. Two cAMP response elements (CREs) within intron1 of the c-fos gene mediate PKA-induction of I1 reporter constructs.
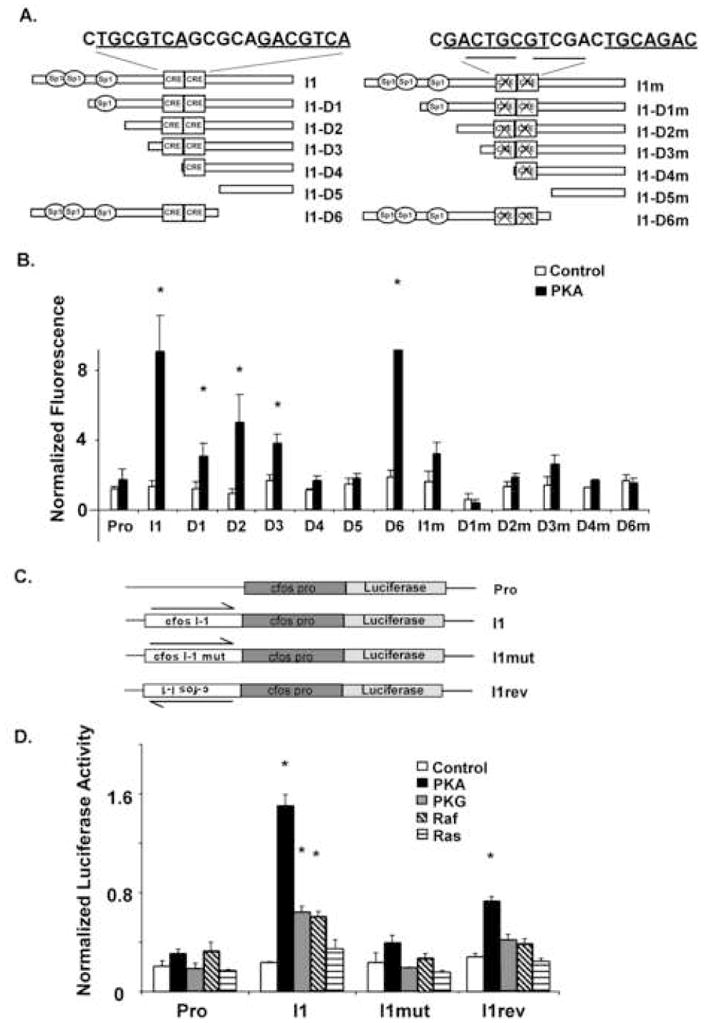
(A) Schematic structure of I1 and its 5′ progressive- or 3′ deletions. Left: I1 and its 5′ and 3′ deletion. Right: the corresponding mutations (mutation of both CRE) of the I1 related structure shown in left panel. All of the fragments were subcloned into an EGFP reporter plasmid containing the minimal c-fos promoter (see Materials and Methods). (B) Normalized EGFP fluorescence for the reporter constructs shown in panel A. The transfected DNA contained 90% of reporter plasmid and 5% of expression vector and 5% pCMVDsRed-1 (internal control). At 40 hours after transfection, slides were fixed with ice cold methanol and fluorescence was monitored using a fluorescence slide scanner (refer to Materials and Methods). Cellular fluorescence levels that show statistical significant differences (p<0.05) from the corresponding control cotransfections are indicated with an asterix (*). (C) Schematic structure of firefly luciferase reporter constructs. (D) Firefly luciferase reporter activities relative to the RL-SV40 renilla internal control are shown for cells at 24 hours after transfection in HEK-293T cells. For these solution transfection experiments, transfected DNA consisted of 5% reporters, 85% expression vectors, 5% pRL-SV40 and 5% EGFP-C1. EGFP expression was used for microscopic examination of transfected cells to ensure that transfection efficiencies were comparable on a cellular level. Normalized luciferase (firefly divided by Renilla) levels that show statistical significant differences (p<0.05) from the corresponding control cotransfections are indicated with an asterix (*).
Because transcriptional regulation of the I1 element by PKA was abolished in the D4 and D5 deletion mutants lacking one or both CREs, these sequences were targeted for mutagenesis as shown in Fig. 4A. The CRE sequences were scrambled and reintroduced to the I1 element constructs as described in the Materials and Methods. Mutation of the CREs nearly eliminated the ability of the I1 sequence to respond to PKA cotransfection in the full-length I1 CNS, as well as in all of the deletion mutants (Fig. 4B).
In order to characterize the I1 regulatory sequences in greater detail, we constructed corresponding firefly luciferase reporters containing the c-fos I1 CNS sequences as shown in Fig. 4C. When transfected into HEK-293T cells by solution transfection, the I1-c-fos luciferase reporter construct showed the same induction by PKA seen previously with the I1-c-fos EGFP construct in the microarray transfection assay (Fig. 4D). Furthermore, this induction required the kinase activity of PKA because the induction was not seen with a catalytically inactive form of PKA Cα containing a Lys72 to Met mutation (data not shown). The mutant I1 reporter construct in which the two CRE sequences had been scrambled was significantly reduced in the ability to be regulated by PKA (p<0.05). The I1-c-fos luciferase construct also showed regulation by PKG and Raf and this regulation was reduced in the mutant I1 reporter. Finally, when cloned in the reverse orientation, the I1 sequence still showed a regulation by PKA albeit at significantly lower levels than the forward orientation. Thus the regulation of I1 function by PKA seen using the EGFP reporter was also confirmed using the firefly luciferase reporter.
Regulation of c-fos transcription is extremely complex and regulatory interactions include a transcriptional pause site at the 5′ end of the first intron [17; 18]. Since the original characterization of the I1 sequence using microarray transfection (Fig. 2) involved assay of the I1 sequence outside of its intronic context, we sought to determine whether the CRE sequences of I1 were functional when present in their native intronic location. For this reason, we generated a firefly luciferase reporter construct containing 1 kb of 5′ sequence upstream of the c-fos transcription start site, the c-fos promoter, exon 1, intron 1 and a fragment of exon 2 (nucleotides −1050 to +1259 relative to the c-fos transcriptional start site -See Fig. 5A). This construct produces a fusion protein containing the first 56 amino acids of the c-fos gene fused to the amino terminus of the firefly luciferase gene and includes the c-fos U6 CNS. We also mutated the 2 CREs elements within this 2.2kb c-fos reporter to generate the 2.2kb c-fos mut reporter.
Fig. 5. The two CRE-like sequences within intron 1 regulate a c-fos reporter construct.
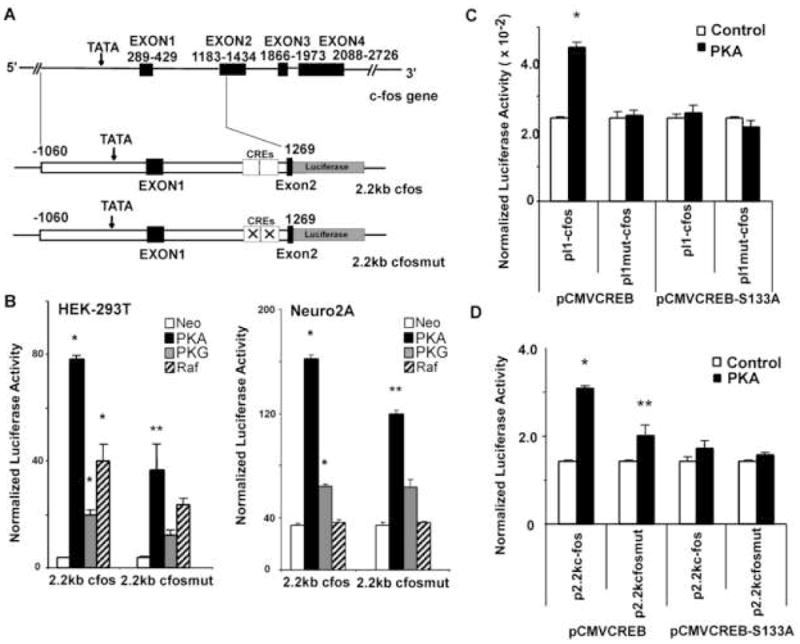
(A) Schematic structure of c-fos gene and reporter constructs with the location of the CREs indicated. (B) Relative luciferase activity of the reporters at 24 hours following cotransfection with PKA, PKG and Raf expression vectors (normalized to the internal control of Renilla luciferase). Left: Normalized luciferase assay data (firefly over Renilla) from HEK-293T cells. Right: Normalized luciferase assay data from Neuro2A neuroblastoma cells. (C) Normalized luciferase activity of the reporters in which I1-c-fos promoter is immediately after I1 or its mutants. (D) Normalized luciferase activity of the reporters with I1 located in the first intron. F9 teratocarcinoma cells were transfected as described in Materials and Methods. Renilla (RL-US2) and firefly luciferase activities were determined 24 h after transfection. Normalized luciferase levels that show statistically significant differences (p<0.05) from the corresponding control cotransfections are indicated with an asterix (*). The double asterix (**) indicates samples that show statistically significant differences (p<0.05) from the corresponding wildtype reporter construct.
Transfection of the 2.2 kb c-fos reporter into HEK cells demonstrated that the basal expression level of p2.2kc-fosLuc is significantly higher than that of pI1c-fosLuc (50–200 fold higher – compare Figs. 5B and 4D). This higher efficiency for the 2.2kcfosLuc was observed even within the same transfection experiment (data not shown). This result might be expected since the 2.2kb genomic fragment contains many additional cis-regulatory elements in their native context as compared the I1-c-fos reporter. As shown in Fig. 5B, PKA, PKG and Raf all significantly (p<0.05) regulated the 2.2 kb c-fos reporter. The 2.2kb c-fosmut reporter in which the two CRE sequences were mutated demonstrated that the ability to be regulated by all three constitutively active signaling proteins was reduced when the intronic CRE sites were mutated, although the regulation by PKA was the only interaction that showed statistically significant reduction when the CREs were mutated. Induction by PKA was reduced by more than 50% in HEK-293T cells for the mutant reporter as compared to the wildtype 2.2kb c-fos reporter. Reductions in regulation by PKG and Raf were more modest, 21% and 28%, but still suggested a role for the CREs in regulation by those proteins. Interestingly, when the reporter was transfected into Neuro2A cells, PKA and PKG regulated expression of the wildtype reporter but Raf did not. Mutation of the CREs reduced PKA regulation significantly (20% reduction) in Neuro2A cells but the mutation did not alter regulation by PKG.
We next sought to determine whether the CREB protein and PKA phosphorylation of CREB could mediate the regulation seen with the I1 CRE sequences. For this purpose, we used the F9 teratocarcinoma cells which do not express a functional CREB protein [19]. F9 cells were transfected first with the I1-c-fos construct (see Fig 4C for construct) to determine if the I1 sequence was functional in F9 cells. As shown in Fig 5C, PKA stimulated the I1-c-fos reporter when the expression vector for the CREB protein was co-transfected. Furthermore, expression of a CREB mutant in which Ser133 was mutated to Ala abrogated this response suggesting PKA phosphorylation of this residue was required for the transcriptional regulation of I1 by PKA (Fig. 5C). In a second set of experiments (Fig. 5D), we assayed the 2.2 kb c-fos reporter containing the I1 sequence within its intronic context. PKA cotransfection with the CREB expression vector increased transcription of this reporter two-fold and this induction by PKA was reduced to 1.3 fold when the two I1 CRE sequences were mutated. The majority of the PKA induction required Ser133 phosphorylation because the PKA induction was greatly reduced when the Ser133Ala form of CREB was co-transfected with the 2.2kb c-fos reporter construct. These results strongly implicate CREB and CREB phosphorylation by PKA in the regulation of c-fos transcription by the I1 sequence.
Discussion
CNSs are commonly characterized using tissue-specific reporter expression during embryonic development [2; 20; 21]. However, they are less commonly characterized with respect to acute regulation by specific signaling pathways. We had previously used STEP cotransfection to compare PKA regulation of well characterized CRE containing reporters in different cell types and demonstrated that transcriptional regulation could be detected in this microarray format [12]. In the current study, we used STEP transfection to functionally characterize CNSs for the c-fos, EGR1 and JunB IEGs.
Our microarray transfection results for these CNSs suggest that many of these sequences functionally regulate the EGFP reporters used in STEP transfection (Table 1). While many of the CNS sequences caused increases in GFP expression, there was significant repression seen as well. Several of the repressive interactions were seen with constitutive expression of Ras and Raf, both proteins signaling in the MAPK pathway. Ras has been shown to down-regulate the expression of a number of genes [22] and one mechanism for this down-regulation is the methylation of specific promoter sequences via activation of the Dnmt methyl transferase.
In addition to the c-fos I1 intronic sequence characterized in detail here, the c-fos U3 CNS was shown to be regulated by PKA in HEK cells (Figs. 2A and 3A). The c-fos U3 CNS does not contain a CREB-like sequence, so the mechanism of transcriptional regulation is likely to be distinct from that of the I1 sequence. The c-fos U3 CNS does however contain a putative C/EBPα binding and PKA has been shown to alter C/EBPα activity at several distinct levels. In the case of the glucose-6-phosphatase promoter, a distal C/EBPα binding site like that in the c-fos U3 CNS has been shown to interact with a proximal CREB-binding site like that in the c-fos promoter and this interaction is regulated by PKA [23]. In Aplysia, a heterodimer between C/EBP and CREB forms and PKA phosphorylation of a specific serine residue enhances formation of this heterodimer [24].
The c-fos I1 CNS was chosen for a detailed characterization because intronic regulatory elements are not generally well understood. A 374 bp CNS within the second intron of the human nestin gene has been demonstrated to be responsible neural progenitor cell expression during development [25; 26]. Within the first intron of the mouse acetylcholinesterase gene, a CNS containing N-box elements which bind the transcription factor GABP mediates the enhancement of acetylcholinesterase expression following muscle contraction [27]. Two CNSs within the second intron of the human BRCA1 gene contribute to transcription of that gene and the effects of these CNSs are promoter specific [28], similar to the specificity shown for the c-fos I1 sequence. Although mutation and deletion analysis demonstrated the requirement of the CRE sequences within the c-fos I1 CNS for regulation by PKA, deletion analysis of the I1 CNS also suggested a cooperation between the more 5′ sequences containing predicted SP1 binding sites and the two CREs near the 3′ end of the gene. Since cAMP has been shown to regulate SP1 element activity [29] it is possible that at least some of PKA regulation occurs through the SP1 binding sequences of the I1 element.
While PKG shares similar in vitro substrate specificity with PKA, in vivo transcriptional regulation differs for these two kinases [14; 30]. Our current results showed that these two kinases regulated many of the same CNS reporters, but that they showed differences in efficacy. For example, PKA and PKG both showed induction of nearly all c-fos CNS reporter constructs. However, PKA was more effective at regulation of the I1and U3 CNS reporters while PKG was more effective at regulation of the U1U2 and U4U5 reporters in HEK-293T cells (Fig. 3A). Furthermore, in Neuro2A cells these two kinases were equally effective at induction of the I1 c-fos reporter (Fig. 3B). Regulation of the c-fos I1 reporter by both kinases was dependent on the CREs in HEK-293T cells (Fig. 4B and 4D). Regulation of the 2.2 kb c-fos reporter by both PKA and PKG was dependent on intact CREs within intron 1, but PKG regulation in the Neuro2A cells was unaffected by mutation of the CREs suggesting that other regulatory elements mediated PKG regulation of this construct in Neuro2A cells.
Previous studies have demonstrated the importance of the first intron to c-fos gene regulation. First, a transcriptional block site within the first intron was characterized in murine macrophages [17] and shown to be dependent on a 103 bp sequence motif that is not contained in the I1 CNS used in these studies. This 103 bp sequence of the mouse c-fos intron shows lower sequence conservation than the I1 CNS [31]. More recently additional deletion studies suggested that this transcriptional block was required for calcium-dependent resumption of transcription, but deletions of intron 1 which abolished the calcium regulation did not delete the CRE sequences mutated in the I1 CNS sequence [18]. This first intron of the c-fos gene has also been shown to be essential for transcriptional regulation by EGF, TRH and glucose [32; 33]. The regulation by EGF is particularly of interest because our experiments demonstrated that constitutively active Ras was capable of regulating c-fos I1 in Neuro2A cells (Fig. 3B) and Ras is activated by EGF.
Our initial goal was to test the feasibility of using microarray transfection for the identification of novel cis-regulatory elements within CNSs. Our results suggest that such a strategy should identify novel regulatory sequences, although there are certainly caveats to the genome wide application of this strategy. First, the generation of a complete set of CNS reporters would be very labor intensive, although comparable to the effort required for currently existing RNAi libraries. Furthermore, multiple cell types would be required for such a functional genomic analysis of CNS sequences because functional regulation requires the presence of specific transcription factor and in their absence a “false negative” result would be obtained. However, the results of such a STEP strategy could be compared with the results of Chip on Chip or Chip-Seq assays to identify chromosomal sequences to which specific transcription factors are bound. In addition, the results of such a genome wide survey subject to the concern that the transiently transfected reporter DNA is not subject to the same chromatin level regulation as that for the endogenous genes so it is likely that a significant number of “false positive” regulatory sequences may be identified.
In summary, these studies were initiated to determine whether an unbiased high throughput screening method such as microarray transfection could be employed to discover novel transcriptional regulatory elements. Our results suggest that microarray cotransfection of CNS reporter constructs with expression vectors for constitutively active signaling proteins can be used to characterize regulatory interactions that are novel and significant. Specifically, we obtained evidence to suggest that a highly conserved intronic element within the first intron of the c-fos gene is a physiologically significant mechanism for PKA regulation of c-fos gene expression.
Materials and Methods
CNS and promoter sequence identification
Because they were the first completed mammalian genomic sequences, human and mouse genomic sequences were aligned using the VISTA analysis program (http://pipeline.lbl.gov) ([34; 35]) and the UCSC Genome Browser (http://genome.ucsc.edu) [36]. Sequences showing greater than 75% conservation over 200 bp within 10 kb of the transcriptional start sites were designated as CNSs and identified for the human c-fos, JunB and EGR-1 genes (see Supplementary Table 1). Promoter regions were identified using the transcriptional start sites reported previously for the human c-fos [37], JunB [38] and EGR1 [39] genes. Transcription factor binding sites were predicted using the Transcription Element Search System (TESS) [40] and DNA Binding Database (DBD) [4] resources.
PCR amplification and EGFP reporter construction
Oligonucleotides used to amplify the CNSs and the three IEG gene promoters are shown in Supplementary Table 2. Human genomic DNA was used as DNA template (Clontech) and oligonucleotides were obtained from Invitrogen. The c-fos promoter was inserted between EcoRI and BamHI site of pEGFP-1 (Clontech) to generate ppc-fos-EGFP. The CNSs of c-fos gene were then inserted between HindIII and EcoRI sites of ppc-fos-EGFP. The EGR1 promoter was inserted into pEGFP-1 between EcoRI and AgeI sites to generate the plasmid ppEGR1-EGFP. The CNSs of EGR1 were then inserted into the ppEGR1-EGFP between the XhoI and EcoRI sites. Finally, the JunB promoter was inserted between EcoRI and BamHI sites of pEGFP-1 to generate ppJunB-EGFP and the CNSs of JunB were inserted into between HindIII and EcoRI site of ppJunB-EGFP.
The oligonucleotides used to amplify the various 5′ deletions and 3′ deletion of the first intron (designated I1) of c-fos as well as the reverse orientation I1 reporter are shown in Supplementary Table 3. The mutations of the two CREs within I1 were introduced by site-directed mutagenesis as described [14] using the oligonucleotides whose sequences are available on request. The I1 and I1 mutant sequence were used as DNA template to amplify 5′ progressive-deletions. I1 mutants and 5′ deletions were inserted between HindIII and EcoRI into ppc-fos-EGFP.
PCR amplification and luciferase reporter construction
The oligonucleotides used to amplify a 2.2kb fragment containing the promoter, first exon and first intron of the c-fos gene are shown in Supplementary Table 4. This 2.2 kb fragment and its mutants were inserted into pTAL-luciferase (Clontech) between SacI and NcoI site. These reporter constructs produce a spliced transcript that encodes a fusion protein containing the first 56 amino acids of the c-fos gene fused to the amino terminus of the firefly luciferase gene. The c-fos promoter region from ppc-fos-EGFP above was isolated as a SacI/BamHI fragment and inserted into SacI/BglII digested pTAL-luciferase. The I1 CNS and I1 mutant sequences along with c-fos promoter were also isolated from corresponding EGFP reporter constructs as Sac/BamHI fragments and inserted into pTal-lLuc between SacI and BglII sites. All of the reporter constructs were verified by DNA sequencing (University of Michigan DNA sequencing facility). Restriction enzymes were obtained from New England Biolabs and the ligation reagents were from Promega. The pRL-SV40 plasmid with the SV40 promoter directing expression of the Renilla luciferase was used as in internal standard in Hek293T and Neuro2A cell transfections. The pRL-US2 plasmid containing the Ubiquitin C promoter driving expression of the renilla luciferase was constructed by isolating the 1.3 kb BglII/XbaI fragment of pUS2 (the gift of Dr. David Turner) and ligation into BglII/NheI digested SV40RL (Promega).
Constitutively Active Signaling Vectors and STEP transfection
The expression vectors for the Cα catalytic subunit of PKA [14], the K72M kinase deficient mutant of Cα [41], the S79D mutant of the type I PKG [14], the RasV12 mutant [16] and the RafCAAX mutant [15] have been described previously. The CMV. Neo control expression vector has also been described [42]. The STEP transfection method was described in detail previously [12]. Typically, 3 μl of total transfected plasmid DNA at a concentration of 0.12 μg/ul was complexed with 3 μl Lipofectamine 2000 (1 mg/ml, Invitrogen), 3 μl adenoviral penton protein (0.02 mg/ml) and 1 μl 25% glycerol to form 10 ul of STEP complex solution. As reported previously, the optimal percentage of reporter construct was 90–95% of the total transfected DNA [12]. The STEP complexes were then loaded into 384-well plates (Genetix, Hampshire, United Kingdom) and printed onto poly-D-Lysine coated slides (Electron, Microscopy Science, Hatfield, PA) using a Microgrid II microarrayer (San Carlos, CA). Exponentially growing HEK-293T or Neuro2A neuroblastoma cells were then plated onto the slides as described [12] and transfection efficiencies were 50–80% as reported previously [12]. Variability in fluorescence signal from the HEK-293T cells was largely due to detachment of the cells during fixation and handling. Cellular fluorescence levels from HEK-293T cells were typically 5–10 fold higher than Neuro2A cells. The fluorescence signal from living cells was monitored using an inverted Olympus IX70 fluorescence microscope, an IIIix CCD image system and MicroComputer Image Device software (Imaging Research, Inc., St Catherines, Ontario, Canada). Slides were also fixed in 100% methanol (at −20°C) and then scanned using a CCD camera scanner (Array Worx”e”; Applied Precision, Issaquah, WA). Fluorescence intensity was then determined and analyzed using Digital Genome software (Applied Precision). Quantitative results obtained from fluorescence microscopy or slide scanning were comparable for all experiments shown although fluorescence microscopy was more sensitive.
Solution transfection and dual luciferase assay
Human HEK-293T cells, and mouse Neuro2A neuroblastoma or F9 teratocarcinoma cells were cultured in DMEM containing 10% FCS in 24-well plates. Transfection was performed when cells reached 50% confluency. Cells had been serum starved in DMEM containing 1% FCS for 12 hours before transfection to reduce basal expression of the reporters. Solution transfection was performed using Lipofectamine 2000 (Invitrogen) and followed the procedure recommended by the manufacturer using 0.64 μg DNA and 4.8 μl of lipofectamine 2000 (1 mg/ml) for each well. At 24 h after transfection, relative luciferase activity was determined by using a dual luciferase reporter assay kit (Promega) according to the manufacturer’s recommendation, using either a OPTOCOMP I luminometer (MGM INC, Hamdan, CT) or Fluostar OPTIMA plate reader (BMG).
Statistical Analysis
Results are expressed as the mean ± SD or SE and results are representative of at least three independent experiments. Statistical significance was determined by two-tailed Student’s t-test and a value of p<0.05 was considered significant.
Supplementary Material
Acknowledgments
The authors would like to acknowledge the assistance of Daniel Harrington in the isolation of many of the CNS fragments. They would also like to thank Drs. Robert Thompson, Stephen Fisher, Anne Heacock and Holly Huang for critical review of the manuscript. This work was supported by award NS051472 from the National Institutes of Health to MDU. Potential conflicts of interest between these NIH sponsored research activities and activities related to Originus, Inc., are managed by the University of Michigan Medical School Conflict of Interest Committee.
Footnotes
Publisher's Disclaimer: This is a PDF file of an unedited manuscript that has been accepted for publication. As a service to our customers we are providing this early version of the manuscript. The manuscript will undergo copyediting, typesetting, and review of the resulting proof before it is published in its final citable form. Please note that during the production process errors may be discovered which could affect the content, and all legal disclaimers that apply to the journal pertain.
References
- 1.Dermitzakis ET, Reymond A, Antonarakis SE. Conserved non-genic sequences - an unexpected feature of mammalian genomes. Nat Rev Genet. 2005;6:151–7. doi: 10.1038/nrg1527. [DOI] [PubMed] [Google Scholar]
- 2.Pennacchio LA, Ahituv N, Moses AM, Prabhakar S, Nobrega MA, Shoukry M, Minovitsky S, Dubchak I, Holt A, Lewis KD, Plajzer-Frick I, Akiyama J, De Val S, Afzal V, Black BL, Couronne O, Eisen MB, Visel A, Rubin EM. In vivo enhancer analysis of human conserved non-coding sequences. Nature. 2006;444:499–502. doi: 10.1038/nature05295. [DOI] [PubMed] [Google Scholar]
- 3.Halfon MS, Gallo SM, Bergman CM. REDfly 2.0: an integrated database of cis-regulatory modules and transcription factor binding sites in Drosophila. Nucleic Acids Res. 2008;36:D594–8. doi: 10.1093/nar/gkm876. [DOI] [PMC free article] [PubMed] [Google Scholar]
- 4.Wilson D, Charoensawan V, Kummerfeld SK, Teichmann SA. DBD--taxonomically broad transcription factor predictions: new content and functionality. Nucleic Acids Res. 2008;36:D88–92. doi: 10.1093/nar/gkm964. [DOI] [PMC free article] [PubMed] [Google Scholar]
- 5.Zhang X, Odom DT, Koo SH, Conkright MD, Canettieri G, Best J, Chen H, Jenner R, Herbolsheimer E, Jacobsen E, Kadam S, Ecker JR, Emerson B, Hogenesch JB, Unterman T, Young RA, Montminy M. Genome-wide analysis of cAMP-response element binding protein occupancy, phosphorylation, and target gene activation in human tissues. Proc Natl Acad Sci U S A. 2005;102:4459–64. doi: 10.1073/pnas.0501076102. [DOI] [PMC free article] [PubMed] [Google Scholar]
- 6.Bernstein BE, Meissner A, Lander ES. The mammalian epigenome. Cell. 2007;128:669–81. doi: 10.1016/j.cell.2007.01.033. [DOI] [PubMed] [Google Scholar]
- 7.Li B, Carey M, Workman JL. The role of chromatin during transcription. Cell. 2007;128:707–19. doi: 10.1016/j.cell.2007.01.015. [DOI] [PubMed] [Google Scholar]
- 8.Herschman HR. Primary response genes induced by growth factors and tumor promoters. Annu Rev Biochem. 1991;60:281–319. doi: 10.1146/annurev.bi.60.070191.001433. [DOI] [PubMed] [Google Scholar]
- 9.Tullai JW, Schaffer ME, Mullenbrock S, Sholder G, Kasif S, Cooper GM. Immediate-early and delayed primary response genes are distinct in function and genomic architecture. J Biol Chem. 2007;282:23981–95. doi: 10.1074/jbc.M702044200. [DOI] [PMC free article] [PubMed] [Google Scholar]
- 10.Tian L, Wang P, Guo J, Wang X, Deng W, Zhang C, Fu D, Gao X, Shi T, Ma D. Screening for novel human genes associated with CRE pathway activation with cell microarray. Genomics. 2007;90:28–34. doi: 10.1016/j.ygeno.2007.02.004. [DOI] [PubMed] [Google Scholar]
- 11.Silva JM, Mizuno H, Brady A, Lucito R, Hannon GJ. RNA interference microarrays: high-throughput loss-of-function genetics in mammalian cells. Proc Natl Acad Sci U S A. 2004;101:6548–52. doi: 10.1073/pnas.0400165101. [DOI] [PMC free article] [PubMed] [Google Scholar]
- 12.Redmond TM, Ren X, Kubish G, Atkins S, Low S, Uhler MD. Microarray transfection analysis of transcriptional regulation by cAMP-dependent protein kinase. Mol Cell Proteomics. 2004;3:770–9. doi: 10.1074/mcp.M400018-MCP200. [DOI] [PubMed] [Google Scholar]
- 13.Leinninger GM, Backus C, Uhler MD, Lentz SI, Feldman EL. Phosphatidylinositol 3-kinase and Akt effectors mediate insulin-like growth factor-I neuroprotection in dorsal root ganglia neurons. FASEB J. 2004;18:1544–6. doi: 10.1096/fj.04-1581fje. [DOI] [PubMed] [Google Scholar]
- 14.Collins SP, Uhler MD. Cyclic AMP- and cyclic GMP-dependent protein kinases differ in their regulation of cyclic AMP response element-dependent gene transcription. J Biol Chem. 1999;274:8391–404. doi: 10.1074/jbc.274.13.8391. [DOI] [PubMed] [Google Scholar]
- 15.Stokoe D, Macdonald SG, Cadwallader K, Symons M, Hancock JF. Activation of Raf as a result of recruitment to the plasma membrane. Science. 1994;264:1463–7. doi: 10.1126/science.7811320. [DOI] [PubMed] [Google Scholar]
- 16.Katz ME, McCormick F. Signal transduction from multiple Ras effectors. Curr Opin Genet Dev. 1997;7:75–9. doi: 10.1016/s0959-437x(97)80112-8. [DOI] [PubMed] [Google Scholar]
- 17.Collart MA, Tourkine N, Belin D, Vassalli P, Jeanteur P, Blanchard JM. c-fos gene transcription in murine macrophages is modulated by a calcium-dependent block to elongation in intron 1. Mol Cell Biol. 1991;11:2826–31. doi: 10.1128/mcb.11.5.2826. [DOI] [PMC free article] [PubMed] [Google Scholar]
- 18.Coulon V, Veyrune JL, Tourkine N, Vie A, Hipskind RA, Blanchard JM. A novel calcium signaling pathway targets the c-fos intragenic transcriptional pausing site. J Biol Chem. 1999;274:30439–46. doi: 10.1074/jbc.274.43.30439. [DOI] [PubMed] [Google Scholar]
- 19.Gonzalez GA, Menzel P, Leonard J, Fischer WH, Montminy MR. Characterization of motifs which are critical for activity of the cyclic AMP-responsive transcription factor CREB. Mol Cell Biol. 1991;11:1306–12. doi: 10.1128/mcb.11.3.1306. [DOI] [PMC free article] [PubMed] [Google Scholar]
- 20.Shin JT, Priest JR, Ovcharenko I, Ronco A, Moore RK, Burns CG, MacRae CA. Human-zebrafish non-coding conserved elements act in vivo to regulate transcription. Nucleic Acids Res. 2005;33:5437–45. doi: 10.1093/nar/gki853. [DOI] [PMC free article] [PubMed] [Google Scholar]
- 21.Visel A, Prabhakar S, Akiyama JA, Shoukry M, Lewis KD, Holt A, Plajzer-Frick I, Afzal V, Rubin EM, Pennacchio LA. Ultraconservation identifies a small subset of extremely constrained developmental enhancers. Nat Genet. 2008;40:158–60. doi: 10.1038/ng.2007.55. [DOI] [PMC free article] [PubMed] [Google Scholar]
- 22.Ordway JM, Williams K, Curran T. Transcription repression in oncogenic transformation: common targets of epigenetic repression in cells transformed by Fos, Ras or Dnmt1. Oncogene. 2004;23:3737–48. doi: 10.1038/sj.onc.1207483. [DOI] [PubMed] [Google Scholar]
- 23.Gautier-Stein A, Mithieux G, Rajas F. A distal region involving hepatocyte nuclear factor 4alpha and CAAT/enhancer binding protein markedly potentiates the protein kinase A stimulation of the glucose-6-phosphatase promoter. Mol Endocrinol. 2005;19:163–74. doi: 10.1210/me.2004-0105. [DOI] [PubMed] [Google Scholar]
- 24.Lee JA, Lee SH, Lee C, Chang DJ, Lee Y, Kim H, Cheang YH, Ko HG, Lee YS, Jun H, Bartsch D, Kandel ER, Kaang BK. PKA-activated ApAF-ApC/EBP heterodimer is a key downstream effector of ApCREB and is necessary and sufficient for the consolidation of long-term facilitation. J Cell Biol. 2006;174:827–38. doi: 10.1083/jcb.200512066. [DOI] [PMC free article] [PubMed] [Google Scholar]
- 25.Lothian C, Prakash N, Lendahl U, Wahlstrom GM. Identification of both general and region-specific embryonic CNS enhancer elements in the nestin promoter. Exp Cell Res. 1999;248:509–19. doi: 10.1006/excr.1999.4417. [DOI] [PubMed] [Google Scholar]
- 26.Zimmerman L, Parr B, Lendahl U, Cunningham M, McKay R, Gavin B, Mann J, Vassileva G, McMahon A. Independent regulatory elements in the nestin gene direct transgene expression to neural stem cells or muscle precursors. Neuron. 1994;12:11–24. doi: 10.1016/0896-6273(94)90148-1. [DOI] [PubMed] [Google Scholar]
- 27.Cohen TV, Randall WR. The regulation of acetylcholinesterase by cis-elements within intron I in cultured contracting myotubes. J Neurochem. 2006;98:723–34. doi: 10.1111/j.1471-4159.2006.03897.x. [DOI] [PubMed] [Google Scholar]
- 28.Wardrop SL, Brown MA. Identification of two evolutionarily conserved and functional regulatory elements in intron 2 of the human BRCA1 gene. Genomics. 2005;86:316–28. doi: 10.1016/j.ygeno.2005.05.006. [DOI] [PubMed] [Google Scholar]
- 29.Sellak H, Yang X, Cao X, Cornwell T, Soff GA, Lincoln T. Sp1 transcription factor as a molecular target for nitric oxide-- and cyclic nucleotide--mediated suppression of cGMP-dependent protein kinase-Ialpha expression in vascular smooth muscle cells. Circ Res. 2002;90:405–12. doi: 10.1161/hh0402.105898. [DOI] [PubMed] [Google Scholar]
- 30.Pilz RB, Casteel DE. Regulation of gene expression by cyclic GMP. Circ Res. 2003;93:1034–46. doi: 10.1161/01.RES.0000103311.52853.48. [DOI] [PubMed] [Google Scholar]
- 31.Mechti N, Piechaczyk M, Blanchard JM, Jeanteur P, Lebleu B. Sequence requirements for premature transcription arrest within the first intron of the mouse c-fos gene. Mol Cell Biol. 1991;11:2832–41. doi: 10.1128/mcb.11.5.2832. [DOI] [PMC free article] [PubMed] [Google Scholar]
- 32.Susini S, Van Haasteren G, Li S, Prentki M, Schlegel W. Essentiality of intron control in the induction of c-fos by glucose and glucoincretin peptides in INS-1 beta-cells. FASEB J. 2000;14:128–36. [PubMed] [Google Scholar]
- 33.van Haasteren G, Li S, Ryser S, Schlegel W. Essential contribution of intron sequences to Ca(2+)-dependent activation of c-fos transcription in pituitary cells. Neuroendocrinology. 2000;72:368–78. doi: 10.1159/000054606. [DOI] [PubMed] [Google Scholar]
- 34.Dubchak I. Comparative analysis and visualization of genomic sequences using VISTA browser and associated computational tools. Methods Mol Biol. 2007;395:3–16. doi: 10.1007/978-1-59745-514-5_1. [DOI] [PubMed] [Google Scholar]
- 35.Dubchak I, Ryaboy DV. VISTA family of computational tools for comparative analysis of DNA sequences and whole genomes. Methods Mol Biol. 2006;338:69–89. doi: 10.1385/1-59745-097-9:69. [DOI] [PubMed] [Google Scholar]
- 36.Karolchik D, Kuhn RM, Baertsch R, Barber GP, Clawson H, Diekhans M, Giardine B, Harte RA, Hinrichs AS, Hsu F, Kober KM, Miller W, Pedersen JS, Pohl A, Raney BJ, Rhead B, Rosenbloom KR, Smith KE, Stanke M, Thakkapallayil A, Trumbower H, Wang T, Zweig AS, Haussler D, Kent WJ. The UCSC Genome Browser Database: 2008 update. Nucleic Acids Res. 2008;36:D773–9. doi: 10.1093/nar/gkm966. [DOI] [PMC free article] [PubMed] [Google Scholar]
- 37.Sheng M, Dougan ST, McFadden G, Greenberg ME. Calcium and growth factor pathways of c-fos transcriptional activation require distinct upstream regulatory sequences. Mol Cell Biol. 1988;8:2787–96. doi: 10.1128/mcb.8.7.2787. [DOI] [PMC free article] [PubMed] [Google Scholar]
- 38.Berger I, Shaul Y. The human junD gene is positively and selectively autoregulated. DNA Cell Biol. 1994;13:249–55. doi: 10.1089/dna.1994.13.249. [DOI] [PubMed] [Google Scholar]
- 39.Sakamoto KM, Bardeleben C, Yates KE, Raines MA, Golde DW, Gasson JC. 5′ upstream sequence and genomic structure of the human primary response gene, EGR-1/TIS8. Oncogene. 1991;6:867–71. [PubMed] [Google Scholar]
- 40.Schug J. Using TESS to predict transcription factor binding sites in DNA sequence. Curr Protoc Bioinformatics Chapter. 2008;2(Unit 2):6. doi: 10.1002/0471250953.bi0206s21. [DOI] [PubMed] [Google Scholar]
- 41.Brown NA, Stofko RE, Uhler MD. Induction of alkaline phosphatase in mouse L cells by overexpression of the catalytic subunit of cAMP-dependent protein kinase. J Biol Chem. 1990;265:13181–9. [PubMed] [Google Scholar]
- 42.Huggenvik JI, Collard MW, Stofko RE, Seasholtz AF, Uhler MD. Regulation of the human enkephalin promoter by two isoforms of the catalytic subunit of cyclic adenosine 3′,5′-monophosphate-dependent protein kinase. Mol Endocrinol. 1991;5:921–30. doi: 10.1210/mend-5-7-921. [DOI] [PubMed] [Google Scholar]
Associated Data
This section collects any data citations, data availability statements, or supplementary materials included in this article.