

Abstract
We report on a longitudinal study designed to assess possible sex differences in math achievement, math ability, and math-related tasks during the primary school age years. Participants included over 200 children from one public school district. Annual assessments included measures of math ability, math calculation achievement scores, rapid naming and decoding tasks, visual perception tests, visual motor tasks, and reading skills. During select years of the study we also administered tests of counting and math facts skills. We examined whether girls or boys were overrepresented among the bottom or top performers on any of these tasks, relative to their peers, and whether growth rates or predictors of math-related skills differed for boys and girls. Our findings support the notion that sex differences in math are minimal or nonexistent on standardized psychometric tests routinely given in assessments of primary school age children. There was no persistent finding suggesting a male or female advantage in math performance overall, during any single year of the study, or in any one area of math or spatial skills. Growth rates for all skills, and early correlates of later math performance, were comparable for boys and girls. The findings fail to support either persistent or emerging sex differences on non-specialized math ability measures during the primary school age years.
Keywords: Mathematics, Sex differences, Spatial skills, Primary school math
1. Introduction
The relative predominance of men in mathematically intensive careers has been attributed, at least in part, to the reported gender gap in mathematics achievement (National Research Council, 1989). Despite consensus regarding, and concern for, this gender disparity in mathematically oriented careers even among mathematically gifted male and female students (Benbow, Lubinski, Shea, & Eftekhari-Sanjani, 2000), there is much controversy regarding the degree to which this disparity results from inherent vs. culturally influenced sex differences in math ability and performance. The research has been inconsistent in demonstrating whether sex differences in math are valid (e.g., Casey, Nuttall, & Pezaris, 2001; Ginsburg & Russell, 1981; Geary, 1994; Maccoby & Jacklin, 1974), of significant magnitude (e.g., Friedman, 1989; Gonzales et al., 2004; Penner, 2003; Swiatek, Lupkowski-Shoplik, & O'Donoghue, 2000), broad enough to affect overall math performance (e.g., Hyde, Fennema, & Lamon, 1990a), or age-dependent (e.g., Hyde, Fennema, Ryan, Frost, & Hopp, 1990b; Leahey & Guo, 2001; Voyer, Voyer, & Bryden, 1995). The present study was designed to examine boys' and girls' math performance during the primary school age years. Our aim was to assess the early manifestation of possible sex differences in math achievement, math ability, and math-related skills, including reading-related skills and visual spatial ability, on these commonly observed tasks. Although these issues have been examined in the literature to date, the present study contributes to the existing data by virtue of its longitudinal design. This allowed for assessment of growth curves in math skills during the first 4 years of school among a relatively random sample of primary school age children. Of interest is whether sex differences are apparent during the primary school age years overall, whether girls or boys are overrepresented in either the upper or lower quartiles of math performers, whether rates of growth in math-related skills differ for boys and girls, and whether there are potential sex differences in predictors of poor math achievement.
Reports of sex differences can influence beliefs and expectations of gender stereotypes (Brescoll & LaFrance, 2004). Despite the fact that empirical reports of sex differences are predominantly attributed to a limited number of skills, particularly specific higher order tasks observed in later school years or adulthood (e.g., Hyde et al., 1990a; Pratarelli & Steitz, 1995), discussion of sex differences in the media and lay publications may inappropriately lead to expectations for observable sex differences in the context of daily primary school activities. In order to address this notion, in the present study we examined performance on measures reflective of the kinds of tasks observed among primary school children in regular classroom settings.
1.1. Sex differences in math skills
Prior studies have reported conflicting results about the validity of sex differences in math, as reviewed in depth by Hyde et al. (Hyde et al., 1990a). Reports in favor of boys refer to advantages in general math performance (Lummis & Stevenson, 1990; Maccoby & Jacklin, 1974; Mau & Lynn, 2000); while additional findings reflect superior performance on only specific tasks, such as those relying on spatial–mechanical skills (Casey, Nuttall, & Pezaris, 1997; Casey et al., 2001; Gallagher et al., 2000; Geary & DeSoto, 2001; Lummis & Stevenson, 1990). Sex differences in favor of girls are reported at younger ages through preadolescence (Ginsburg & Russell, 1981; Kaplan & Weisberg, 1987; Marshall & Smith, 1987). However, other studies have reported no significant sex differences in math abilities and achievement (Alyman & Peters, 1993; Geary, 1994; Tate, 1997).
In cases where sex differences in math are indicated, the magnitude of these differences correlates with problem difficulty (Bielinski & Davison, 2001; Penner, 2003) and appear more pronounced among groups of low- or high-scoring individuals (Swiatek et al., 2000). Although sex differences increase in magnitude with age, existing sex differences in math are small, and appear to be diminishing over generations (Friedman, 1989; Hyde et al., 1990a). The Trends in International Mathematics and Science Study (TIMSS study, Gonzales et al., 2004) reported a male advantage on general math skills in both fourth and eighth grades in 2003, however effect sizes were small at best (Cohen's d =0.11 and 0.07, respectively), and both boys' and girls' mean scores had increased, by comparable amounts, since 1995. One consistency in the literature is the claim that the magnitude of differences varies with age (Hyde et al., 1990a,b; Leahey & Guo, 2001; Voyer et al., 1995). For example, true sex differences are reported as nonexistent in infancy, minimal in early and later elementary school years, emerging at adolescence, and more consistently reported through adulthood. Studies of infants' mathematical skills typically fail to show sex differences in early skills, such as the ability to discriminate between small sets of numbers (Antell & Keating, 1983; Starkey, Spelke, & Gelman, 1990; Strauss & Curtis, 1981), and in how quantity is affected by addition and subtraction (Starkey, 1992). The understanding of basic numerical concepts is uniform across the sexes, in a variety of cultures, through the preschool and kindergarten years (Geary, 1994). Indeed, few or no sex differences in quantifiable math abilities (i.e., counting skills, conceptual knowledge, or simple arithmetic skills) have been found before first grade (Lummis & Stevenson, 1990). Four- and five-year old girls outperform boys, to minimal degrees, on simple arithmetic skills (Ginsburg & Russell, 1981) but in general there is no clear advantage of one sex over the other at this age.
During the early school years, reports of sex differences in math continue to be inconsistent. Differences are either reported as nonexistent (Geary, 1994), slightly favoring girls (Ginsburg & Russell, 1981) or favoring boys on specific tasks (Lummis & Stevenson, 1990). Lummis & Stevenson (1990) claim that first grade boys demonstrate an advantage over girls in solving word problems and on problems that utilize visualization strategies. In the present study, we examine differences in math and visual spatial performance at four time points during the primary school age years on measures that reflect the types of tasks typically observed in regular classroom settings.
Although our study focuses on the first 4 years of schooling, research on sex differences after primary school years is relevant to the present study because of its implication for potential indicators of emerging sex differences in early childhood. Yet research findings on the late elementary and middle school years are inconsistent. In a longitudinal study of over 7000 children, Marshall & Smith (1987) found no sex differences in third to sixth graders' basic conceptual understanding on arithmetic problems, although the girls outperformed boys due primarily to boys' procedural errors. Yet between elementary and junior high school years, boys surpass girls in their math skills (Leahey & Guo, 2001; Maccoby & Jacklin, 1974). However, studies of math abilities in high school and adulthood typically report sex differences in favor of boys (Gallagher et al., 2000; Leahey & Guo, 2001; Mau & Lynn, 2000).
1.1.1. Sex differences among high achievers
The greatest sex disparities may occur among the highest- and lowest-achieving students (e.g., Benbow, 1992; Carr & Davis, 2001; Hyde et al., 1990a), across all age groups. Leahey and Guo (2001) found that sex differences in math were most pronounced among a subset of high-achieving students from elementary school through high school. Among high-achieving groups, boys outperform girls on math tasks from third to sixth grade (Swiatek et al., 2000) and from eighth grade to post-high school (Reis & Park, 2001). Boys have a slight advantage on easy math problems, and a greater advantage on more difficult math problems, with problem difficulty defined by the percentage of incorrect answers across the population (i.e., easy problems are those with a low percentage of incorrect answers; Penner, 2003). Benbow (1992) reports that males outnumber females in both high ability and low ability groups in mathematics from adolescence through adulthood, although the differences are more pronounced in the higher achievement groups. Based on these findings, in the present study we examine differences not only in overall group means using analysis of variance tests but also in the frequency with which males or females are represented in the highest and lowest achievement groups using odds ratios. While the ANOVA tests for the level of variance within and between groups (boys and girls) from the mean, it does not directly address the level of variation among the extremes (highest and lowest achievers), which is of interest given the above findings. For this reason, we use odds ratios to consider the frequencies of participation in these groups.
1.2. Sex differences in spatial skills
Some aspects of mathematics are believed to have a spatial component (e.g., as reviewed by Fias & Fischer, 2005), and correlations between math and visual spatial skills have been reported in early grades (Kulp, 1999; Kurdek & Sinclair, 2001; Mazzocco & Myers, 2003). The shift toward male superiority in math, in higher grades, has been attributed in part to an increasing reliance on spatially based strategies, which boys are alleged to use more often (Benbow, 1988; Casey et al., 2001; Maccoby & Jacklin, 1974). This notion is somewhat controversial, as it has not been supported in all studies, such as in Manger and Eikeland's (1998) study of sixth graders' mathematics and spatial visualization skills.
Comparable to findings on math skills, studies on sex differences for spatial abilities across the lifespan have yielded inconsistent findings. Levine, Huttenlocher, Taylor, and Langrock (1999) report a difference in favor of boys, at 4 years of age, on both rotation and translation skills. Kaplan and Weisberg (1987) found that third-grade girls performed significantly better than boys on tasks involving recognition of embedded figures. Vasta, Regan, and Kerley (1980) found no significant sex differences among 10-year olds on fine motor and gross motor skills, consistent with Manger and Eikeland's (1998) report of no sex differences among sixth graders on spatial visualization tasks. As noted by Voyer, Voyer, and Bryden (1995), sex differences on spatial tasks do not appear at one age, rather, they emerge on different tasks at different preadolescent and adolescent ages, and their magnitude increases with age. In contrast to this notion, Johnson and Meade (1987) report a consistent male advantage on spatial performance starting at age 10 years and continuing through age 18. In adulthood, studies typically report more consistent findings of a male advantage on spatial cognition and ability measures (Geary, Saults, Liu, & Hoard, 2000), with the largest discrepancy in favor of men on mental rotation skills (Crucian & Berenbaum, 1998; Geary, Gilger, & Elliott-Miller, 1990; Voyer et al., 1995). Indeed, some argue that the spatial superiority reported for males is limited to very specific tasks, such as mental rotation tasks and location learning in young adults (Astur, Oritz, & Sutherland, 1998). This means that sex differences may not be apparent on global tests of general spatial abilities, as Alyman and Peters (1993) have reported in their cross sectional study of spatial abilities using everyday prompts, from childhood to adulthood.
Thus the range of spatial skills used across studies is broad in terms of both the nature and complexity of skills required for success, which contributes to the inconsistency across findings. In the present study, we use a variety of spatial tasks limited to those commonly used in primary school activities or assessments. If spatial aspects of mathematics underlie some of the sex differences reported for math ability, it will be useful to assess whether rates of growth in spatial abilities differ for boys and girls.
1.3. Correlates of math performance
Studies have highlighted the interplay between both spatial and verbal skills and mathematics achievement across multiple school grades. For example, reading-related skills are as correlated with math achievement as are visual spatial skills, at least during the primary school age years, as both concurrent (Mazzocco & Myers, 2003) and predictive factors (Kurdek & Sinclair, 2001). Auditory memory number skills and visual discrimination skills in kindergarten together predict variability in mathematics achievement in fourth grade (Kurdek & Sinclair, 2001). Both geometry grades and SAT–Verbal performance are strong predictors of SAT–Math achievement in college-bound students (Casey et al., 1997). In the present study, we examine both verbal and spatial correlates of math performance, and whether the presence or strength of these associations varies between primary school age boys and girls.
1.4. Rationale for the present study
If it is true that sex differences in math and spatial skills are most apparent during middle or high school, there are three possibilities related to the emergence of these differences that together motivated the present study of primary school age children. The first possibility is that primary school age girls do not have any inherent difficulty with math or spatial skills, consistent with reports of no sex differences before seventh grade (e.g., Marshall & Smith, 1987; Vasta et al., 1980). An alternative possibility is that the differences that do exist are subtle, or limited to specific skills not commonly measured at younger ages and thus not as readily apparent, even if studied empirically. This notion is consistent with reports of sex differences with small effect sizes such as those reported by Manger and Eikeland (1998) and Hyde et al. (1990a). The third possibility is that significant sex differences do exist, but have not been sufficiently examined. We address these possibilities, through a longitudinal study of over 200 children seen four times during their primary school age years.
In the present study, we sought to assess whether sex differences are evident during the primary school age years. Based on existing findings, we hypothesized that differences to emerge would have relatively small effect sizes. We examined whether there would be significantly more (or fewer) boys among the weakest or strongest math performers. To address the notion that male superiority in math emerges over time, we examined whether sex differences become more apparent over time, in the same group of children seen over 4 years; and whether growth rates for math and spatial skills are slower for girls. It is possible that sex differences in primary school age children are too subtle to be detected cross-sectionally and that growth rates may demonstrate significant differences. Finally, we explored whether the association between early and later math scores differs for boys vs. girls, using measures of skills commonly assessed during the primary school age years.
2. Method
2.1. Participants
Participants were primary school students from a large suburban public school district who had enrolled in the longitudinal study while in kindergarten. Recruitment was carried out in seven participating schools, as described elsewhere in detail (Mazzocco & Myers, 2002). All kindergartners at those schools were invited to participate, except children with mental retardation or limited English proficiency. Across schools, 66.67% of eligible participants enrolled, resulting in 249 students (120 boys) in the initial sample. See Table 1 for demographic data on these participants and for attrition rates over the course of the longitudinal study.
Table 1.
Demographics
| Boys | Girls | |||||
|---|---|---|---|---|---|---|
| n | Mean | (SD) | n | Mean | (SD) | |
| Age (years) at time of testing | ||||||
| Kindergarten | 120 | 5.83 | (0.35) | 129 | 5.72 | (0.33) |
| Grade 1 | 114 | 6.83 | (0.34) | 122 | 6.69 | (0.30) |
| Grade 2 | 110 | 7.84 | (0.35) | 114 | 7.69 | (0.31) |
| Grade 3 | 104 | 8.73 | (0.30) | 110 | 8.61 | (0.32) |
| Race: percent Caucasian using grade 1 data | 89% | 83% | ||||
2.2. Measures
The measures were tests administered during one or more years of the 4-year study, as listed in Table 2. We administered an IQ test for descriptive purposes, whereas measures of mathematics ability, mathematics achievement, and spatial ability were administered to obtain the primary dependent variables of interest. Although reading skills were not of primary interest, we administered measures of reading-related abilities because of evidence that math difficulties co-occur with reading difficulties (e.g., Geary, 1993, Jordan et al., 2003, Russell & Ginsburg, 1984). The reading, spatial, and math tasks included a combination of published standardized tests and experimental measures. From each measure, we obtained raw scores (number correct), and for the standardized measures we obtained both raw scores and age-referenced standard scores.
Table 2.
Means, standard deviations, and effect sizes, broken down by sex and grade
| Measure | Boys | Girls | Effect size – Cohen's d | |||||||||||
|---|---|---|---|---|---|---|---|---|---|---|---|---|---|---|
| Kindergarten | Grade 1 | Grade 2 | Grade 3 | Kindergarten | Grade 1 | Grade 2 | Grade 3 | Kindergarten | Grade 1 | Grade 2 | Grade 3 | |||
| Mean (SD) |
Mean (SD) |
Mean (SD) |
Mean (SD) |
Mean (SD) |
Mean (SD) |
Mean (SD) |
Mean (SD) |
d | d | d | d | |||
| Reading measures | ||||||||||||||
| WJ-R | ||||||||||||||
| LWID | 97.74 (12.66) |
107.60 (13.81) |
112.46 (14.58) |
109.33 (14.03) |
104.20 (11.39) |
115.42 (12.87) |
119.83 (14.64) |
116.46 (14.00) |
0.54 | 0.61 | 0.51 | 0.51 | ||
| WA | 98.65 (12.03) |
106.44 (13.70) |
111.51 (14.16) |
108.95 (14.18) |
100.75 (10.26) |
110.58 (10.59) |
114.74 (12.75) |
110.32 (13.04) |
0.19 | 0.34 | 0.24 | 0.10 | ||
| RAN | ||||||||||||||
| Objects | 85.99 (23.16) |
71.74 (16.14) |
– – |
– – |
87.52 (27.02) |
69.87 (16.35) |
– – |
– – |
0.06 | 0.12 | – | – | ||
| Colors | 65.57 (15.41) |
53.59 (12.51) |
47.56 (8.69) |
43.17 (7.77) |
61.27 (13.00) |
49.88 (10.35) |
45.46 (8.87) |
40.92 (6.68) |
0.30 | 0.33 | 0.24 | 0.31 | ||
| Numbers | 58.99 (17.69) |
39.52 (9.13) |
33.15 (6.77) |
29.21 (5.63) |
58.66 (16.51) |
39.93 (8.03) |
32.41 (6.00) |
28.31 (4.72) |
0.02 | 0.05 | 0.12 | 0.18 | ||
| Letters | 67.11 (25.07) |
38.10 (8.83) |
31.01 (6.20) |
28.61 (5.80) |
61.23 (19.37) |
36.22 (7.60) |
31.00 (6.42) |
27.98 (4.55) |
0.27 | 0.23 | 0.00 | 0.12 | ||
| Reading fluency | – | |||||||||||||
| Reaction time | – – |
– – |
– – |
123.45 (61.31) |
– – |
– – |
– – |
107.01 (38.16) |
– | – | – | 0.33 | ||
| Errors | – – |
– – |
– – |
6.89 (3.07) |
– – |
– – |
– – |
6.15 (2.75) |
– | – | – | 0.26 | ||
| Measures of visual spatial skills | ||||||||||||||
| DTVP | ||||||||||||||
| Position in space | 9.22 (2.24) |
9.75 (2.66) |
9.73 (2.89) |
10.56 (2.59) |
9.67 (2.33) |
10.03 (2.95) |
10.05 (2.76) |
10.62 (2.52) |
0.02 | 0.10 | 0.11 | 0.02 | ||
| Figure-ground | 9.21 (3.09) |
9.29 (3.05) |
9.45 (2.89) |
9.49 (3.21) |
9.68 (2.65) |
10.91 (2.93) |
10.32 (3.00) |
10.92 (2.37) |
0.16 | 0.54 | 0.30 | 0.51 | ||
| Visual closure | 7.22 (2.23) |
8.37 (3.89) |
9.77 (4.26) |
11.13 (4.20) |
7.69 (2.10) |
8.71 (4.00) |
9.98 (4.19) |
11.19 (4.04) |
0.22 | 0.09 | 0.05 | 0.01 | ||
| Form constancy | 10.99 (1.28) |
10.23 (2.38) |
11.12 (2.77) |
11.28 (2.67) |
11.26 (1.20) |
10.47 (2.04) |
11.25 (2.98) |
11.82 (2.97) |
0.22 | 0.11 | 0.05 | 0.19 | ||
| VMI | ||||||||||||||
| Overall | 93.22 (10.44) |
96.56 (10.99) |
94.44 (8.59) |
94.36 (10.85) |
98.08 (11.17) |
98.24 (10.69) |
97.13 (8.83) |
96.68 (9.33) |
0.45 | 0.16 | 0.31 | 0.23 | ||
| Motor subtest | – – |
96.61 (9.62) |
– – |
– – |
– – |
101.24 (10.23) |
– – |
– – |
– | 0.47 | – | – | ||
| Visual subtest | – | 105.93 (16.34) |
– – |
– – |
– – |
107.23 (17.15) |
– – |
– – |
– | 0.08 | – | – | ||
| Math measures | ||||||||||||||
| TEMA-2 | 100.72 (15.89) |
107.42 (15.57) |
112.11 (16.96) |
112.60 (17.05) |
100.92 (11.44) |
104.85 (10.45) |
108.48 (13.75) |
111.95 (14.16) |
0.01 | 0.20 | 0.24 | 0.04 | ||
| Keymath revised | ||||||||||||||
| Numeration | 11.34 (3.13) |
12.30 (2.59) |
13.17 (2.66) |
– – |
11.35 (2.20) |
11.97 (1.87) |
12.60 (2.13) |
– – |
0.00 | 0.15 | 0.24 | – | ||
| Geometry | 13.07 (3.36) |
13.03 (3.20) |
12.82 (3.20) |
– – |
14.28 (3.33) |
14.42 (2.89) |
14.02 (2.61) |
– – |
0.37 | 0.46 | 0.41 | – | ||
| Addition (raw) | 3.18 (1.78) |
6.11 (2.17) |
8.69 (2.17) |
– – |
2.96 (1.39) |
5.80 (1.58) |
8.66 (2.30) |
– – |
0.14 | 0.17 | 0.01 | – | ||
| Subtraction (raw) | 1.32 (0.94) |
3.94 (2.02) |
6.77 (2.04) |
– – |
1.24 (0.75) |
3.57 (1.80) |
6.53 (1.84) |
– | 0.09 | 0.19 | 0.12 | – | ||
| Measurement | 11.95 (2.95) |
13.05 (2.80) |
12.64 (2.50) |
– – |
12.71 (2.86) |
12.86 (2.08) |
12.24 (1.99) |
– – |
0.26 | 0.08 | 0.18 | – | ||
| Math measures | ||||||||||||||
| Time and money (raw) | – – |
5.07 (2.99) |
10.20 (4.18) |
– – |
– – |
4.34 (1.92) |
9.40 (3.30) |
– – |
– | 0.29 | 0.22 | – | ||
| WJ-R calculation | 93.64 (15.64) |
107.05 (15.32) |
– – |
107.78 (19.23) |
93.63 (14.14) |
108.38 (13.07) |
– – |
110.26 (16.72) |
0.00 | 0.09 | – | 0.14 | ||
| Counting trials | – – |
0.85 (0.15) |
0.91 (0.09) |
– – |
– – |
0.86 (0.14) |
0.92 (0.09) |
– – |
– | 0.02 | 0.16 | – | ||
| Math facts | – – |
– – |
23.60 (1.05) |
– – |
– – |
– – |
23.82 (0.49) |
– – |
– | – | 0.27 | – | ||
2.2.1. Descriptive measure: Wechsler abbreviated scale of intelligence (WASI)
The WASI (Wechsler, 1999), an abbreviated standardized measure used to assess overall cognitive ability, was administered as a descriptive measure. The WASI includes two verbal subtests (vocabulary and similarities) and two nonverbal subtests (block design and matrix reasoning) used to derive an age-referenced full scale IQ score based on a mean of 100 and a standard deviation (SD) of 15. We administered the WASI one time, when participants were in third grade. We obtained IQ scores during third grade rather than sooner, because IQ scores obtained after age 7 years are more stable over time than IQ scores obtained before age 7 years (as reviewed by Sattler, 2001, p. 171).
2.2.2. Reading measures
2.2.2.1. Woodcock Johnson—revised (WJ-R) reading subtests
The WJ-R is a widely used standardized test of academic achievement. Two of the reading subtests were administered during all 4 years of the study. The Letter Word Identification (LWID) subtest is used to measure single-word recognition or, for younger children, letter symbol recognition. It involves reading aloud the names of individual letters presented visually, or reading aloud from a list of single words. The Word Attack subtest is used to assess a child's phonological decoding skills. It involves presenting a list of unfamiliar words (non-words, such as “flep”) that the child reads aloud. Response accuracy is based on conventional English phonology. For both tests, a raw score is computed from the number of correct answers, and is converted to an age-referenced standard score (mean=100, SD=15).
2.2.2.2. Rapid automatized reading (RAN)
We used a version of the RAN originally developed by Denckla and Rudel (1976) as a measure of single word retrieval fluency. RAN has since been incorporated into standardized testing batteries developed to assess phonologically based reading difficulties, such as the CTOPP (Wagner, Torgeson, & Rashotte, 1999). The version we used included four pages of 50 test stimuli that the child was to name aloud as quickly as possible. Although the RAN was administered during all 4 years of the study, age appropriate subtests were administered as follows: during only the first 2 years of the study, children were asked to name pictures of five common objects (e.g., brush, clock). During all 4 years of the study, children were given three subtests that involved naming colors, single digit numbers, or single letters. For all subtests, the variable of interest was response time (RT) to complete the task, with a shorter RT indicating more desirable performance.
2.2.2.3. Reading fluency
A brief, experimental oral fluency measure was administered in third grade only. During this task, each child was asked to read a 200 word passage aloud. The examiner noted the response time needed to read the passage and the total number of errors and dysfluencies the child made while reading.
2.2.3. Measures of visual spatial skills
2.2.3.1. Developmental test of visual perception second edition (DTVP-2)
The DTVP-2 (Hammill, Pearson, & Voress, 1993) has four motor-reduced subtests used to assess various aspects of perceptual skills. These were administered during all 4 years of the study. The Position in Space subtest requires the child to differentiate several similar figures in an attempt to match one of four or more figures to a target figure. The Figure–Ground subtest requires recognizing individual shapes from designs constructed with overlapping and/or embedded shapes. During the Visual Closure subtest, the child is asked to select which of several degraded shapes would match a target shape, were the degraded shapes to be completely drawn in. The Form Constancy subtest is used to assess whether a child can recognize figures with matching shapes that differ in size, color, and/or orientation. For each subtest, the total number of correct responses is converted to an age-referenced scaled score (mean=10, SD=3).
2.2.3.2. Visual motor integration (VMI)
The VMI (Beery, 1997) Fourth Edition is a widely used paper-and-pencil task used to assess a child's ability to coordinate visual perception and motor planning. It was used during all 4 years of the study. The traditional VMI involves copying individual geometrical figures, presented in order of increasing complexity, that range from horizontal lines to overlapping three dimensional representations. The child is allowed only one attempt per drawing, without opportunity to erase or otherwise correct the drawing. In addition, supplemental subtests are available, and are based on the same geometric shapes and figures used in the traditional VMI. These supplemental subtests were administered during first grade only. The visual supplemental task involves selecting which of four or more similar figures matches a target object, whereas the motor supplemental task requires drawing each figure using outlines and connect-the-dot guides. Each of the three VMI tasks yields an age-referenced standard score (mean=100, SD=15).
2.2.4. Math measures
In order to assess possible sex differences, it is important to identify relevant, developmentally appropriate mathematical skills in which differences may be apparent. Candidate skills are implicated from both research on normative development of mathematical reasoning (e.g., as reviewed by Ginsburg, Klein, & Starkey, 1998), and research on core deficits of mathematics difficulties (e.g, Geary, 2004). Ginsburg and Baroody (1990) developed a standardized measure of math ability based on skills observed in typically developing children. This test is the Test of Early Mathematical Ability — Second Edition (TEMA-2). We included both the TEMA-2 and a standardized academic achievement test in our study as a comprehensive measure of age-referenced mathematics performance. However, standardized tests do not necessarily capture basic skills that underlie successful primary school age math, so we also included a measure of counting skills developed for this study. The measures used here are in line with the tasks that would be used in schools.
2.2.4.1. Test of early mathematical ability 2 (TEMA-2)
The TEMA-2 is a standardized test normed for children ages 4 through 8 years. It was administered to the participants during all 4 years of the study. Unlike standardized achievement tests, the TEMA-2 includes a wide range of test items for both formal math skills (i.e., typically targeted for school instruction, such as addition algorithms) and informal skills typically not addressed by the school curriculum, such as mental addition (Ginsburg & Baroody, 1990). We obtained raw scores, and age-referenced standard scores (mean=100, SD=15).
2.2.4.2. Keymath revised (KM-R)
The KM-R is a standardized academic achievement test of mathematical basic concepts, operations, and applications. The age-appropriate subtests used in this study included Numeration, Geometry, Addition, Subtraction, Measurement, and Time and Money. These subtests were administered during the first through third years of the study, and were omitted in the fourth year because of time constraints. The Numeration subtest includes items dealing with quantity, magnitude, number line, and place value. The Geometry subtest items involve categorizing shapes, sizes, and relative position. The Operations subtests (addition and subtraction) include pictorially represented arithmetic problems followed by traditional paper and pencil calculation problems. The Measurement and Time and Money subtests are applied subtests dealing with different measurement units (e.g., inches, minutes, and pennies) and sequencing of objects based on units of volume, length, or monetary value. Raw scores were obtained for each subtest, as well as age-referenced scaled scores (mean=10, SD=3). There was no age-referenced standard score on the Addition, Subtraction, and Time and Money subtests for the youngest participants completing these tasks. Therefore, analyses for these three subtests are performed based on raw scores.
2.2.4.3. Woodcock Johnson — revised (WJ-R) math calculation subtest
The WJ-R Math Calculation subtest is a widely used standardized test of paper and pencil math problems presented in order of increasing difficulty. Problems range from one digit addition to linear algebra problems. This test was administered in kindergarten, first, and third grade; it was omitted during second grade because of time constraints. Although administered in kindergarten, the majority of kindergartners were unable to solve any of the problems. Thus most analyses of this task are limited to first and third grades. An age-referenced standard score was obtained (mean=100, SD=15).
2.2.4.4. Counting trials
The Counting Trials task, an experimental measure, is a modification of a counting paradigm used by Geary et al. (e.g., Geary, Bow-Thomas, & Yao, 1992). We administered a Counting Trials task during the last 3 years of the study. During the practice warm up session for this task, the child is told that the examiner will count sets of dots, and that the child needs to “watch carefully” and report whether the examiner “counted the right number of dots”. The examiner exemplifies correct and incorrect counting, and provides feedback on whether the child's assessment is correct. The examiner's mistakes are standardized, and the child's responses are coded as true positives (hits), true negatives, false positives (or false alarms), or false negatives (misses). The total correct response is the sum of hits and true negatives. Version I of the Counting Trials task, based on 15 items, was administered during first grade. Version II, based on 24 items, was presented during second and third grades. In third grade, it was administered only to children who scored <100% on the task during second grade. For both versions, the variable of interest is the percent accuracy (number correct out of total possible).
2.2.4.5. Math facts
The Math Facts task was simply a list of 24 single-digit addition and subtraction problems, with all addends <6, presented verbally. This test was administered only during second grade. During this task, the examiner reads each problem aloud, and the child is asked to give a solution to the problem as quickly as possible. Children's answers and response times were recorded, to code for response accuracy and strategy, respectively. Performance accuracy is based on correct fact retrieval; a child receives one point for a correct response if the response is given in 3 or fewer seconds. The total number “correc” reflects the total number of correctly retrieved facts.
2.3. Procedures
Each child was tested individually each year, by one or two female examiners, during one to three sessions. During kindergarten, all testing was completed in the child's school, outside of the classroom, in a room occupied only by the child and the examiners. Beginning in first grade, children who moved to another school were tested either at their school or at the principal investigator's research office. The order of the test measures was fixed across participants, and deviations to this sequence were avoided except under circumstances beyond the examiner's control, such as if interrupted by a school fire drill or a child's illness.
2.4. Analyses
The analyses varied as a function of variable type, research question addressed, and whether the measure was administered during one or more school years. First, we examined whether sex differences emerged on reading, spatial, or math skills at ages 5 through 8 years. For measures given two or more times, we carried out a repeated measures analysis of variance (ANOVA), using a 2 (Sex) × 2, 3, or 4 (Grade Level) design. This allowed us to assess possible main effects of sex, and possible grade by sex interactions. Main effects of grade were not of interest in the present study, given the expected increases in performance level over time for raw scores and the lack of a main effect of grade expected for age-referenced standard scores. Thus, grade effects are not reported in the results below. For measures obtained during only 1 year, we used unpaired t-tests, assessing only possible effects of sex.
Second, we examined whether the frequency of boys or girls was higher in the groups of children performing in the highest or lowest quartile, relative to their peer group. We used a generalized linear model to estimate the odds ratio (OR), and to determine statistical significance. In this case, logistic regression is most appropriate because we had only one binary predictor variable (boys vs. girls). In order to identify upper and lower quartiles, we had to consider that the tests administered in this study yield discrete test scores. Therefore, it was necessary to determine the position of the 25th percentile at a break-off point as close to the 25th percentile position as possible. In the cases for which a cutoff point was not straightforward, we selected to err on the side of fewer children in a group, to remain below (or above) the designated quartile.
Third, to determine whether growth in reading, spatial, or math skills differed for boys vs. girls, we used growth curve modeling (GCM). GCM was carried out as a structural equation model, using the software package AMOS (Arbuckle & Wothke, 1999), with sex (male, female) entered as a time-invariant predictor of both initial status and rate of growth in performance on the outcome variables of interest.
Finally, we addressed whether there were sex differences in how well early verbal or spatial scores predicted later math achievement. The predictor variables included scores from the DTVP-2 Position in Space and RAN tests, both of which were positively correlated with a concurrent TEMA-2 score, as reported in another study (Mazzocco & Myers, 2003). For this set of analyses, we carried out multiple regression models, including sex as a predictor variable.
For all analyses, the null hypothesis (H0) was that there are no sex differences on overall group comparisons within a point in time, on comparisons of the upper and lower kth percentiles in a given point in time, or in rate of growth over time. We also predicted that verbal and spatial skills would be equally predictive of later math performance, for boys and girls. We used a significance level of α =0.05 on all analyses, and assumed normality for the sampling distribution for all the data because of the large sample size. Table 1 shows the total sample sizes for each year of the study. Standard scores are presented for all tests, unless otherwise noted.
3. Results
3.1. Preliminary analyses
Outliers were removed prior to data analysis. An outlier was defined as a score more than three standard deviations from the child's group (boy, girl) mean score. For each variable examined, the number of outliers represented was less than 3% (zero to six) of the total sample (∼200 children). Outliers were omitted from ANOVAs and t-tests. They were not omitted from Odds Ratio analyses, because Odds Ratios are based on relative, rather than absolute, scores.
We used t-tests to determine whether there were IQ or age differences in our two groups, and found that mean IQ scores did not differ between boys and girls, p =0.18, nor did the variance in IQ scores, p =0.13. Therefore, IQ scores were not considered in the subsequent analyses. We also found that boys were slightly older than girls during each year of the study (see Table 1). This difference was statistically significant for all 4 years, from kindergarten through third grade, t(247) <0.01, t(234)<0.001, t(222)<0.001, t(212)<0.01, respectively. Since standard scores adjust for age, and raw scores do not, it was necessary to consider possible age confounds when main effects of sex emerged. Specifically, if a test is used to measure skills influenced predominantly by formal instruction (e.g., paper and pencil math calculation scores), then boys may have lower standard scores than girls simply because they are older than girls at the time of testing, and thus score “lower” even if they receive the same grade-appropriate raw score. For this reason, when significant differences in standard scores were found in favor of girls on formal achievement tasks, we also examined raw scores to determine if the difference existed also in the actual number of correct responses. This was applicable to the WJ-R, KeyMath-Revised, and Math Facts tasks. As the TEMA-2 tests both formal and informal skills, we also examined the raw scores for this measure. If tasks were less likely to be influenced by formal achievement (e.g., drawing on the VMI task), it was not necessary to compare both raw and standard scores, and only the age-referenced, standard scores were analyzed.
3.2. Analyses of reading measures
3.2.1. Woodcock Johnson—revised reading subtests
For each WJ-R subtest, we carried out a 2 (Sex) × 4 (Grade Level) ANOVA, with repeated measures for grade level. There was a main effect of sex on LWID performance, with girls outperforming boys each year, from kindergarten through third grade, F(1,199)=17.98, p <0.0001; this was not seen on the Word Attack subtest, p =0.08. There was no significant Sex × Grade interaction for either LWID or Word Attack, ps>0.30. Girls also outperformed boys in terms of raw scores on the LWID subtest, from kindergarten through third grade, p =0.01.
Over time, there were inconsistencies in how often males and females were overrepresented in the upper and lower quartiles on the LWID and Word Attack subtests. Differences that did exist showed an overrepresentation of boys in the lower quartile, and an overrepresentation of girls in the upper quartile, from kindergarten through third grade. Specifically, boys were overrepresented in the lower quartile of LWID performance in kindergarten, β =− 0.79, p <0.01, and in first grade, β =−0.94, p <0.01; and were also overrepresented in the lower quartile on Word Attack during first grade, β =−0.82, p <0.01. In second grade there were more boys in the lower quartile, with results approaching significance, on LWID, β =−0.63, p=0.05, and Word Attack, β =−0.61, p =0.06. Girls were overrepresented in the upper quartile of LWID performance in kindergarten, β=0.73, p =0.02, second grade, β =0.90, p <0.01, and third grade, β=0.96, p <0.01. Boys and girls were equally represented in the upper quartile on the Word Attack subtest, from kindergarten through third grade, ps>0.35.
3.2.2. RAN
For the RAN Objects subtest, a 2 (Sex) × 2 (Grade Level) repeated measures ANOVA was used, while a 2 (Sex) × 4 (Grade Level) repeated measures ANOVA was carried out for the RAN Colors, Numbers, and Letters subtests (the Objects subtest was administered only during the first 2 years of the study).
Consistent with the WJ-R reading subtests, no main effect of sex was observed on three of these four RAN subtests; the one main effect of sex emerged only on the Colors subtest, with girls outperforming boys (by achieving lower response times), F(1,194)=6.29, p =0.01. There was a significant Sex × Grade interaction for only one of the subtests, RAN Letters, F(3,171)=2.75, p =0.04. This was an interaction of magnitude, with girls outperforming boys on RAN Letters in kindergarten and first grade (Cohen's d =0.27 and 0.23, respectively), but then performing at a level comparable to boys during second and third grade (Cohen's d =0.00 and 0.12, respectively). There was no significant interaction on the Objects, Colors, and Numbers subtests, ps>0.25. Thus, on RAN performance, either the boys or girls had comparable response times, or girls outperformed boys (indicating lower response times).
During kindergarten, boys and girls were equally represented in the upper and lower quartiles for all RAN subtests (Objects, Numbers, Letters, or Colors). Changes to emerge over time were minimal, and limited to the upper quartile group (i.e., the faster responders). In first grade, girls were overrepresented in the fastest group, but only on the Letters subtest, β =0.81, p =0.014. This continued into second grade, for both the Letters, β=0.68, p =0.04, and Colors, β=0.78, p =0.02, and in third grade, on the Colors subtest, β =0.69, p =0.047.
3.2.3. Reading fluency
An unpaired t-test was used for the Reading Fluency measures of response time and number of errors, because this test was administered only in third grade. Girls were significantly faster on the reading fluency task, t(211)=2.36, p <0.02, Cohen's d =0.33, whereas boys had a significantly larger response time variance, F(103,108)=2.58, p <0.0001. Although boys made more errors than girls, this difference did not reach statistical significance, t(210)=1.87, p=0.06, Cohen's d =0.26.
Girls and boys were equally represented in the upper quartile for reading response times, but boys were overrepresented in the lower quartile (slowest readers) of performers on this task, β =−0.74, p =0.02. Boys were also overrepresented in the upper quartile of participants making the most errors, β =−0.92, p <0.01.
In summary, girls outperformed boys on four of the eight variables measuring reading-related skills, during at least one of the primary school age years. Boys did not outperform girls on any of these measures. This tendency toward a female advantage on reading-related skills was apparent on only some of the reading measures, and the largest effect sizes associated with the significant findings were moderate at best, Cohen's d <0.61 (see Table 2).
3.3. Analyses of visual spatial skills
3.3.1. DTVP
A 2 (Sex) × 4 (Grade Level) ANOVA was carried out for each of the four DTVP subtests. A main effect of sex was seen only on the Figure Ground subtest, F(1,208)=14.41, p <0.001; with girls outperforming boys overall. There was also a significant Sex × Grade interaction on this Figure Ground subtest, F(3,208)=2.66, p =0.047. The interaction was one of magnitude, with effect sizes ranging from small to moderate during the 4 years of the study, Cohen's d ranges from 0.16 to 0.54. There was no main effect of sex for any of the other three subtests (Position in Space, Visual Closure, or Form Constancy), ps>0.20; nor were there any additional Sex × Grade interaction on the other three subtests (ps>0.75).
Representation of boys vs. girls in both the upper and lower quartiles was comparable, for the most part, in kindergarten through third grade. In kindergarten and first grade, differences were seen only on the Figure Ground subtest, for which there was an overrepresentation of boys in the lower quartile in both grades, β =−0.81, p =0.02; β =−0.76, p =0.02, respectively, and an overrepresentation of girls in the upper quartile only during first grade, β =0.64, p =0.04. There were no sex differences in second grade, ps range from 0.06 to 0.99. In third grade, only two differences were seen. Girls were overrepresented in the upper quartile of performers on the Form Constancy subtest, β =0.85, p =0.02, while boys were overrepresented in the lower quartile of performers on the Figure Ground subtest, β =−0.91, p <0.01. No other differences were seen, ps range from 0.14 to 0.99.
3.3.2. VMI
A 2 (Sex) × 4 (Grade Level) ANOVA was carried out for the VMI test. There was main effect of sex, F(1,203)=7.13, p <0.01, with girls outperforming boys each year. However, effect sizes were small to moderate for each year of the study, Cohen's d ranging from 0.16 to 0.45. The Sex × Grade interaction was not significant, p =0.17. An unpaired t-test was used for the VMI Supplemental Motor subtest, as this was administered only one time, in first grade. Similar to the VMI test, girls outperformed boys on the Motor supplemental subtest in terms of mean scores, t(204)=−3.35, p =0.001; but the effect size was moderate, Cohen's d =0.47, and group variances were not significantly different, p =0.53. There was no difference on the VMI Supplemental Visual subtest, for either the means or variances, ps>0.56.
Odds ratio analyses revealed some sex differences that were inconsistent over time. There were comparable numbers of boys and girls in the lower quartiles, during kindergarten (p =0.08) and first grade (p =0.16). Girls were overrepresented in the upper quartile in kindergarten, β =0.97, p <0.01; and second grade, β=0.85, p <0.01, but not in first grade, p =0.98. Boys were overrepresented in the lower quartile in second grade, β =−0.78, p =0.02. There were no differences in participation levels in third grade, in either the lower quartile (p =0.13) or upper quartile (p =0.27).
While no differences were seen on the overall VMI test in first grade, differences emerged on the VMI Motor subtest during that year. Consistent with the other results on the VMI test, boys were overrepresented in the lower quartile, (β =−1.04, p <0.01) for the VMI Motor subtest (administered in first grade only), whereas girls were overrepresented in the upper quartile, (β =0.83, p =0.01). In contrast, boys and girls were equally represented in the upper and lower quartiles on the VMI Visual test, ps>0.51.
In summary, girls outperformed boys on three of the seven variables measuring visual spatial skills, during at least one of the primary school age years. Yet these sex differences were moderate at best, and none persisted at a moderate level over all 4 years of the study. Boys did not outperform girls on any of these measures. The largest effect sizes associated with the significant findings were moderate at best, Cohen's d <0.54 (see Table 2).
3.4. Analyses of math measures
3.4.1. TEMA-2
A 2 (Sex) × 4 (Grade Level) repeated measures ANOVA was carried out to examine standard scores from the TEMA-2. There was neither a main effect of sex, p =0.35, nor a Sex × Grade interaction, p =0.07.
Odds ratio analyses revealed differences in how often boys and girls were represented in the upper and lower quartiles for the TEMA-2 scores, across all 4 years of the study. In kindergarten, boys were overrepresented in the lower quartile β =−0.66, p =0.03, but boys were overrepresented in the upper quartile during first grade, β =−0.64, p =0.03, and second grade, β =−0.74, p =0.02. No difference was seen in the upper quartile in third grade, p =0.07. There were comparable numbers of boys and girls in the lower quartile for first, second, and third grades, p =0.72, p =0.13, and p =0.38, respectively.
3.4.2. Keymath
A 2 (Sex) × 3 (Grade Level: kindergarten, first, and second grades) repeated measures ANOVA was carried out for each of five KeyMath-R subtests: Numeration, Geometry, Addition, Subtraction, and Measurement. Only a few participants were given the Time and Money subtest in kindergarten, so a 2 (Sex) × 2 (Grade Level) repeated measures ANOVA was carried out for this subtest, with the analysis limited to first and second grades. As noted earlier, raw scores were analyzed in lieu of standard scores on the Addition, Subtraction, and Time and Money subtests, because age-references scores were not available for the youngest participants completing these tasks.
Main effects for sex were seen on three subtests, with different outcomes regarding whether boys or girls outperformed each other. There was no sex difference on standard scores for the Numeration subtest, p =0.30, but boys outperformed girls on the Numeration raw scores, F(1220)=7.61, p <0.01. Girls outperformed boys on the Geometry subtest standard scores and raw scores, F(1220)=14.96, p <0.001 and F(1220)=6.00, p =0.02, respectively. The differences between girls' and boys' performance on Geometry was moderate, but consistent, from kindergarten to second grade, Cohen's ds range from 0.37 to 0.46. Boys outperformed girls on the Time and Money subtest raw scores, F(1219)=4.21, p =0.04. There were no sex differences on the additional three subtests, ps>0.19.
A significant Sex × Grade interaction emerged on the Numeration subtest raw scores, F(2220)=5.41, p <0.01; and on the Measurement subtest standard scores, F(2218)=6.57, p <0.01, and raw scores, F(2,218)=5.38, p <0.01. There were no additional Sex × Grade interactions on the other four subtests, ps>0.47. On the Numeration subtest, the interaction was one of magnitude, with boys outperforming girls only during two of the three grades examined (first and second grade). Similarly, on the Measurements subtest, the interaction was one of magnitude, with effect sizes that were small at best (Cohen's d ranged from 0.08 to 0.26).
Odds ratio analyses showed no differences in the number of boys or girls among the upper and lower quartiles, in kindergarten, for four KM-R subtests, including Numeration, Addition, Subtraction, and Measurement, ps ranged from 0.06 to 0.77; Time and Money scores were not included in kindergarten due to the small number of children who took this subtest. Of these five subtests, statistically significant differences beyond kindergarten occurred for only three subtests. On the Addition subtest, boys were overrepresented in the upper quartile in first grade, βs=−0.99, p =0.01. There were no other differences on this subtest. Boys were also overrepresented in the upper quartile on the Time and Money subtest, in first grade, βs=−0.98, ps<0.01, and in second grade, β =−0.65, p <0.03; and on the Measurement subtest, at second grade, β =−0.73, p =0.04.
In addition, several differences were observed on the sixth subtest, Geometry. Boys were overrepresented in the lower quartile in kindergarten, β =−0.60, p =0.04, first grade, β =−0.88, p <0.01, and second grade, β =−0.99, p <0.01. In first grade, girls were overrepresented in the upper quartile, β =0.63, p =0.03.
3.4.3. Woodcock Johnson—revised
A 2 (Sex) × 3 (Grade Level: kindergarten, first grade, and third grade) repeated measures ANOVA was carried out for the WJ-R Math Calculation subtest. There was no main effect of sex, p =0.47, nor a Sex × Grade interaction, p =0.58.
Boys and girls were equally represented in the upper and lower quartiles, in kindergarten and first grade, ps>0.40, on the WJ-R Math Calculation subtest. Differences emerged in third grade, with an overrepresentation of boys in the lower quartile, β =−0.74, p =0.02; boys and girls were equally represented in the upper quartile in third grade, p =0.65.
3.4.4. Counting trials
A 2 (Sex) × 2 (Grade Level: first and second grades) repeated measures ANOVA was carried out for the Counting Trials task. There was no main effect of sex, nor was there a Sex × Grade interaction, ps>0.51. Although more girls than boys required retesting on this task during third grade, the difference in participation was not significant, p =0.80. Boys and girls were equally represented in the upper and lower quartiles, in both first and second grades, on the Counting Trials task.
3.4.5. Math facts
An unpaired t-test was used for Math Facts, as this task was administered only one time, in second grade. Girls were more accurate on this task than boys, t(217)=−1.98, p =0.0492. However, this effect size was small, Cohen's d =0.27, with children in both groups approaching ceiling levels. Odds ratio analyses for the upper quartile were not appropriate, given that most children achieved a score of 90% correct or higher. There were comparable numbers of boys and girls in the lower quartile, p =0.63, and in the lowest tenth percentile, p =0.11.
3.5. Growth curve modeling
GCM analyses could be performed only for tests that were administered during all 4 years. No sex difference was observed on the starting point (intercept) or slope (growth) between boys and girls on all ten measures assessed, including WJ-R LWID, RAN Colors and Numbers, all four DTVP subtests, the VMI, and the TEMA-2. There was a significant sex difference on the end point intercept for the TEMA-2, LWID, and DTVP figure ground subtest. GCM was not performed for RAN Letters due to the large number of kindergartners who were unable to complete the task. See Table 3 for a summary of GCM coefficients.
Table 3.
Growth curve results for linear model with gender as a predictor and time 1 and time 4 intercepts
| TEMA−2 | DTVP—position in space | RAN number response times | RAN color response times | Word attack | |
|---|---|---|---|---|---|
| Time 1 intercept | |||||
| Intercept | 25.69* | 13.55* | 49.00* | 58.47* | −99* |
| Slope | 0.94* | 0.25* | −0.64* | −0.52* | −52* |
| Var (intercept) | 39.75* | 8.34* | 121.04* | 183.86* | 7.44* |
| Var (slope) | 0.02* | 0.00* | 0.04* | 0.08* | 0.03* |
| Intercept on gender | 0.53 | −0.29 | 1.18 | 3.07 | 0.10 |
| Slope on gender | 0.05 | 0.02 | 0.01 | −0.05 | −0.02 |
| Intercept | 56.23* | 21.64* | 28.44* | 41.76* | 17.22* |
| Slope | 0.94* | 0.25* | −0.60* | −0.49* | 0.51* |
| Var (intercept) | 51.09* | 5.60* | 25.28* | 54.35* | 39.53* |
| Time 4 intercept | |||||
| Var (slope) | 0.01* | 0.00 | 0.03 | 0.07* | 0.04* |
| Intercept on gender | 2.22* | 0.19 | 1.50 | 1.52 | −0.33 |
| Slope on gender | 0.05 | 0.01 | 0.01 | − 0.05 | −0.01 |
| Letter word ID | VMI | DTVP—figure ground | DTVP—visual closure | DTVP—form constancy | |
| Time 1 intercept | |||||
| Intercept | 16.92* | 12.48* | 10.02* | 4.92* | 9.84* |
| Slope | 0.76* | 0.17* | 12 * | 0.28* | 0.18* |
| Var (intercept) | 23.89* | 2.43* | 2.88* | 4.06* | 1.64* |
| Time 1 intercept | |||||
| Var (slope) | 0.01 | 0.00 | 0.00* | 0.01* | 0.01* |
| Intercept on gender | −0.99 | −33 | −0.53 | −0.25 | −0.26 |
| Slope on gender | −0.02 | −0.00 | −0.02 | 0.01 | −0.00 |
| Time 4 intercept | |||||
| Intercept | 41.41* | 18.03* | 13.83* | 14.07* | 15.57* |
| Slope | 0.74* | 0.17* | 0.12* | 0.28* | 0.18* |
| Var (intercept) | 27.49* | 2.23* | 5.83* | 17.24* | 7.94* |
| Var (slope) | 0.00 | −0.00 | 0.00* | 0.01* | 0.01* |
| Intercept on gender | −1.75* | −38 | −1.25* | −0.01 | −0.32 |
| Slope on gender | −0.02 | −0.00 | −0.02 | 0.01 | −0.00 |
p <0.05.
In general, there were no significant sex differences in growth rates on any of the measures examined. Girls showed some statistical advantages in some of their endpoint (third grade) reading and spatial scores. These differences corresponded to the ANOVA findings reported earlier, although unlike the ANOVAs, raw scores were used for the GCM. Boys had a slight advantage on TEMA-2 scores, but only at first grade. This difference corresponds to the fact that boys were slightly older than girls, as discussed earlier. When TEMA-2 scores were examined as standard scores, there was no sex difference at third grade or at any other grade.
The average growth on the LWID, Position in Space, and Figure Ground subtests was ≤.02 points, in raw score points, and did not differ for boys versus girls. There was no difference in the growth trajectories between boys and girls across the 4 years of the study.
The average growth in RAN response time, which in this case was decline in total RT, was less than 1 s per year. The average growth rate, in raw score points over the 4 years of the study, was 0.05 for the TEMA-2.
3.6. Kindergarten and first grade predictors of third grade math achievement
Our final analyses concerned whether early predictors of math varied for boys vs. girls. We ran two separate sets of multiple regression models, using predictor variables from either kindergarten or first grade. Based on an earlier report (Mazzocco & Myers, 2003), we selected scores on RAN Colors (kindergarten) or Numbers (first grade) and DTVP Position in Space (kindergarten or first grade) subtests, and the kindergarten or first grade TEMA-2 scores, as appropriate, as predictor variables, and third grade TEMA-2 scores as the outcome variable. We report the results in terms of adjusted r2 values. Table 4 is a summary of the correlations resulting from those analyses.
Table 4.
Kindergarten and grade 1 predictors of third grade TEMA-2 performance, reported as r2
| Predictor variables | Kindergarten | Grade 1 | ||||
|---|---|---|---|---|---|---|
| Full group | Boys only | Girls only | Full group | Boys only | Girls only | |
| DTVP position in space, RAN colors (kindergarten)/RAN numbers (first grade) | 0.192 | 0.246 | 0.130 | 0.169 | 0.245 | 0.075 |
| DTVP position in space | 0.124 | 0.167 | 0.082 | 0.054 | 0.068 | 0.037 |
| RAN colors | 0.120 | 0.166 | 0.071 | – | – | – |
| RAN numbers | – | – | – | 0.129 | 0.216 | 0.041 |
| TEMA-2 | 0.315 | 0.335 | 0.282 | 0.412 | 0.478 | 0.320 |
As expected, kindergarten and first grade TEMA-2 scores were both strongly correlated with third grade TEMA-2 scores, ps<0.0001. For each grade, earlier TEMA-2 performance accounted for approximately 30% to 40% of variation later observed in third grade TEMA-2 scores, adjusted r2=0.315 and 0.412, respectively, and correlations were comparable when the regression models included only boys, or only girls, ps<0.0001.
We ran three more sets of analyses. One set included both the RAN and DTVP scores combined, and the subsequent two models separately examined the degree to which each individual variable was correlated with the third grade TEMA-2 score.
When using both the DTVP Position in Space and RAN Colors or Numbers subtests in the multiple regression, the results were significant whether the entire sample or only boys or girls were included, ps ranging from 0.03 to <0.0001, and accounted for approximately 18% of the variation seen in third grade TEMA-2 scores, adjusted r2=0.192, and 0.169, respectively. For both kindergarten and first grade, these two variables accounted for more variance in boys' third grade TEMA-2 performance, adjusted r2=0.246 and 0.245, respectively, than in girls' third grade TEMA-2 performance, adjusted r2=0.130 and 0.075, respectively.
When using only the kindergarten or first grade RAN variable alone, results were again significant whether the entire sample or only boys or girls were included, ps ranging from 0.02 to <0.0001. Correlations with third grade TEMA-2 scores were comparable with each other, accounting for approximately 12% of the variance in third grade TEMA-2 scores, adjusted r2=0.120 for kindergarten RAN Colors, and 0.129 for first grade RAN Numbers. Similar to the combined model described above, the RAN variables alone accounted for more variance in boys' third grade TEMA-2 performance, adjusted r2=0.166 and 0.216, respectively, than in girls' third grade TEMA-2 performance, adjusted r2=0.071 and 0.041, respectively.
Our final model considered only the kindergarten or first grade DTVP Position in Space variable alone as a predictor for third grade TEMA-2 performance. Similar to the other models, the results were significant whether the entire sample or only boys or girls were included, ps ranging from 0.03 to <0.0001. The DTVP Position in Space subtest scores accounted for 5% to 12% of the variation seen in third grade TEMA-2 scores, adjusted r2=0.124 and 0.054, respectively. For both kindergarten and first grade, this variable accounted for more variance in boys' third grade TEMA-2 performance, adjusted r2=0.167, and 0.068, respectively, than in girls' third grade TEMA-2 performance, adjusted r2=0.082 and 0.037, respectively.
In summary, individual variables previously shown to correlate with TEMA-2 performance continued to show significant correlations when these associations were examined separately among boys and girls. The strength of these correlations was either comparable across boys and girls, or slightly stronger for boys, as summarized in Table 4. The latter finding could be due to the greater variance in test scores seen in boys, providing a less restricted range of scores from which correlations can be measured.
4. Discussion
The present study was designed to expand upon existing studies of sex differences in math skills during the primary school age years. Although sex differences in math skills have been studied extensively, findings regarding sex differences in early elementary school years are inconsistent. As such, we sought to add to the existing literature in three ways. First, we examined math scores from a variety of tasks indicative of those seen in primary school age classrooms, and we also examined performance in skills known to correlate with math performance, including reading-related and visual spatial skills. Second, we examined potential sex differences longitudinally, with a sample of sufficient size to detect relatively small effect sizes. Our longitudinal design also allowed us to examine whether sex differences become more apparent over time, in the same group of children, during the primary school age years, and whether growth rates for math and related skills differ between boys and girls. Finally, we explored whether the association between early and later math scores differs for boys vs. girls. We acknowledge that these findings are limited to children from one large school district, and that while a broad range of socioeconomic status levels was represented in our sample, the sample excluded students from the lowest and highest SES categories.
Our findings predominately support the notion that sex differences in math, on standardized tasks similar to those seen in school for primary school age children, are minimal or nonexistent. There was no overall persistent pattern of findings suggesting a male or female advantage in math performance overall, nor during any one single year of the study or in any one area of math skills, such as paper and pencil calculations or counting skills. The same was true regarding children's performance on the spatial skills we assessed. While there were some main effects of sex from analyses of variance for some of the spatial and math tests, the majority of math and spatial variables did not demonstrate significant main effects that persisted over each year of the study. By design, the measures used in this study did not address any very specific skills or tasks on which differences have been seen unless these skills or tasks are in common use in a primary school setting, where sex differences may have a real effect on students' advancement or on teachers' perceptions and expectations.
There was also no consistent pattern of findings suggesting a male or female advantage for all of the math tasks, or all of the spatial skills. Indeed, there were as many significant results in favor of girls outperforming boys as there were for boys outperforming girls. The latter was observed only among a small subset of the math variables included in the study. Perhaps the most consistent finding in this study is simply that effect sizes remained relatively small, never exceeding moderate levels, and typically falling below 0.25. From the 73 effect sizes calculated, across 24 tests and subtests given over 1 to 4 years, 52 (71%) were <0.25, and 22 of these (42%) were ≤0.10. Even the sex differences in the strength of the correlations we examined were neither consistently present nor consistently remarkable. In no case was a correlation significant among only boys (or girls), among those examined in the present study. Thus our findings fail to support a persistent, general male or female advantage on the math or spatial skills in use during the primary school age years.
Our findings are consistent with many studies that report minimal or no sex differences in math skills in primary school age years. Several studies report no sex differences in basic conceptual understanding, from preschool and kindergarten (Geary, 1994; Lummis & Stevenson, 1990), or from third through sixth grades (Marshall & Smith, 1987). Our findings expand upon the previous report by showing no change in rate of growth of math skills from kindergarten through third grade.
We also acknowledge that there are studies suggesting a valid sex difference in early math skills. The discrepancy between our findings and those of others' may be due to cohort effects, age effects, or to the types of math and spatial tasks examined in the present study. Cohort effects could reflect the notion that, as some researchers have argued, widespread sex differences in math are diminishing over generations (Friedman, 1989; Hyde et al., 1990a), as well as sex differences in math self-competence beliefs task values (Jacobs, Lanza, Osgood, Eccles, & Wigfield, 2002). While earlier studies reported widespread sex differences (Maccoby & Jacklin, 1974), recent studies generally report more consistent findings of sex differences at later ages (e.g., Leahey & Guo, 2001; Mau & Lynn, 2000), among high ability samples (e.g., Benbow, 1992; Carr & Davis, 2001). A thorough discussion of possible causes for these cohort effects is beyond the scope of this paper. To summarize briefly, a range of environmental influences have been proposed as primary or mediating factors affecting the diminishing gender gap in math. For example, as disparities in gender roles have decreased over time, so too may any corresponding sex differences in math abilities, due to these socialization issues. For example, Kiesler, Sproull, and Eccles (2002) make specific reference to the influence of such socialization issues on girls' use of, and resulting performance in, computing activities from childhood through adolescence, high school, and college. Still, others have rejected arguments towards the influence of such socialization issues, including Kaplan and Weisberg (1987), who found girls' performance on spatial tasks in third and fifth grades to be unaffected by societal interference. Others have argued that temperament of the child, reinforced by societal expectations, parental influence, and stereotypes, are key contributing factors to the existing gap between males' and females' math achievement (Penner, 2003; Leahey & Guo, 2001; as reviewed by Ben-Zeev, Duncan, & Forbes, 2005). Whatever complex forces may be acting upon the proposed sex differences in math, our study fails to support the existence of such differences in young school age children.
It is possible that our current findings would have differed if our sample had been studied beyond third grade. Although some researchers argue that sex differences do not emerge until later grades, it is also possible that the findings of the current study are likely to persist with this cohort of children, at least until the 6th grade. We base this notion on the findings from others, such as Gross-Tsur, Manor, and Shalev (1996), who failed to find differences in prevalence of math disabilities in fifth graders drawn from a cohort of over 3000 children. Sex differences may appear after that point, as other researchers claim that male superiority in math is most evident after puberty (Maccoby & Jacklin, 1974), possibly as a consequence of hormonal changes alleged to affect specific math and spatial skills (Gouchie & Kimura, 1981), and still limited to selective tasks. For example, Casey et al. claimed that by eighth grade, girls' poorer spatial–mechanical skills influenced their poorer performance on the male-favored items on the Third International Mathematics and Science Study, such as pictorial imagery and mental manipulation of images, while boys' superior performance on these items was due to the indirect effects of males' spatial–mechanical skills and their mathematics self-confidence (Casey et al., 2001; Gonzales et al., 2004). It remains to be seen whether the cohort in the present study will manifest sex differences beyond third grade, but our current findings fail to support widespread or emerging sex differences during the primary school age years on the types of tasks that would lead to observable differences in the classroom.
Finally, an additional explanation for the lack of sex differences in our study relates to the types of skills examined across our study and those of other researchers. Findings of sex differences in math during the primary school age years typically reflect highly specific skills, rather than a broad disparity between the sexes. Specific tasks include items such as simple arithmetic skills (favoring girls; Ginsburg & Russell, 1981), problems that rely on visualization strategies (favoring boys; Lummis & Stevenson, 1990), or math-related spatial–mechanical skills (e.g., Casey et al., 2001; Gallagher et al., 2000) including mental rotation (e.g., Astur et al., 1998; Levine et al., 1999). In our study, we examined composite scores on a broad range of math ability, paper and pencil calculation, and counting skills, and a similarly broad array of visual perception or visual motor skills, as typically assessed in primary school children. Although we do not propose that findings of sex differences on very specific tasks are necessarily invalid, we do propose that, based on our findings and those of others (e.g., Geary, 1994; as reviewed by Alyman & Peters, 1993; Tate, 1997; Marshall & Smith, 1987), there is much evidence to support the lack of either widespread, persistent, broad, or emerging sex differences in observable classroom achievement in primary school age children. Thus our findings support the notion that the existing evidence for sex differences in math and spatial skills are not justifiable grounds on which primary school teachers should base expectations or explanations for their young students' performance.
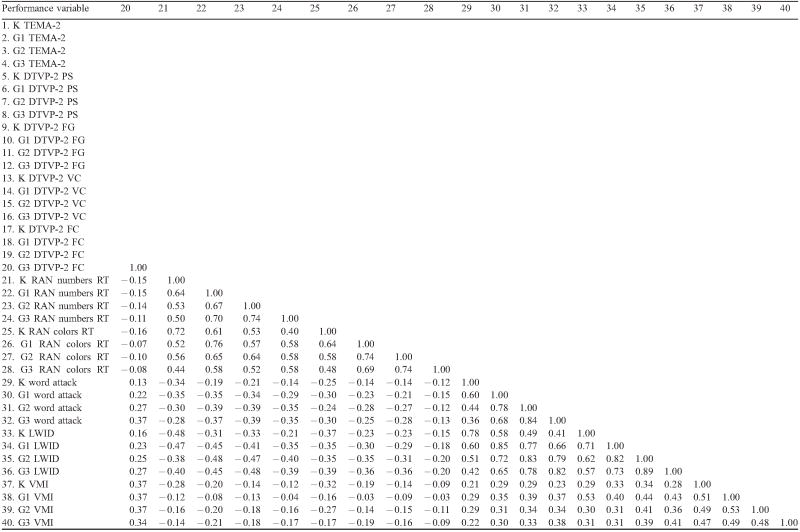
Appendix A.
Pearson R correlation values (pairwise deletion) for variables included in growth curve models
 |
 |
 |
Acknowledgments
This work was supported by NIH grant RO1 HD 034061 to Dr. Mazzocco. The authors thank the Baltimore County Public School District, the children and parents who participated in this research, Research Coordinator Gwen F. Myers, consultant Dr. Laurie Hanich, and the Math Skills Development Project research team.
Footnotes
A portion of this work was completed as a partial requirement for the first author's Master of Science in Engineering degree in the Department of Applied Mathematics and Statistics at Johns Hopkins University.
References
- Alyman C, Peters M. Performance of male and female children, adolescents and adults on spatial tasks that involve everyday objects and settings. Canadian Journal of Experimental Psychology. 1993;47:730–747. doi: 10.1037/h0078874. [DOI] [PubMed] [Google Scholar]
- Antell SE, Keating DP. Perception of numerical invariance in neonates. Child Development. 1983;54:695–701. [PubMed] [Google Scholar]
- Arbuckle JL, Wothke W. Amos 4.0 user's guide [computer software manual] Chicago: Smallwaters; 1999. [Google Scholar]
- Astur RS, Ortiz ML, Sutherland RJ. A characterization of men and women in a virtual Morris water task: A large and reliable sex difference. Behavioural Brain Research. 1998;93:185–190. doi: 10.1016/s0166-4328(98)00019-9. [DOI] [PubMed] [Google Scholar]
- Beery KE. Administration scoring and teaching manual. The Beery–Buktenica developmental test of visual–motor integration fourth edition. Modern Curriculum Press; 1997. [Google Scholar]
- Benbow CP. Sex differences in mathematical reasoning ability in intellectually talented preadolescents: Their nature, effects, and possible causes. Behavioral and Brain Sciences. 1988;11(2):169–232. [Google Scholar]
- Benbow CP. Academic achievement in mathematics and science of students between ages 13 and 23: Are there differences among students in the top one percent of mathematical ability? Journal of Educational Psychology. 1992;84:51–61. [Google Scholar]
- Benbow CP, Lubinski D, Shea DL, Eftekhari-Sanjani H. Sex differences in mathematical reasoning ability at age 13: Their status 20 years later. Psychological Science. 2000;11:474–480. doi: 10.1111/1467-9280.00291. [DOI] [PubMed] [Google Scholar]
- Ben-Zeev T, Duncan S, Forbes C. Stereotypes and math performance. In: Campbell J, editor. Handbook of Mathematical Cognition. New York: Psychology Press; 2005. pp. 235–249. [Google Scholar]
- Bielinski J, Davison ML. A sex difference by item difficulty interaction in multiple-choice mathematics items administered to national probability samples. Journal of Educational Measurement. 2001;38:1–79. [Google Scholar]
- Brescoll V, LaFrance M. The correlates and consequences of newspaper reports of research on sex differences. Psychological Science. 2004;15:515–520. doi: 10.1111/j.0956-7976.2004.00712.x. [DOI] [PubMed] [Google Scholar]
- Carr M, Davis H. Gender differences in arithmetic strategy use: A function of skill and preference. Contemporary Educational Psychology. 2001;26:330–347. doi: 10.1006/ceps.2000.1059. [DOI] [PubMed] [Google Scholar]
- Casey MB, Nuttall RL, Pezaris E. Mediators of gender differences in mathematics college entrance test scores: A comparison of spatial skills with internalized beliefs and anxieties. Developmental Psychology. 1997;33:669–680. doi: 10.1037//0012-1649.33.4.669. [DOI] [PubMed] [Google Scholar]
- Casey MB, Nuttall RL, Pezaris E. Spatial–mechanical reasoning skills versus mathematics self-confidence as mediators of gender differences on mathematics subtests using cross-national gender-based items. Journal for Research in Mathematics Education. 2001;32:28–57. [Google Scholar]
- Crucian GP, Berenbaum SA. Sex differences in right hemisphere tasks. Brain and Cognition. 1998;36:377–389. doi: 10.1006/brcg.1998.0999. [DOI] [PubMed] [Google Scholar]
- Denckla MB, Rudel RG. Rapid automatized naming (R.A.N.): Dyslexia differentiated from other learning disabilities. Neuropsychologia. 1976;14:471–479. doi: 10.1016/0028-3932(76)90075-0. [DOI] [PubMed] [Google Scholar]
- Fias W, Fischer MH. Spatial representation of numbers. In: Campbell J, editor. Handbook of Mathematical Cognition. 2005. pp. 43–54. [Google Scholar]
- Friedman L. Mathematics and the gender gap: A meta-analysis of recent studies on sex differences in mathematical tasks. Review of Educational Research. 1989;59:158–213. [Google Scholar]
- Gallagher AM, De Lisi R, Holst PC, McGillicuddy-De Lisi AV, Morely M, Calahan C. Gender differences in advanced mathematical problem solving. Journal of Experimental Child Psychology. 2000;75:165–190. doi: 10.1006/jecp.1999.2532. [DOI] [PubMed] [Google Scholar]
- Geary DC. Mathematical disabilities: Cognitive, neuropsychological, and genetic components. Psychological Bulletin. 1993;114:345–362. doi: 10.1037/0033-2909.114.2.345. [DOI] [PubMed] [Google Scholar]
- Geary DC. Children's mathematical development. Washington DC: American Psychological Association; 1994. [Google Scholar]
- Geary DC. Mathematics and learning disabilities. Journal of Learning Disabilities. 2004;37:4–15. doi: 10.1177/00222194040370010201. [DOI] [PubMed] [Google Scholar]
- Geary DC, Bow-Thomas CC, Yao Y. Counting knowledge and skill in cognitive addition: A comparison of normal and mathematically disabled children. Journal of Experimental Child Psychology. 1992;54:372–391. doi: 10.1016/0022-0965(92)90026-3. [DOI] [PubMed] [Google Scholar]
- Geary DC, DeSoto MC. Sex differences in spatial abilities among adults from the United States and China: Implications for evolutionary theory. Evolution and Cognition. 2001;7(2):172–177. [Google Scholar]
- Geary DC, Gilger JW, Elliott-Miller B. Gender differences in three-dimensional mental rotation: A replication. The Journal of Genetic Psychology. 1990;153:115–117. doi: 10.1080/00221325.1992.10753706. [DOI] [PubMed] [Google Scholar]
- Geary DC, Saults SJ, Liu F, Hoard MK. Sex differences in spatial cognition, computational fluency, and arithmetical reasoning. Journal of Experimental Child Psychology. 2000;77:337–353. doi: 10.1006/jecp.2000.2594. [DOI] [PubMed] [Google Scholar]
- Ginsburg H, Baroody A. Test of early mathematics ability. 2nd. Austin, TX: PRO-ED; 1990. [Google Scholar]
- Ginsburg HP, Klein A, Starkey P. The development of mental addition as a function of schooling and culture. Journal of Cross-Cultural Psychology. 1998;12:163–168. [Google Scholar]
- Ginsburg HP, Russell RL. Social class and racial influences on early mathematical thinking. Monographs of the Society for Research in Child Development. 1981;46 [Google Scholar]
- Gonzales P, Guzmán JC, Partelow L, Pahlke E, Jocelyn L, Kastberg D, et al. U S Department of Education, National Center for Education Statistics. Washington, DC: U.S. Government Printing Office; 2004. Highlights from the trends in International Mathematics and Science Study (TIMSS) 2003 (NCES 2005–005) [Google Scholar]
- Gouchie C, Kimura D. The relationship between testosterone levels and cognitive ability patterns. Psychoneuroendocrinology. 1991;16:323–334. doi: 10.1016/0306-4530(91)90018-o. [DOI] [PubMed] [Google Scholar]
- Gross-Tsur V, Manor O, Shalev RS. Developmental dyscalculia: Prevalence and demographic features. Developmental Medicine and Child Neurology. 1996;38:25–33. doi: 10.1111/j.1469-8749.1996.tb15029.x. [DOI] [PubMed] [Google Scholar]
- Hammill DD, Pearson NA, Voress JK. Examiner's manual Developmental test of visual perception second edition. Austin, TX: Pro-Ed; 1993. [Google Scholar]
- Hyde JS, Fennema E, Lamon SJ. Gender differences in mathematics performance: A meta-analysis. Psychological Bulletin. 1990;107(2):139–155. doi: 10.1037/0033-2909.107.2.139. [DOI] [PubMed] [Google Scholar]
- Hyde JS, Fennema E, Ryan M, Frost LA, Hopp C. Gender comparisons of mathematics attitudes and affect: A meta-analysis. Psychology of Women Quarterly. 1990;14:299–324. [Google Scholar]
- Jacobs JE, Lanza S, Osgood WD, Eccles JS, Wigfield A. Changes in children's self-competence and values: Gender and domain differences across grades one through twelve. Child Development. 2002 March/April;73:509–527. doi: 10.1111/1467-8624.00421. [DOI] [PubMed] [Google Scholar]
- Johnson ES, Meade AC. Developmental patterns of spatial ability: An early sex difference. Child Development. 1987;58(3):725–740. doi: 10.1111/j.1467-8624.1987.tb01413.x. [DOI] [PubMed] [Google Scholar]
- Jordan NC, Hanich LB, Kaplan D. A longitudinal study of mathematical competencies in children with specific mathematics difficulties versus children with comorbid mathematics and reading difficulties. Child Development. 2003;74(3):834–850. doi: 10.1111/1467-8624.00571. [DOI] [PMC free article] [PubMed] [Google Scholar]
- Kaplan BJ, Weisberg FB. Sex differences and practice effects on two visual–spatial tasks. Perceptual and Motor Skills. 1987;64:139–142. doi: 10.2466/pms.1987.64.1.139. [DOI] [PubMed] [Google Scholar]
- Kiesler S, Sproull L, Eccles JS. Pool halls, chips, and war games: Women in the culture of computing. SIGCSE Bulletin. 2002;34:159–164. [Google Scholar]
- Kulp MT. Relationship between visual motor integration skill and academic performance in kindergarten through third grade. Optometry and Vision Science. 1999;76(3):159–163. doi: 10.1097/00006324-199903000-00015. [DOI] [PubMed] [Google Scholar]
- Kurdek LA, Sinclair RJ. Predicting reading and mathematics achievement in fourth-grade children from kindergarten readiness scores. Journal of Educational Psychology. 2001;93:451–455. [Google Scholar]
- Leahey E, Guo G. Gender differences in mathematical trajectories. Social Forces. 2001 Dec;80:713–732. [Google Scholar]
- Levine SC, Huttenlocher J, Taylor A, Langrock A. Early sex differences in spatial skill. Developmental Psychology. 1999;35:940–949. doi: 10.1037//0012-1649.35.4.940. [DOI] [PubMed] [Google Scholar]
- Lummis M, Stevenson HW. Gender differences in beliefs and achievement: A cross-cultural study. Developmental Psychology. 1990;26:254–263. [Google Scholar]
- Maccoby EE, Jacklin CN. The psychology of sex differences. Stanford, California: Stanford University Press; 1974. [Google Scholar]
- Manger T, Eikeland O. The effects of spatial visualization and students' sex on mathematical achievement. British Journal of Psychology. 1998;89:17–25. doi: 10.1111/j.2044-8295.1998.tb02670.x. [DOI] [PubMed] [Google Scholar]
- Marshall SP, Smith JD. Sex differences in learning mathematics: A longitudinal study with item and error analyses. Journal of Educational Psychology. 1987;79:372–383. [Google Scholar]
- Mau WC, Lynn R. Gender differences in homework and test scores in mathematics, reading and science at tenth and twelfth grade. Psychology, Evolution and Gender. 2000;2:119–125. [Google Scholar]
- Mazzocco MMM, Myers GF. Maximizing enrollment efficiency for school-based education research. Journal of Applied Social Psychology. 2002;32:1577–1587. doi: 10.1111/j.1559-1816.2002.tb02763.x. [DOI] [PMC free article] [PubMed] [Google Scholar]
- Mazzocco MMM, Myers GF. Complexities in identifying and defining mathematics learning disability in the primary school age years. Annals of Dyslexia. 2003;53:218–253. doi: 10.1007/s11881-003-0011-7. [DOI] [PMC free article] [PubMed] [Google Scholar]
- National Research Council. Everybody counts: A report to the nation on the future of mathematics education. Washington, DC: National Academy Press; 1989. [Google Scholar]
- Penner A. International gender X item difficulty interactions in mathematics and science achievement tests. Journal of Educational Psychology. 2003;95:650–655. [Google Scholar]
- Pratarelli ME, Steitz BJ. Effects of gender on perception of spatial illusions. Perceptual and Motor Skills. 1995;80:625–626. doi: 10.2466/pms.1995.80.2.625. [DOI] [PubMed] [Google Scholar]
- Reis SM, Park S. Gender differences in high-achieving students in math and science. Journal for the Education of the Gifted. 2001;25:52–73. [Google Scholar]
- Russell RL, Ginsburg HP. Cognitive analysis of children's mathematics difficulties. Cognition and Instruction. 1984;1:217–244. [Google Scholar]
- Sattler JM. Assessment of children: Cognitive applications. 4th. San Diego: Jerome M. Sattler, Publisher, Inc.; 2001. [Google Scholar]
- Starkey P. The early development of numerical reasoning. Cognition. 1992;43:93–126. doi: 10.1016/0010-0277(92)90034-f. [DOI] [PubMed] [Google Scholar]
- Starkey P, Spelke ES, Gelman R. Numerical abstraction by human infants. Cognition. 1990;36:97–127. doi: 10.1016/0010-0277(90)90001-z. [DOI] [PubMed] [Google Scholar]
- Strauss MS, Curtis LE. Infant perception of numerosity. Child Development. 1981;52:1146–1152. [PubMed] [Google Scholar]
- Swiatek MA, Lupkowski-Shoplik A, O'Donoghue CC. Gender differences in above-level EXPLORE scores of gifted third through sixth graders. Journal of Educational Psychology. 2000;92:718–723. [Google Scholar]
- Tate WF. Race–ethnicity, SES, gender, and language proficiency trends in mathematics achievement: An update. Journal for Research in Mathematics Education. 1997;28(6):652–679. [Google Scholar]
- Vasta R, Gallipeau Regan K, Kerley J. Sex differences in pattern copying: Spatial cues or motor skills? Child Development. 1980;51:932–934. [PubMed] [Google Scholar]
- Voyer D, Voyer D, Bryden MP. Magnitude of sex differences in spatial abilities: A meta-analysis and consideration of critical variables. Psychological Bulletin. 1995;117:250–270. doi: 10.1037/0033-2909.117.2.250. [DOI] [PubMed] [Google Scholar]
- Wagner RK, Torgeson JK, Rashotte C. Comprehensive test of phonological processing (CTOPP) Austin, TX: PRO-ED; 1999. [Google Scholar]
- Wechsler D. WASI Manual. San Antonio, TX: The Psychological Corporation; 1999. [Google Scholar]