Abstract
The objective of the present study was to test the hypothesis that, in the in vivo awake goat model, perturbation/lesion in the pontine respiratory group (PRG) would decrease the sensitivity to hypercapnia and hypoxia. The study reported herein was part of two larger studies in which cholinergic modulation in the PRG was attenuated by microdialysis of atropine and subsequently ibotenic acid injections neurotoxically lesioned the PRG. In 14 goats, cannula were bilaterally implanted into either the lateral (n = 4) or medial (n = 4) parabrachial nuclei or the Kölliker-Fuse nucleus (KFN, n = 6). Before and after cannula implantation, microdialysis of atropine, and injection of ibotenic acid, hypercapnic and hypoxic ventilatory sensitivities were assessed. Hypercapnic sensitivity was assessed by three 5-min periods at 3, 5, and 7% inspired CO2. In all groups of goats, CO2 sensitivity was unaffected (P > 0.05) by any PRG perturbations/lesions. Hypoxic sensitivity was assessed with a 30-min period at 10.8% inspired O2. The response to hypoxia was typically triphasic, with a phase 1 increase in pulmonary ventilation, a phase 2 roll-off, and a phase 3 prolonged increase associated with shivering and increased metabolic rate and body temperature. In all groups of goats, the phase 1 of the hypoxic ventilatory responses was unaffected by any PRG perturbations/lesions, and there were no consistent effects on the phase 2 responses. However, in the KFN group of goats, the phase 3 ventilatory, shivering, metabolic rate, and temperature responses were markedly attenuated after the atropine dialysis studies, and the attenuation persisted after the ibotenic acid studies. These findings support an integrative or modulatory role for the KFN in the phase 3 responses to hypoxia.
Keywords: breathing, hypercapnia, hypoxia, pons
the pontine respiratory group (PRG) has been considered a determinant of respiratory phase duration, as lesions and cooling in the medial parabrachial (MPBN) and Kölliker-Fuse (KFN) nuclei significantly prolonged inspiratory and expiratory phases (6, 7, 40). However, the PRG has also been shown to contribute to numerous other respiratory-related functions, including regulation of the ventilatory response to hypercapnia and hypoxia (11, 26, 36–39). Gautier and Bertrand (11) found that bilateral lesions in the pneumotaxic center increased tidal volume (Vt), inspiratory time (Ti), and expiratory time (Te) in awake cats breathing room air and when inspired CO2 was increased; however, overall ventilatory sensitivity was not changed by the lesions (11). After legions in the PRG, the respiratory frequency and Vt responses to hypoxia were reduced, as were breathing frequency responses to hypercapnia (38). Moreover, unilateral kainic acid injection or bilateral electrolytic lesioning of the lateral parabrachial nucleus (LPBN) significantly attenuates hypoxic Te shortening in anesthetized and vagotomized rats (37). Similarly, the normal Te shortening during hyperoxic hypercapnia is eliminated by kainic acid injection into the LPBN, and this response is actually reversed such that Te is prolonged and breathing frequency is decreased (36). Furthermore, the typical hyperoxic hypercapnic increase in phrenic nerve activity is reduced after LPBN lesion (36). Finally, in awake rats 1 wk after large kainic acid-induced lesions in the LPBN and KFN, the ventilatory responses to hypercapnia and hypoxia are greatly attenuated (26).
Most data supporting views on PRG contributions to hypoxic and hypercapnic ventilatory responses have been obtained from anesthetized or decerebrated preparations. Both of these preparations have major limitations. Anesthesia depresses ventilatory reflexes and induces acidosis in plasma and cerebrospinal fluid (17, 27). These changes can result in qualitative differences in ventilatory responses compared with the unanesthetized state. For example, hypoxia specific to the CNS is invariably depressant in anesthetized preparations (29), whereas in unanesthetized preparations it is stimulatory (9, 33). Decerebration may avoid these issues, but this preparation presents other problems such as loss of suprapontine influences on the responses (16, 41). Accordingly, to probe further the contributions of the rostral pons to the hypercapnic and hypoxic ventilatory response, the objective of the present study was to test the hypothesis in our in vivo awake goat model that PRG perturbations/lesions would decrease sensitivity to hypercapnia and hypoxia.
METHODS
For this study, we used adult, female goats. Their large size permits chronic implantation of stainless steel cannula into the brain stem, which enables administration of substances to target sites during physiological conditions. Furthermore, our laboratory has considerable background data concerning the normal hypoxic and hypercapnic ventilatory responses in goats (13, 21). Physiological data were acquired from 14 female adult goats, weighing 46.4 ± 1.9 kg. Six additional goats (44.1 ± 2.9 kg) were used for control histological purposes only. Goats were housed and studied in an environmental chamber with a fixed ambient temperature and photoperiod. All goats were allowed free access to hay and water, except during periods of study, for which they were trained to stand comfortably in a stanchion. All aspects of the study were reviewed and approved by the Medical College of Wisconsin Animal Care Committee before the studies were initiated.
Experimental design.
The study reported herein was part of two larger studies that investigated respiratory rhythm and pattern generation by elucidating the effects of 1) attenuating cholinergic modulation in the PRG through microdialysis (MD) of the muscarinic receptor antagonist atropine and 2) lesioning sites in the PRG by injections of the neurotoxin ibotenic acid (IA). To achieve these desired objectives, each goat underwent two surgeries: 1) an initial surgery in which instrumentation necessary for the monitoring of physiological signals was implanted and 2) a brain surgery in which cannula were bilaterally implanted into the rostral pons (Fig. 1). After both surgeries, the animals were allowed to recover for at least 2 wk (Fig. 1). To gain insight into the effect of perturbations within the PRG on hypoxic and hypercapnic ventilatory sensitivities, responses were assessed at four time points: 1) before the cannula implantation surgery, 2) subsequent to cannula implantation surgery, 3) on days after completion of atropine MD studies, and 4) on days after completion of the IA injection studies (Fig. 1). Our study was not designed to test whether dialysis of atropine into the PRG would affect these responses. Rather, our intent was to assess these responses days after the atropine dialysis and before the IA injections to ensure that the responses were not unexpectedly changed over the 2-wk interval of the dialysis studies. However, for reasons described in results, we did assess hypoxic sensitivity in one goat during a 45-min period of atropine dialysis, which was the time duration in all dialysis studies. We never performed any chronic atropine dialysis studies. One week after the final injection of IA, the goats were killed and histological analyses were performed on the brain stem (Fig. 1). The entire experimental protocol was ∼11 wk in duration.
Fig. 1.
Experimental design. Each goat underwent 2 surgeries; after full recovery and training, hypoxic and hypercapnic ventilatory responses were established. Results shown outline the effects of cannula implantation, atropine microdialysis (MD), and ibotenic acid (IA) injections (50 mM, 1 and 10 μl separated by 1 wk) on hypoxic and CO2 responses. Each gray box indicates approximately 1 wk.
Surgical procedures.
Animals were anesthetized with a mixture of ketamine and xylazine (15 and 1.25 mg/kg, respectively), intubated, and mechanically ventilated with 2.5% isoflurane in 100% oxygen. All surgeries were performed under sterile conditions. A preparatory surgery was first performed in which a 5-cm segment of each carotid artery was isolated from the vagi and elevated subcutaneously, so as to facilitate future placement of chronic catheters for sampling and monitoring. Bipolar electromyographic electrodes, electroencephalographic electrodes, and electrooculographic electrodes were also implanted for reasons related to the two larger studies on these animals, but no data on these signals will be reported herein. Ceftiofur sodium (Naxcel; 4 mg/kg) was administered intramuscularly (daily) for 1 wk after surgery to minimize infection. Buprenorphine hydrochloride (Buprenex; 0.005 mg/kg) was administered intramuscularly (twice daily) for 2 days to mitigate pain.
After ≥3 wk, we performed a second surgery to chronically implant stainless steel cannula (70 mm length, 1.27 mm outer diameter, 0.84 mm inner diameter) bilaterally into sites within the rostral pons. An occipital craniotomy was created through a posterior midline incision, and the dura mater was excised to expose the posterior cerebellum and medulla for visualization of obex. To standardize stereotaxic coordinates, the orientation of the dorsal medullary surface, obex, and the midline were used to determine the dorsoventral, rostrocaudal, and mediolateral planes, respectively. To target the PRG in general and to target specific subnuclei within the PRG, an “angled” approach was used in which cannula were inserted caudal to the superior sagittal sinus and through the mid-cerebellum at angles of 10.5–24° from normal (relative to the dorsal medullary surface), depending on the desired rostrocaudal coordinates. Given the subnucleus of choice, cannula implantation coordinates were adjusted within a range of coordinates: 0–2 mm ventral, 4–5 mm lateral, and 20–24 mm rostral to respective reference points. Symmetrical coordinates were used for bilateral implantation in any given goat. Coordinates were changed among goats so that, in some goats, the cannula were implanted just dorsal to the LPBN, in others just dorsal to the MPBN, and in still others just dorsal to the KFN. After placement, cannula were anchored to the surrounding bone using screws and dental acrylic, and a stainless steel stylet was inserted to maintain patency. After full recovery, these cannula were used for focal administration of atropine and IA to target brain areas.
Experienced laboratory personnel continuously monitored the goats (for at least 24 h) after brain surgery until stable conditions were achieved. Buprenorphine was administered for pain as previously described. Chloramphenicol (20 mg/kg) was administered intravenously (three times per day) for 3 days to minimize infection, as was dexamethasone (decreased from 0.4 to 0.05 mg/kg iv, three times per day) for 7 days to minimize swelling. Thereafter, ceftiofur sodium and gentamycin (Gentamax 100; 6 mg/kg im, daily) were administered chronically.
Protocols and physiological measurements.
Studies commenced ≥2 wk after the initial instrumentation surgery. For all studies, the goats were standing in a stanchion and visually monitored to ensure their alertness (eyes open). A custom-fitted mask was secured to the goat's muzzle, with a two-way breathing valve attached to the mask. A pneumotachometer was attached in series with the inspiratory side to measure flow via a computer data-acquisition system. A spirometer was connected to the expiratory side, allowing determination of expired volume and concentrations of CO2 and O2 to calculate metabolic rate. A chronically placed catheter in the elevated carotid artery was used to continuously record arterial blood pressure and heart rate and for collection of blood samples to obtain arterial pH, arterial Pco2 (PaCO2), and arterial Po2 (PaO2) values. Body temperature was measured rectally at regular intervals and during every arterial blood draw.
To assess the hypercapnic ventilatory response, goats were first monitored for 30 min breathing room air, and whole body CO2 sensitivity was assessed by increasing inspired CO2 to 3, 5, and 7% at 5-min intervals. Arterial blood was sampled over the last 2 min of each level of inspired CO2. CO2 sensitivity was expressed as ΔV̇i/ΔPaCO2, where V̇i is pulmonary ventilation. To assess the hypoxic ventilatory response, goats were first monitored for 30 min of room air breathing, followed by 30 min of breathing a 10.8% oxygen gas mixture (N2 balance). The concentration and duration of hypoxic gas mixture were chosen because, as previously shown in goats (13), this level of oxygen elicits a three-phase ventilatory response within 30 min, thereby providing three different physiological mechanisms for study. PaCO2 was not controlled; we used hypocapnia itself as one index of the hypoxic response. Arterial blood was sampled in duplicate during room air controls, at 6 and 26 min of hypoxia, and at 10 min of recovery from hypoxia (room air).
Data and statistical analyses.
The blood pressure and airflow signals were calibrated against known values. The calibrated signals were then rectified, time averaged, and converted to a “.txt” file before they were inputted into a custom-designed program, which provided an output of all parameters on a breath-by-breath basis [V̇i (l/min), breathing frequency (breaths/min), Vt (l/min), Ti and Te (s), heart rate (HR; beats/min), mean arterial blood pressure (mmHg)]. For the entire period of the protocol, breath-by-breath values were averaged into 60-s bins and expressed in either their raw form or as a percentage of the mean of the control period. In addition, to evaluate phases 1 and 2 of the hypoxic response at a higher resolution, the last 1 min of the control period and the first 6 min of hypoxia were binned into 10-s intervals. The statistical analysis of the 10- and 60-s data sets yielded consistent results; thus data from only the 60-s data set are presented herein.
To test whether the variables measured during room air breathing changed significantly (P < 0.05) over the course of the series of studies and whether there were differences between animals with different sites of cannula implantation, a two-way ANOVA and Tukey's post hoc analysis were used on all variables. Similarly, to test whether arterial blood gases and pH measured during room air breathing and CO2 sensitivity significantly changed (P < 0.05) over the course of the series of studies and whether there were differences between animals with different sites of cannula implantation, a two-way ANOVA with Tukey's post hoc analysis was used on the measured values. For LPBN, MPBN, and KFN grouped ventilatory and cardiovascular data, a two-way ANOVA with Tukey's post hoc analysis was used to test whether the variables expressed as a percentage of the control period were significantly changed over the time course of the hypoxia protocol and whether there were differences over the course of the series of studies. To test whether O2 consumption (V̇o2) and body temperature significantly changed (P < 0.05) over the time course of the hypoxia protocol, a paired t-test was used on raw V̇o2 and the change in raw body temperature values. To test whether the cumulative effect of all perturbations (cannula implantation, dialysis, and IA) significantly altered (P < 0.05) the number of neurons and remaining area per nucleus over the rostrocaudal distance and whether there were differences between animals with different sites of cannula implantation, a two-way ANOVA and Tukey's post hoc analysis were used on respective mean data.
Histological analyses.
One week after the last IA injections, all goats were euthanized (Beuthanasia, intravenously), and the brain was perfused with physiological buffer solution (PBS) and fixed with 4% paraformaldehyde in PBS. The brain stem was excised and placed in 4% paraformaldehyde in PBS for 24 h and then in 20% and 30% sucrose solutions, respectively. The brain stem was frozen and serially sectioned (25 μm) from obex to the superior colliculi in a transverse (n = 19) or sagittal (n = 1) plane. The sections were adhered to slides coated with gelatin-chrome-alum. Sections were acquired such that every fourth section was contained within a respective “series.” Thus there were four series in total; within a series, each section was 100 μm from the next section in sequence, allowing for high-resolution neuronal and anatomic profiling. One series was stained for Nissl substance to profile the total number of neurons. A second series was stained for muscarinic type-2 immunoreactivity by complexing anti-muscarinic type-2 receptor primary antibody (from Millipore, 1:200 dilution) with biotinylated anti-mouse secondary antibody (from Vector, 1:100 dilution). After the antibody-antigen complex was incubated, it was localized by avidin (Vector ABC Elite) and developed with diaminobenzene. A third series was stained with hematoxylin and eosin to identify living and dead neurons. Dead neurons were stained pink and were round in shape, whereas living neurons were stained dark purple and were amorphous in shape (8). The fourth series was used for purposes unrelated to this manuscript. Target nuclei were identified using all of these stains, and neuron counts and area quantifications were made (every 200 μm) using Metamorph software and standardized procedures.
RESULTS
Cannula placement and lesion characterization.
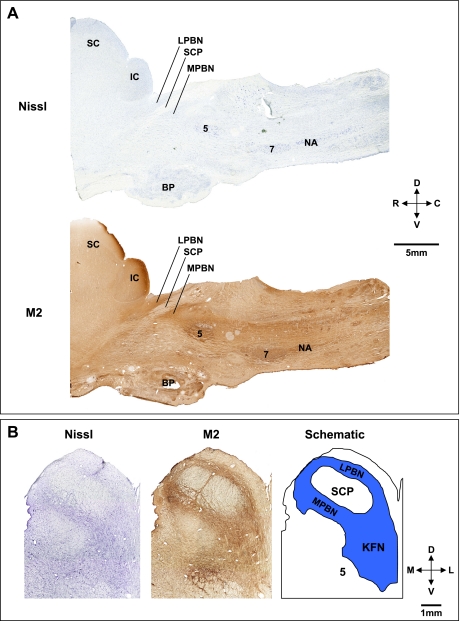
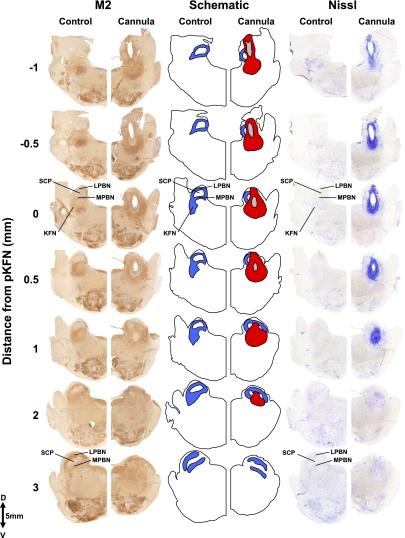
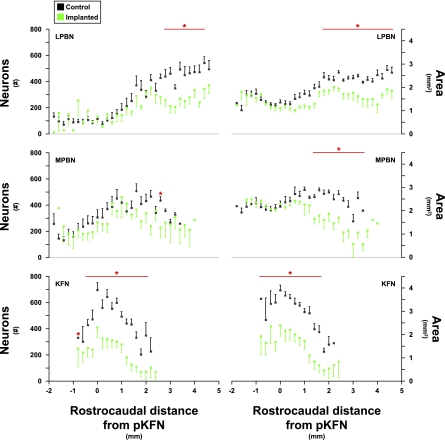
Figure 2, A and B, shows sagittal and transverse pontine images, respectively, from control goats and illustrates the orientation of the PRG within the brain stem. The dark brown areas in Fig. 2 reflect positive staining for the muscarinic type-2 receptor, implicating a role for cholinergic mechanisms in PRG function. Indeed, multiple muscarinic receptor subtypes have been characterized in numerous respiratory nuclei, including the PRG (23). In goats, the morphology of the LPBN and MPBN was quite different from that of the KFN. The KFN is quite confined, spanning only 2–3 mm rostrocaudally, and it is located more ventral and lateral than the LPBN and MPBN (Figs. 3 and 4). The LPBN and MPBN are more widespread, spanning a rostrocaudal distance of 6–8 mm (Fig. 4). Accordingly, it was only possible to target and lesion part of the LPBN and MPBN, whereas more comprehensive lesioning of the KFN was possible (Figs. 3 and 4). As a result, neuron deficits in the LPBN and MPBN were created only in their respective rostral area, whereas the KFN was lesioned throughout the nucleus (Fig. 4, Table 1).
Fig. 2.
Histochemical and immunohistochemical staining for Nissl substance and muscarinic type-2 (M2) receptors provide anatomic characterization of the pontine respiratory group (PRG) in goats. A: sagittal sections 4.9 mm lateral to the midline, illustrating the location in the rostral, dorsal pons of the lateral (LPBN) and medial (MPBN) parabrachial nuclei relative to the superior cerebellar peduncle (SCP). B: transverse Nissl and M2 sections and a schematic to further illustrate the location of the LPBN, MPBN, and Kölliker-Fuse nucleus (KFN). The superior (SC) and inferior colliculi (IC), trigeminal motor nucleus (5), basal pons (BP), facial nucleus (7), and nucleus ambiguus (NA) are labeled for reference. D, dorsal; V, ventral; R, rostral; C, caudal; M, medial; L, lateral.
Fig. 3.
Histochemical and immunohistochemical staining for Nissl substance and M2 receptors of hemisections from 1 control goat and 1 goat with cannula implanted into the KFN. These hemisections illustrate the rostral-caudal changes in the LPBN and MPBN and KFN beginning 1 mm caudal to the peak in number of KFN neurons and extent to 3 mm rostral to the peak. Blue shaded area illustrates the orientation of the LPBN, MPBN, and KFN relative to the SCP. The tract of the cannula (in gray) extends over 2 mm, and the area of devoid of neurons (in red) extends over 3 mm in the rostral-caudal direction. Note the clear presence of the KFN at its peak number of neurons (0 mm) and its absence at a more rostral distance (3 mm).
Fig. 4.
Number of neurons and intact area of control (black symbols) and lesioned (green symbols) goats in the LPBN, MPBN, and KFN caudal and rostral to the peak number of neurons in the KFN. Red lines and asterisks indicate values where neuron counts and area of intact nuclei were reduced significantly (P < 0.05) in the cannula-implanted goats. For each group, the distal edge of the cannula was just dorsal to the LPBN, MPBN, or KFN; thus, the differences between control and lesioned goats shown were not due to physical destruction by the cannula. Note the 6-mm rostral-caudal extent of the LPBN and MPBN, whereas the KFN only extents over 3 mm.
Table 1.
Number of neurons and the intact area (expressed as percent of control) of the LPBN, MPBN, and KFN in lesioned goats
| Neurons/Section |
Area/Section |
|||||
|---|---|---|---|---|---|---|
| Cannula Implantation Site | LPBN | MPBN | KFN | LPBN | MPBN | KFN |
| LPBN | 91 ± 10 | 94 ± 16 | 101 ± 13 | 101 ± 6 | 91 ± 4 | 85 ± 6 |
| MPBN | 73 ± 12 | 73 ± 14 | 92 ± 8 | 67 ± 5* | 73 ± 5* | 88 ± 6 |
| KFN | 68 ± 15 | 51 ± 11 | 38 ± 7* | 62 ± 7* | 52 ± 9* | 40 ± 8* |
Values are means ± SE. Number of neurons and the intact area of the lateral (LPBN) and medial (MPBN) parabrachial nuclei and the Kölliker-Fuse nucleus (KFN) were reduced in all goats after completion of the studies (in percentage of control). For each group, the cannula tip extended to just dorsal of the nucleus; thus, for the MPBN group, the cannula insertion through the LPBN caused considerable destruction, whereas, in the KFN group, the cannula insertion damaged both the LPBN and MPBN.
Values in lesioned goats that are significantly (P < 0.05) decreased from values in control goats.
Based on identification of the distal most tract created by the implanted cannula, goats with implanted cannula were divided into three anatomic groups as follows: 1) LPBN (n = 4), 2) MPBN (n = 4), and 3) KFN (n = 6). Because the dialysis probe was inserted just distal to the tip of the cannula and the injection tubes were inserted only to the tip of the cannula, we reasoned that the major effect of dialysis and injections would be on neurons immediately distal to the tract; thus, the goats were grouped according to the PRG subnucleus at the cannula tip. However, we recognize that there could be diffusion in all directions, including dorsally along the outer wall of the cannula. In addition, in the MPBN group, the physical lesion of the cannula as it penetrated through the LPBN would destroy dendritic connections with the MPBN, and, in the KFN group, physical destruction occurred in both the LPBN and MPBN (35). The extent of this physical destruction is shown in Table 1 by the deficits of neurons in the LPBN of the MPBN group and the LPBN and MPBN of the KFN group. Accordingly, the dialysis and injection effects could be cumulative and not due solely to neurons distal to the cannula tract. Nevertheless, the effects of perturbations and lesions are presented as associated with specific subnuclei, but we recognize that this might be an oversimplification.
Room air breathing and controls.
In the days after cannula implantation surgery, goats hyperventilated (data not shown), as previously observed (44). After a recovery of at least 2 wk, V̇i during room air breathing was decreased (P < 0.05) compared with that shown at preimplantation by an average of 1 l/min at postcannula implantation, postatropine MD, and post-IA injection time points (Table 2). This decrease in V̇i was due to a 0.06 l/breath decrease (P < 0.05) in Vt (Table 2) and secondary to a decrease in V̇o2 (Table 3). Resting PaO2 (Table 3) and PaCO2 (Table 4) were within normal limits for goats throughout the series of studies.
Table 2.
V̇i, f, and Vt before and after cannula implantation surgery, after atropine microdialysis, and after ibotenic acid injection
| V̇i, l/min |
f, breaths/min |
Vt, l/breath |
|||||||
|---|---|---|---|---|---|---|---|---|---|
| LPBN | MPBN | KFN | LPBN | MPBN | KFN | LPBN | MPBN | KFN | |
| Preimplant | 8.59 ± 1.25 | 6.27 ± 0.43 | 7.79 ± 0.78 | 16.56 ± 0.60 | 16.47 ± 0.90 | 17.84 ± 1.16 | 0.53 ± 0.07 | 0.40 ± 0.04 | 0.46 ± 0.04 |
| Postimplant | 6.76 ± 1.18* | 6.39 ± 0.60 | 6.77 ± 0.30* | 19.77 ± 1.60 | 18.63 ± 1.46 | 17.93 ± 1.06 | 0.38 ± 0.07* | 0.35 ± 0.02* | 0.40 ± 0.02* |
| Post-Atr MD | 6.67 ± 0.30* | 6.31 ± 0.58 | 6.85 ± 0.36* | 17.85 ± 1.72 | 19.11 ± 0.98 | 16.16 ± 1.23 | 0.42 ± 0.04 | 0.34 ± 0.02* | 0.47 ± 0.04 |
| Post-IA injection | 6.26 ± 0.71* | 6.14 ± 0.59 | 6.44 ± 0.46* | 15.90 ± 2.31 | 16.66 ± 1.05 | 15.48 ± 1.10 | 0.43 ± 0.04 | 0.38 ± 0.02 | 0.45 ± 0.03 |
Values are means ± SE. For each implantation group, the pulmonary ventilation (V̇i), breathing frequency (f), and tidal volume (Vt) are shown before and after cannula implantation surgery, after atropine (Atr) microdialysis (MD) studies, and after ibotenic acid (IA) injection studies. Postimplant, post-Atr MD, and post-IA injection V̇i were decreased (
P < 0.05) compared with preimplant V̇i, and postimplant Vt was decreased (*P < 0.05) compared with preimplant Vt.
Table 3.
PaO2, V̇o2, and body temperature for all studies in every implanted group
| PaO2, Torr |
V̇o2, l·min−1·Torr−1 |
||||||
|---|---|---|---|---|---|---|---|
| Study | Control | 6 min Hypoxia | 26 min Hypoxia | Recovery | Control | 26 min Hypoxia | Temperature, Δ°C from start to end of study |
| LPBN | |||||||
| Preimplant | 104 ± 11 | 30 ± 1 | 31 ± 2 | 100 ± 4 | 266 ± 17 | 547 ± 101* | 1.3 ± 0.2* |
| Postimplant | 92 ± 11 | 28 ± 2 | 29 ± 1 | 93 ± 4 | 237 ± 24 | 416 ± 36* | 1.2 ± 0.2* |
| Post-Atr MD | 97 ± 3 | 29 ± 1 | 28 ± 1 | 89 ± 3 | 265 ± 47 | 445 ± 59* | 0.9 ± 0.1* |
| Post-IA injection | 90 ± 3 | 28 ± 1 | 27 ± 1 | 90 ± 4 | 242 ± 33 | 404 ± 49* | 1.0 ± 0.2* |
| MPBN | |||||||
| Preimplant | 101 ± 4 | 31 ± 1 | 28 ± 1 | 101 ± 3 | 246 ± 23 | 441 ± 81* | 0.9 ± 0.2* |
| Postimplant | 92 ± 6 | 29 ± 1 | 28 ± 2 | 94 ± 5 | 241 ± 21 | 471 ± 26* | 1.6 ± 0.4* |
| Post-Atr MD | 102 ± 6 | 30 ± 1 | 28 ± 2 | 98 ± 6 | 211 ± 29 | 382 ± 73* | 0.8 ± 0.3* |
| Post-IA injection | 104 ± 5 | 33 ± 1 | 31 ± 2 | 104 ± 5 | 260 ± 62 | 529 ± 193* | 1.1 ± 0.2* |
| KFN | |||||||
| Preimplant | 97 ± 4 | 30 ± 1 | 29 ± 1 | 94 ± 2 | 246 ± 25 | 526 ± 70* | 1.1 ± 0.2* |
| Postimplant | 92 ± 2 | 28 ± 1 | 29 ± 1 | 95 ± 2 | 221 ± 16 | 422 ± 50* | 1.3 ± 0.2* |
| Post-Atr MD | 101 ± 3 | 31 ± 1 | 29 ± 1 | 98 ± 6 | 228 ± 19 | 234 ± 29 | 0.1 ± 0.1 |
| Post-IA injection | 98 ± 5 | 31 ± 1 | 30 ± 1 | 95 ± 6 | 235 ± 12 | 278 ± 45 | 0.3 ± 0.3 |
Values are means ± SE. For all studies in every implanted group, arterial Po2 (PaO2) was uniformly decreased (P < 0.05) during hypoxia, with a return to control levels during room air recovery. In LPBN and MPBN goats during all studies and in KFN goats before and after implant of the cannula, metabolic rate (V̇o2) and body temperature during hypoxia were increased significantly (
P < 0.05) relative to control values. However in KFN goats, V̇o2 and body temperature were unchanged from control levels during hypoxia subsequent to Atr MD studies and IA injection studies.
Table 4.
PaCO2 and CO2 sensitivity for all cannula-implantation groups
| Resting PaCO2, Torr |
CO2 Sensitivity, l·min−1·Torr−1 |
|||||
|---|---|---|---|---|---|---|
| Study | LPBN | MPBN | KFN | LPBN | MPBN | KFN |
| Preimplant | 39.6 ± 0.4 | 41.6 ± 0.7 | 41.2 ± 0.7 | 2.67 ± 0.31 | 2.07 ± 0.18 | 2.36 ± 0.28 |
| Postimplant | 40.3 ± 1.5 | 43.1 ± 1.8 | 39.7 ± 0.4 | 2.41 ± 0.21 | 1.82 ± 0.26 | 1.98 ± 0.24 |
| Post-Atr MD | 41.3 ± 0.7 | 43.8 ± 1.8 | 39.9 ± 0.6 | 2.34 ± 0.21 | 1.83 ± 0.28 | 2.15 ± 0.26 |
| Post-IA injection | 40.5 ± 1.7 | 39.9 ± 0.6 | 38.9 ± 1.0 | 2.19 ± 0.21 | 2.12 ± 0.17 | 2.22 ± 0.20 |
Values are means ± SE. CO2 sensitivity is defined as the slope of the relationship between pulmonary ventilation (l/min) and PaCO2 (Torr). For all cannula-implantation groups, the resting arterial Pco2 (PaCO2) and CO2 sensitivity were unaffected by cannula implantation, MD of Atr, or injection of IA perturbations. Furthermore, there was no significant difference between the 3 groups of goats.
In one control goat, a craniotomy was performed without implantation of cannula to determine whether the craniotomy per se affected the ventilatory response to hypercapnia and/or hypoxia in a time-dependent manner. This animal was studied weekly for 10 wk, and we found no time-dependent change in measured parameters (data not shown).
Hypercapnic ventilatory response.
The normal hypercapnic ventilatory responses in goats to three 5-min periods of 3, 5, and 7% inspired CO2 showed a stepwise increase in V̇i. The index of the response (CO2 sensitivity; l·min−1·Torr−1) was unaltered by any perturbations/lesions in the PRG and was normal for goats (Table 4).
Hypoxic ventilatory response.
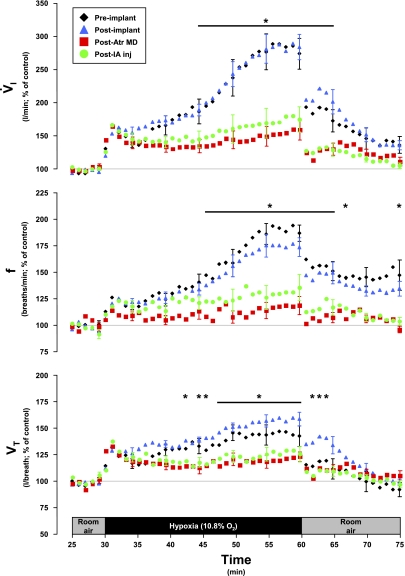
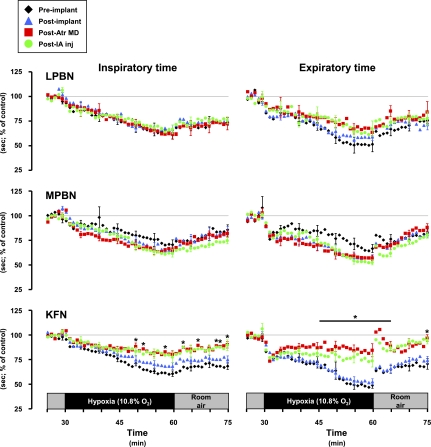
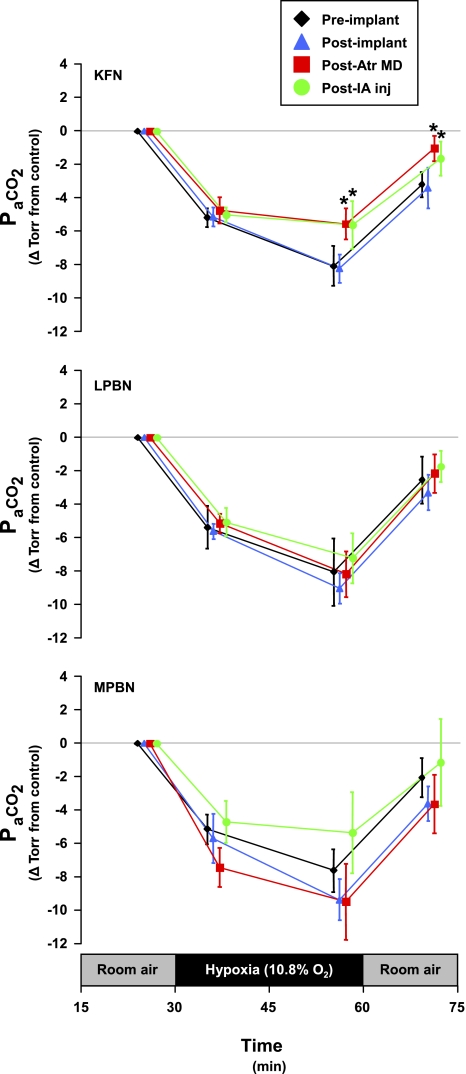
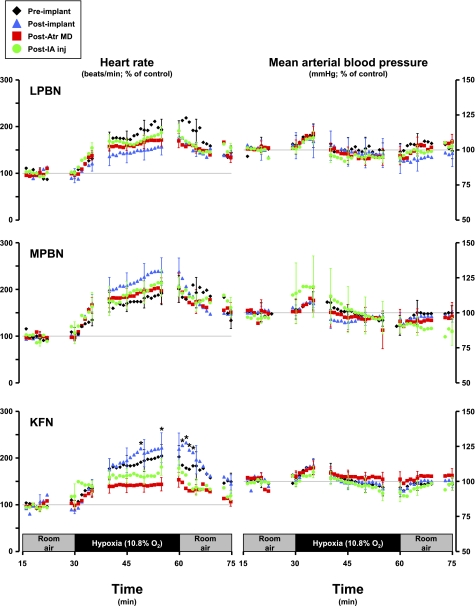
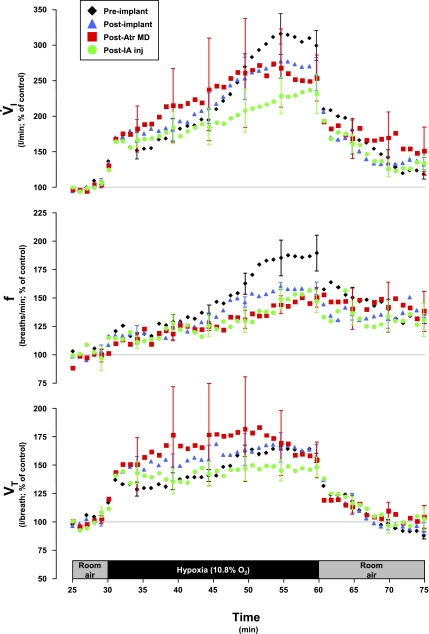
In goats, exposure to 10.8% O2 (N2 balance) decreased PaO2 to <30 Torr (P < 0.001, Table 3). As shown in Fig. 5 (preimplant), the typical ventilatory response to hypoxia was triphasic with primary (1°) response being an immediate (∼1–3 min) spike in V̇i, followed by a secondary (2°) “roll-off” (∼3–6 min) in V̇i, and finally a tertiary (3°) prolonged (∼6–30 min) and robust increase in V̇i. The 3° ventilatory response was associated with shivering and increased (P < 0.05) V̇o2 and body temperature (Table 3, preimplant). Upon room air recovery, the response was somewhat reciprocal in nature, with a 1° spiked decrease in V̇i, a 2° increase, and a more prolonged 3° decline back to control levels (Fig. 5, preimplant). Breathing frequency and Vt changed during and after hypoxia similar to V̇i (Fig. 5), whereas both Ti and Te decreased during hypoxia (Fig. 6). CO2 levels were not controlled in these hypoxic studies, and hyperventilation occurred in proportion to the hyperpnea (Fig. 7, KFN preimplant). Heart rate increased during hypoxia (P < 0.05), but there was no significant (P > 0.10) change in mean arterial blood pressure (Fig. 8).
Fig. 5.
Pulmonary ventilation (V̇i), breath frequency (f), and tidal volume (Vt) increased during hypoxia in 3 phases and in the KFN goats; the third phase was attenuated (P < 0.05) subsequent to the atropine (Atr) MD studies. This attenuation was maintained subsequent to IA injection (inj) studies. Note that the primary and secondary hypoxic ventilatory responses were well conserved despite the perturbations. Data are shown in 60-s bins, with SE bars shown every 5th bin for clarity.
Fig. 6.
Inspiratory and expiratory time decreased (P < 0.05) during hypoxia, but the decreases were attenuated (P < 0.05) in the Kölliker-Fuse-implanted goats subsequent to the atropine dialysis studies.
Fig. 7.
Exposure to hypoxia resulted in a significant (P < 0.05) hyperventilation; however, in KFN goats, the hypoxic hyperventilation was attenuated (P < 0.05) subsequent to atropine MD studies and IA injection studies. This attenuation was continued into the room air recovery period. In LPBN and MPBN animals, there were no significant effects of any perturbation/lesion on any phase of the hypoxic hypocapnia. Although not significant, note that hypoxic hypocapnia in MPBN animals was not as uniform as in LPBN animals. Data are shown at each arterial blood draw within the study protocol (5 min prehypoxia control, 6 and 26 min hypoxia, and 10 min posthypoxia recovery). PaCO2, arterial Pco2.
Fig. 8.
Heart rate increases significantly (P < 0.05) during hypoxia, but the increase was significantly (P < 0.05) attenuated in KFN goats subsequent to the atropine dialysis studies. Hypoxia did not significantly (P > 0.05) affect the mean arterial blood pressure in any group of goats.
In KFN goats, hyperpnea results during the 1° and 2° hypoxic responses were not changed (P > 0.10) by any perturbation/lesion (Fig. 5). However, the 3° hypoxic and the room air recovery responses were attenuated (P < 0.05) after MD of atropine. The 3° V̇i in preatropine MD studies was 289% of control, whereas the 3° V̇i in postatropine MD studies was 159% of control (Fig. 5). The attenuation of the V̇i response was due to decreases in both breathing frequency and Vt (Fig. 5), and Ti and Te decreased less during hypoxia than during the preatropine studies (Fig. 6). In addition, after MD of atropine, the goats did not shiver and no significant increases (P > 0.05) in metabolic rate or body temperature during hypoxia were shown (Table 3). Finally, after MD of atropine, HR response to hypoxia was attenuated (Fig. 8). Subsequent to injection of IA into the KFN, all three phases of the hypoxic ventilatory response were not significantly (P > 0.10) different from results shown for postatropine MD studies (Fig. 5). Specifically, the phase 3 of the hypoxic response remained attenuated after injection of IA.
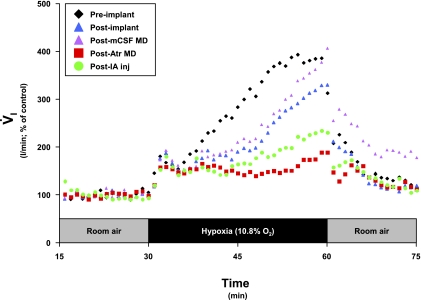
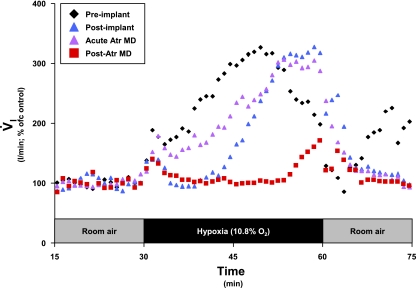
To determine whether the previously described postatropine MD effects were due to a chronic effect of atropine or due to MD per se, in one goat we performed two entire series of MD studies. In the first series, we only dialyzed mock cerebrospinal fluid (mCSF) during the 3-day and 3-night studies. After completing this series, we assessed the hypoxic response and found it was not altered from the postimplant studies (Fig. 9). We then performed a second or the usual 3-day and 3-night atropine dialysis studies. Three and five days after these studies, the 3° hypoxic response was attenuated from both postimplant controls and post-mCSF MD studies (Fig. 9). Consequently, the attenuated 3° response to hypoxia is specifically due to a factor associated with dialysis of atropine and not due to dialysis per se. Note that the 1° and 2° responses were unaffected by any perturbations/lesions (Fig. 9).
Fig. 9.
In a Kölliker-Fuse-implanted goat, the attenuation in the third phase of the V̇i response to hypoxia was due specifically to actions of atropine, as opposed to any effect from MD of mock cerebrospinal fluid (mCSF) alone. Note that during the third phase of the hypoxic ventilatory response, the post-mCSF MD (purple triangles) and postimplant (blue triangles) series were closely aligned, whereas the post-Atr MD (red squares) series was attenuated relative to the 2 aforementioned series. Each series is an average of 2 studies, with data shown in 60-s bins.
To determine whether atropine MD acutely attenuates the hypoxic response, in one goat (different goat from Fig. 9), we performed another special series of studies. In this goat, the distal end of the cannula was at the rostral edge of the KFN; thus, dialysis was within the KFN. Preimplantation and postimplantation hypoxic responses were assessed as usual. However, instead of performing 3-day and 3-night atropine MD studies as in all other animals, we completed only 2-day atropine studies. In these two studies, atropine in mCSF was bilaterally dialyzed for 45 min, with the hypoxic response assessed over the last 30 min. As shown in Fig. 10, acute MD of atropine did not attenuate the hypoxic ventilatory response. However, in studies 3 and 5 days thereafter, the chronic or carryover effect of atropine attenuated the response to hypoxia (Fig. 10). This goat was killed without any IA injections. The postmortem tissue analysis indicated that the number of neurons in the KFN (site of atropine dialysis) was within the variation of control goats (data not shown); thus the attenuated response to hypoxia was not due to destruction of KFN neurons.
Fig. 10.
In a Kölliker-Fuse implanted animal (different goat from Fig. 9), the attenuation in V̇i was due to chronic effects of atropine, as opposed to acting acutely. Note that during the third phase of the hypoxic ventilatory response, the acute Atr MD (purple triangles) and postimplant (blue triangles) series were closely aligned, whereas the post-Atr MD (red squares) series was attenuated relative to the 2 aforementioned series. Each series is an average of 2 studies, with data shown in 60-s bins.
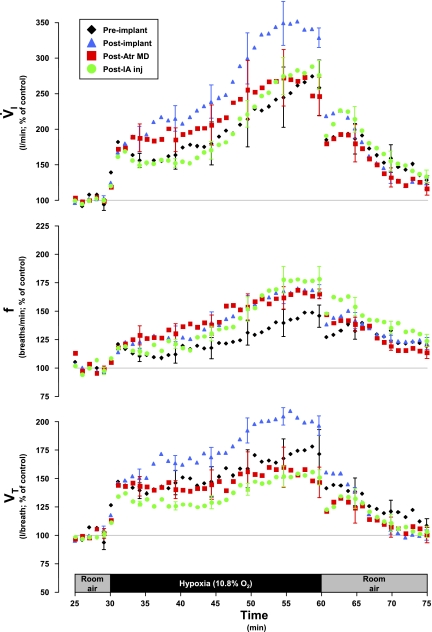
In LPBN and MPBN animals, the 1° responses to hypoxia were unaffected by any perturbation/lesion (Figs. 11 and 12). However, subsequent to cannula implantation surgery and persistent through atropine MD studies and IA studies, the 2° and 3° responses in these groups were quite variable, but there were no statistically significant (P > 0.05) differences between the four assessments of the responses (Figs. 11 and 12). In three of these eight goats, whose 3° response was not altered by atropine MD, the responses were attenuated subsequent to IA injection. In these goats, recovery to room air was largely consistent regardless of any perturbations/lesions. Hypoxic hypocapnic (Fig. 7), metabolic rate (Table 3), and body temperature (Table 3) effects were not significantly affected by any perturbation/lesion in the LPBN and MPBN.
Fig. 11.
In LPBN animals (n = 4), V̇i, f, and Vt were not significantly affected by any perturbation on any phase of the hypoxic ventilatory response. However, there was considerable variation among the goats in these responses. Data are shown in 60-s bins, with SE bars shown every 5th bin for clarity.
Fig. 12.
In MPBN animals (n = 4), V̇i, f, and Vt were not significantly affected by any perturbation on any phase of the hypoxic ventilatory response. However, there was considerable variation among the goats in these responses. Data are shown in 60-s bins, with SE bars shown every 5th bin for clarity.
DISCUSSION
Summary.
There were two major findings in the present study. First, perturbing/lesioning portions of the LPBN, MPBN, and KFN did not chronically alter eupneic PaCO2, CO2 sensitivity, or the phase 1 and 2 responses to hypoxia. Second, after perturbations/lesions of the KFN, the ventilatory, metabolic, body temperature, and blood gas responses during the phase 3 hypoxic responses were altered. Our hypothesis regarding hypercapnic and hypoxic sensitivities was partially validated, in that the phase 3 ventilatory response to hypoxia was altered in KFN animals, but the phase 1 and 2 hypoxic responses and the hypercapnic ventilatory response were unaffected in all animals.
Limitations.
A constraint of this study was our inability to unequivocally define the anatomic regions affected by MD of atropine and injection of IA. The grouping of the goats was based on extensive quantitative histological analysis, but the administration of atropine and IA may have diffused beyond the parameters utilized (absence and disruption of tissue, presence and absence of living and dead neurons, and expression of muscarinic receptors) to designate the respective target nuclei. Exactly how far and to what extent these molecules diffused was dependent on numerous factors, including molecular mass and rate of diffusion, metabolism and clearance, anatomic morphology, and the cannula itself. Although the effects were most consistent when dialysis probes were within the KFN or when IA was injected into the KFN, we cannot rule out diffusion to more than one subnucleus. Moreover, the effects of atropine and IA administered to the KFN may in part be due to the cumulative effect of destroying dendritic connections when during implantation the cannula penetrated the LPBN and MPBN (35). As a result, we are not justified in concluding site-specific effects of atropine and IA and simply conclude that the most consistent effects were with perturbations in the KFN.
Absence of effect on hypercapnic ventilatory response.
Our finding that PRG perturbations/lesions do not affect the ventilatory response to hypercapnia is in contrast to findings of others (11, 26, 36, 38, 39). Gautier and Bertrand (11) found that bilateral lesions in the pneumotaxic center increased Vt, Ti, and Te in awake cats that breathed room air and when inspired CO2 was increased, but overall ventilatory sensitivity was not changed by the lesions (11). In decerebrate cats, St. John (38) demonstrated that PRG ablation diminished the frequency response to hypercapnia and did not alter the Vt response, thus suppressing the minute volume response to hypercapnia. He concluded that the PRG influences the PaCO2 set point for respiratory activity. In anesthetized, vagotomized rats, Song and Poon (36) showed that kainic acid lesions in the LPBN decreased the breathing frequency in response to hyperoxic hypercapnia by prolonging expiratory duration. They concluded that central chemoafferent inputs are organized to separately modulate inspiratory drive and Ti and Te in conjunction with similar processing of peripheral chemoafferent inputs. Finally, Mizusawa et al. (26) found in awake rats 1 wk after large kainic acid induced lesions in the LPBN and KFN that the ventilatory response to hypercapnia was greatly attenuated. The size of the lesions was not well quantified in the previous studies, but the lesions may have been more extensive than the 62% destruction of the KFN and the 40–50% destruction in the LPBN and MPBN of our KFN group (Table 1). In some previous studies, the lesions were induced by kainic acid injections, which are known to cause widespread and distal lesions (32). Thus differences in lesion size and location and in species and, as indicated in the Introduction, in preparations (awake vs. anesthetized/decerebrate) are all factors that may account for differences between the past and present findings.
Previous data from our laboratory have shown that injection of IA into the pre-Bötzinger complex (21) or cerebellar fastigial nucleus (25) of intact goats permanently decreases CO2 sensitivity. Likewise, CO2 sensitivity is transiently attenuated after IA injection into the medullary raphe nucleus (18). Thus the present pontine data differ from previous studies in our laboratory in which we targeted medullary and cerebellar areas. Of potential importance is that the pre-Bötzinger complex (20, 34), the raphe nucleus (1, 19, 28), and the cerebellar fastigial nucleus (24, 46) are all documented chemoreceptor sites. It is not known whether KFN sites are chemosensitive, but absence of chemosensitivity in the KFN could be the explanation for the absence of perturbation/lesion effects on CO2 sensitivity. Accordingly, we conclude that the data of the present study do not support the concept that KFN neurons have a role in the ventilatory response to hypercapnia. However, our findings do not necessarily conflict with previous findings and concepts of others (30) regarding an important role of PRG nuclei in ventilatory responses to hypercapnia because as stated earlier, the portions of the PRG not presently lesioned may mediate the effects observed by others.
Hypoxic ventilatory response.
The normal hypoxic ventilatory response in goats has been previously reported by Gershan et al. (13). Fifteen minutes at 12% or 15% O2 produced an initial peak in minute ventilation, followed by a prolonged roll-off. However, 15 min at 9% O2 resulted in an initial peak in minute ventilation, a brief roll-off, and then a sharp sustained increase. Our findings during 30 min at 10.8% O2 elicited a similar response as that of the 9% by Gershan et al. Thus, between 12% and 10.8% O2, there is a change from a biphasic ventilatory response to a triphasic ventilatory response, respectively.
The 1° response to hypoxia is presumed to be a direct chemoreceptor effect. Hypoxemia is initially sensed at the carotid bodies, afferent stimulation is transmitted to the nucleus of the solitary tract, and brain stem sites of respiratory rhythm and pattern (potentially including the PRG) integrate this response and determine an appropriate ventilatory output. Our data do not provide support for the concept that the PRG contributes to the 1° ventilatory response to hypoxia.
The 2° roll-off response to hypoxia is well documented in several mammals, including rabbits (14), dogs (15), goats (13), monkeys (45), cats (31, 42), and ponies (22). The specific reason for this roll-off has not been established, but contributors may include hypocapnia, central hypoxic depression, and/or decreased metabolic rate. Our data do not provide evidence that the PRG significantly contributes to factors affecting the 2° ventilatory response to hypoxia.
The 3° response has not been systematically studied, but the data herein suggest that this response is temperature and metabolic rate related, secondarily affecting ventilation. Indeed, after the MD of atropine in KFN animals, the 3° ventilatory response was attenuated as was the metabolic rate- and temperature-related changes during this phase. Moreover, in LPBN and MPBN animals, the 3° ventilatory response varied between animals. Of these eight animals, cannula implantation affected three animals, MD of atropine affected two animals, and injection of IA affected three animals (data not shown).
In decerebrate cats, St. John (39) showed that pneumotaxic center ablation diminishes the breathing frequency response to hypoxia and hypercapnia, whereas the Vt response was augmented in response to hypoxia and unchanged in response to hypercapnia. Thus the minute volume response was maintained in response to hypoxia and suppressed in response to hypercapnia (39). Given these differential respiratory responses to hypoxia and hypercapnia following pneumotaxic center ablation, St. John (39) suggested that this was reflective of a difference in the brain stem integration of peripheral and central chemoreceptor afferent stimuli. The absence of a triphasic ventilatory response to hypoxia in St. John's studies does not permit direct comparison to the data presented herein. Nonetheless, our data support the concept of an integrative role for the KFN, including integration of factors responsible for the 3° responses to hypoxia such as metabolic rate and body temperature. If the KFN is serving an integrative role, there must be input from other sites. To integrate thermal, metabolic, and ventilatory responses, the KFN would likely receive input from the hypothalamus. Indeed, injections of an adeno-associated viral vector into the parabrachial nuclei of rats anterogradely showed terminal projections in the hypothalamus (5). Furthermore, Gautier (12) has emphasized that “the mechanisms involved in control of body temperature and those that account for the interactions with hypoxia are located in the hypothalamus” and that “common integrative structures are probably involved in the metabolic and ventilatory responses to hypoxia.” The common integrative structure suggested by Gautier could be the LPBN, as recently Poon (30) has synthesized data from several studies and proposed a model that “suggests that the LPBN may be important in balancing respiratory and thermal homeostasis.” The findings of the present study suggest that the KFN may contribute to this integrative function.
We have previously found that, after near total destruction of the pre-Bötzinger complex of goats, the 3° ventilatory response to hypoxia was attenuated (21), albeit to a lesser extent than that observed in the present data. Accordingly, these data suggest that 1) the pons is not unique in its modulation of the hypoxic ventilatory response and that 2) the 3° ventilatory responses to hypoxia may be more labile than the well conserved 1° response.
The PRG has been described as functionally and topographically heterogeneic (3, 4); thus it was not surprising that the effect of atropine was most profound in KFN animals. Indeed, the KFN is a key operant in numerous PRG-mediated functions, including apneusis (2, 10, 43), apnea (2, 10), hyperpnea (4), and inspiratory and expiratory (3, 7) facilitation. Additionally, considerable variation was observed in the 2° and 3° responses to hypoxia in LPBN and MPBN animals (see Figs. 11 and 12), further substantiating heterogeneic PRG function and topography.
We did not expect that atropine, a presumably “reversible” antagonist, would decrease the 3° phase of the hypoxic response 2–5 days subsequent to the completion of MD studies. The data in Fig. 9 show that the effect is not due to dialysis per se, and the data in Fig. 10 show that atropine does not acutely affect the hypoxic response but that the effect is a “carry-over” effect of atropine. Finally, this effect does not appear to be due to cell death because, in the goat whose responses are depicted in Fig. 10, atropine attenuated the hypoxic response yet postmortem tissue analysis indicated that the number of neurons in the KFN was within the variation of control goats. Despite these findings, we have not elucidated the mechanism, and we are unable to explain what caused the attenuation of the phase 3 hypoxic response days after dialysis of atropine.
Plasticity.
Although it was not the focus of this paper to investigate the plasticity regarding the acute effect of the perturbations/lesions, it is appropriate to question whether there was a time-dependent plasticity with regard to the hypoxic and hypercapnic ventilatory responses. Concerning this matter, the attenuated 3° ventilatory response to hypoxia in KFN-dialyzed animals was present some 4–6 wk after the atropine MD and IA injection studies. We cannot state with certainty whether the IA injections perpetuated this reduced response. However, of the LPBN and MPBN animals where MD of atropine did not affect the 3° response to hypoxia, three were affected by subsequent injections of IA. These data suggest that IA lesions subsequent to MD of atropine may have perpetuated the atropine-induced attenuated responses, overshadowing latent plasticity. Conversely, because hypoxic ventilatory responses were assessed in duplicate at each experimental time point, comparison of these pairs (2 to 3 days apart) showed no plasticity. Additionally, the goat whose data are shown in Fig. 10 did not show plasticity over a period of several weeks after the acute atropine MD protocols. Furthermore, in previous studies, lesioning the pre-Bötzinger complex in goats where the 3° hypoxic response was attenuated did not show evidence of plasticity (21). Collectively, it does not appear that any mechanisms of plasticity compensated for the attenuated hypoxic response in KFN-dialyzed animals.
Implications of findings.
We conclude that cannula implantation, MD of atropine, and injection of IA into the PRG of intact goats does not significantly alter resting PaCO2, the ventilatory response to hypercapnia, or the phase 1 and 2 responses to hypoxia. However, the phase 3 hypoxic responses (minute ventilation, shivering, metabolic rate, and body temperature) are altered with PRG perturbations/lesions. The findings support an integrative or modulatory role for the KFN in the metabolic, thermal, and ventilatory responses to hypoxia.
GRANTS
This work was supported by the Department of Veterans Affairs and by National Heart, Lung, and Blood Institute Grants HL-25739 and HL-007852.
DISCLOSURES
No conflicts of interest are declared by the authors.
REFERENCES
- 1. Bernard D, Li A, Nattie E. Evidence for central chemoreception in the midline raphe. J Appl Physiol 80: 108–115, 1996 [DOI] [PubMed] [Google Scholar]
- 2. Caille D, Vibert J, Hugelin A. Apneusis and apnea after parabrachial or Kolliker-Fuse n. lesion: influences of wakefulness. Respir Physiol 45: 79–95, 1981 [DOI] [PubMed] [Google Scholar]
- 3. Chamberlin N. Functional organization of the parabrachial complex and intertrigeminal region in the control of breathing. Respir Physiol Neurobiol 143: 115–125, 2004 [DOI] [PubMed] [Google Scholar]
- 4. Chamberlin N, Saper C. Topographic organization of respiratory responses to glutamate microstimulation of the parabrachial nucleus in the rat. J Neurosci 14: 6500–6510, 1994 [DOI] [PMC free article] [PubMed] [Google Scholar]
- 5. Chamberlin NL, Du B, de Lacalle S, Saper CB. Recombinant adeno-associated virus vector: use for transgene expression and anterograde tract tracing in the CNS. Brain Res 793: 169–175, 1998 [DOI] [PMC free article] [PubMed] [Google Scholar]
- 6. Cohen M. Neurogenesis of respiratory rhythm in the mammal. Physiol Rev 59: 1105–1173, 1979 [DOI] [PubMed] [Google Scholar]
- 7. Cohen M. Switching of the respiratory phases and evoked phrenic responses produced by rostral pontine electrical stimulation. J Physiol 217: 133–158, 1971 [DOI] [PMC free article] [PubMed] [Google Scholar]
- 8. Cotran RS, Kumar V, Collins T. Pathologic Basis of Disease (6th ed.). Philadelphia, PA: Sanders, 1999, p. 1295 [Google Scholar]
- 9. Curran AK, Rodman JR, Eastwood PR, Henderson KS, Dempsey JA, Smith CA. Ventilatory responses to specific CNS hypoxia in sleeping dogs. J Appl Physiol 88: 1840–1852, 2000 [DOI] [PubMed] [Google Scholar]
- 10. Dutschmann M, Herbert H. The Kolliker-fuse nucleus mediates the trigeminally induced apnoea in the rat. Neuroreport 7: 1432–1436, 1996 [DOI] [PubMed] [Google Scholar]
- 11. Gautier H, Bertrand F. Respiratory effects of pneumotaxic center lesions and subsequent vagotomy in chronic cats. Respir Physiol 23: 71–85, 1975 [DOI] [PubMed] [Google Scholar]
- 12. Gautier H. Interactions among metabolic rate, hypoxia, and control of breathing. J Appl Physiol 81: 521–527, 1996 [DOI] [PubMed] [Google Scholar]
- 13. Gershan W, Forster HV, Lowry T, Korducki M, Forster A, Forster M, Ohtake P, Aaron E, Garber A. Effect of metabolic rate on ventilatory roll-off during hypoxia. J Appl Physiol 76: 2310–2314, 1994 [DOI] [PubMed] [Google Scholar]
- 14. Grunstein M, Hazinski T, Schlueter M. Respiratory control during hypoxia in newborn rabbits: implied action of endorphins. J Appl Physiol 51: 122–130, 1981 [DOI] [PubMed] [Google Scholar]
- 15. Haddad G, Gandhi M, Mellins R. Maturation of ventilatory to hypoxia in puppies during sleep. J Appl Physiol 52: 309–314, 1982 [DOI] [PubMed] [Google Scholar]
- 16. Hayashi F, Sinclair JD. Respiratory patterns in anesthetized rats before and after anemic decerebration. Respir Physiol 84: 61–76, 1991 [DOI] [PubMed] [Google Scholar]
- 17. Heeringa J, de Goede J, Berkenbosch A, Olievier CN. Influence of the depth of anaesthesia on the peripheral and central ventilatory CO2 sensitivity during hyperoxia. Respir Physiol 41: 333–347, 1980 [DOI] [PubMed] [Google Scholar]
- 18. Hodges M, Opansky C, Qian B, Davis S, Bonis J, Bastastic J, Leekley T, Pan L, Forster HV. Transient attenuation of CO2 sensitivity after neurotoxic lesion in the medullary raphe area of awake goats. J Appl Physiol 97: 2236–2247, 2004 [DOI] [PubMed] [Google Scholar]
- 19. Hodges MR, Martino P, Davis S, Opansky C, Pan L, Forster HV. Effect on breathing of focal acidosis at multiple raphe sites in awake goats. J Appl Physiol 97: 2303–2309, 2004 [DOI] [PubMed] [Google Scholar]
- 20. Krause K, Forster HV, Kiner T, Davis S, Bonis J, Qian B, Pan L. Focal acidosis in the pre-Bötzinger complex area of awake goats induces a mild tachypnea. J Appl Physiol 106: 241–250, 2009 [DOI] [PMC free article] [PubMed] [Google Scholar]
- 21. Krause K, Forster HV, Kiner T, Davis S, Bonis J, Qian B, Pan L. Normal breathing pattern and arterial blood gases in awake and sleeping goats after near total destruction of the presumed pre-Botzinger complex and the surrounding region. J Appl Physiol 106: 605–619, 2009 [DOI] [PMC free article] [PubMed] [Google Scholar]
- 22. Lowry T, Forster HV, Korducki M, Forster A, Forster M. Comparison of ventilatory responses to sustained reduction in arterial oxygen tension vs. content in awake ponies. J Appl Physiol 76: 2147–2153, 1994 [DOI] [PubMed] [Google Scholar]
- 23. Mallios V, Lydic R, Baghdoyan H. Muscarinic receptor subtypes are differentially distributed across brain stem respiratory nuclei. Am J Physiol Lung Cell Mol Physiol 268: L941–L949, 1995 [DOI] [PubMed] [Google Scholar]
- 24. Martino PF, Hodges MR, Davis Opansky CS, Pan LG, Krause K, Qian B, Forster HV. CO2/H+ chemoreceptors in the cerebellar fastigial nucleus do no uniformly affect breathing of awake goats. J Appl Physiol 101: 241–248, 2006 [DOI] [PubMed] [Google Scholar]
- 25. Martino P, Davis S, Opansky C, Krause K, Bonis J, Pan L, Qian B, Forster HV. The cerebellar fastigial nucleus contributes to CO2-H+ ventilatory sensitivity in awake goats. Respir Physiol Neurobiol 157: 242–251, 2007 [DOI] [PMC free article] [PubMed] [Google Scholar]
- 26. Mizusawa A, Ogawa H, Kikuchi Y, Hida W, Shirato K. Role of the parabrachial nucleus in ventilatory responses of awake rats. J Physiol 489: 877–884, 1995 [DOI] [PMC free article] [PubMed] [Google Scholar]
- 27. Musch TI, Pelligrino A, Dempsey JA. Effects of prolonged N20 and barbiturate anesthesia on brain metabolism and pH in the dog. Respir Physiol 39: 121–131, 1980 [DOI] [PubMed] [Google Scholar]
- 28. Nattie E, Li A. CO2 dialysis in the medullary raphe of the rat increases ventilation in sleep. J Appl Physiol 90: 1247–1257, 2001 [DOI] [PubMed] [Google Scholar]
- 29. Nuebauer JA, Melton JE, Edelman NH. Modulation of respiration during brain hypoxia. J Appl Physiol 68: 267–283, 1986 [Google Scholar]
- 30. Poon C. Optimal interaction of respiratory and thermal regulation at rest and during exercise: role of a serotonin-gated spinoparabrachial thermoafferent pathway. Respir Physiol Neurobiol 169: 234–242, 2009 [DOI] [PMC free article] [PubMed] [Google Scholar]
- 31. Schwieler G. Respiratory regulation during postnatal development in cats and rabbits and some of its morphological substrate. Acta Physiol Scand Suppl 304: 1–123, 1968 [PubMed] [Google Scholar]
- 32. Schwob JE, Fuller T, Price J, Olney J. Widespread patterns of neuronal damage following systemic or intracerebral injections of kainic acid: a histological study. Neuroscience 5: 991–1014, 1980 [DOI] [PubMed] [Google Scholar]
- 33. Smith CA, Engwall MJ, Dempsey JA, Bisgard GE. Effects of specific carotid body and brain hypoxia on respiratory muscle control in the awake goat. J Physiol 460: 623–640, 1993 [DOI] [PMC free article] [PubMed] [Google Scholar]
- 34. Solomon I. Focal CO2/H+ alters phrenic motor output response to chemical stimulation of cat pre-Botzinger complex in vivo. J Appl Physiol 94: 2151–2157, 2003 [DOI] [PubMed] [Google Scholar]
- 35. Song S, Yu Y, Poon C. Cytoarchitecture of pneumotaxic integration of respiratory and nonrespiratory information in the rat. J Neurosci 26: 300–310, 2006 [DOI] [PMC free article] [PubMed] [Google Scholar]
- 36. Song G, Poon C. Lateral parabrachial nucleus mediates shortening of expiration and increase of inspiratory drive during hypercapnia. Respir Physiol Neurobiol 165: 9–12, 2009 [DOI] [PMC free article] [PubMed] [Google Scholar]
- 37. Song G, Poon C. Lateral parabrachial nucleus mediates shortening of expiration during hypoxia. Respir Physiol Neurobiol 165: 1–8, 2009 [DOI] [PMC free article] [PubMed] [Google Scholar]
- 38. St. John W. Differing responses to hypercapnia and hypoxia following pneumotaxic center ablation. Respir Physiol 23: 1–9, 1975 [DOI] [PubMed] [Google Scholar]
- 39. St. John W, Bond G, Pasley J. Integration of chemoreceptor stimuli by rostral brainstem respiratory areas. J Appl Physiol 39: 209–214, 1975 [DOI] [PubMed] [Google Scholar]
- 40. St. John W, Zhou D. Rostral pontile mechanisms regulate durations of expiratory phases. J Appl Physiol 71: 2133–2137, 1991 [DOI] [PubMed] [Google Scholar]
- 41. Tenney SM, Ou LC. Ventilatory response of decorticate and decerebrate cats to hypoxia and CO2. Respir Physiol 29: 81–92, 1077 [DOI] [PubMed] [Google Scholar]
- 42. Vizek M, Pickett C, Weil J. Biphasic ventilatory response of adult cats to sustained hypoxia has central origin. J Appl Physiol 63: 1658–1664, 1987 [DOI] [PubMed] [Google Scholar]
- 43. Wang W, Fung M, St. John W. Pontile regulation of ventilatory activity in the adult rat. J Appl Physiol 74: 2801–2811, 1993 [DOI] [PubMed] [Google Scholar]
- 44. Wenninger JM, Pan LG, Martino Geiger LP, Hodges M, Serra A, Feroah T, Forster H. Multiple rostral medullary nuclei can influence breathing in awake goats. J Appl Physiol 91: 777–788, 2001 [DOI] [PubMed] [Google Scholar]
- 45. Woodrum D, Standaert T, Mayock D, Guthrie R. Hypoxic ventilatory response in the newborn monkey. Pediatr Res 15: 367–370, 1981 [DOI] [PubMed] [Google Scholar]
- 46. Xu F, Frazier D. Role of the cerebellar deep nuclei in respiratory modulation. Cerebellum 1: 35–40, 2002 [DOI] [PubMed] [Google Scholar]


