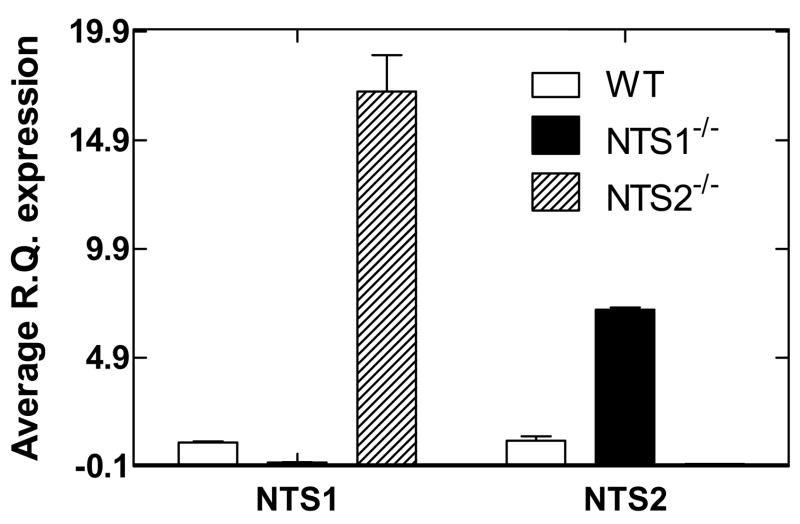
Figure 2. Average experimental ratio for NTS1 and NTS2 mRNA using real time RT-PCR analysis of RNA from wild type, NTS1−/−, and NTS2−/− mice (n=5). Data is presented as mean ± SEM.
NTS1=NT receptor subtype 1
NTS2=NT receptor subtype 2
WT=wild type
NTS1−/− =NTS1 knockout mice
NTS2−/− =NTS2 knockout mice

