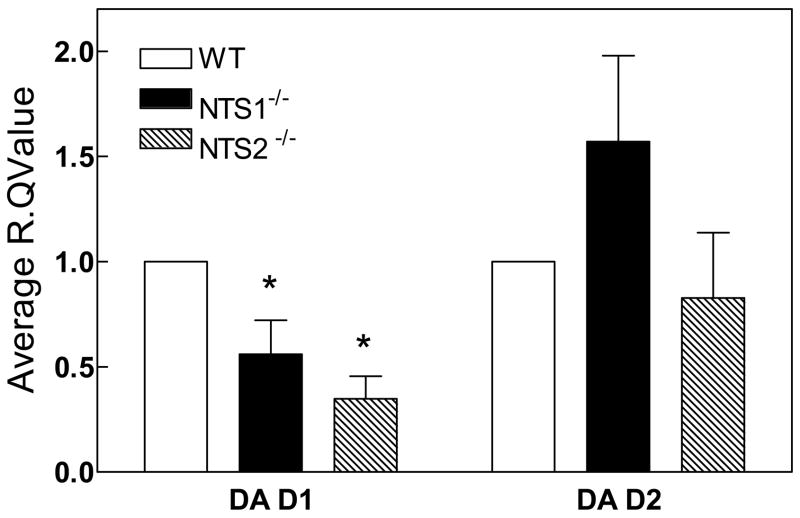
Figure 5. Average R.Q. ratio of DA D1 and DA D2 in the striatum for NTS1−/−, and NTS2−/− mice relative to WT mice.
Mice brains were harvested, dissected on ice and frozen at −80°C until assayed. Brain tissue was homogenized and assayed as described in Materials and Methods. Results are presented as mean ± SEM (n=4). P<0.05 is considered significant. *Significantly different from WT.
WT=wild type
NTS1−/− =NTS1 knockout mice
NTS2−/− =NTS2 knockout mice
DA D1=dopamine receptor subtype 1
DA D2=dopamine receptor subtype 2

