

Summary
Methyl-CpG binding protein 1 (MBD1) regulates gene expression via a DNA methylation-mediated epigenetic mechanism. We have previously demonstrated that MBD1 deficiency impairs adult neural stem/progenitor cell (aNSC) differentiation and neurogenesis, but the underlying mechanism was unclear. Here we show that MBD1 regulates the expression of several microRNAs in aNSCs, and specifically that miR-184 is directly repressed by MBD1. High levels of miR-184 promoted proliferation but inhibited differentiation of aNSCs, whereas inhibition of miR-184 rescued the phenotypes associated with MBD1 deficiency. We further found that miR-184 regulates the expression of Numblike (Numbl), a known regulator of brain development, by binding to the 3′-UTR of Numbl mRNA and affecting its translation. Expression of exogenous Numbl could rescue the aNSC defects that result from either miR-184 overexpression or MBD1 deficiency. Therefore MBD1, miR-184, and Numbl form a regulatory network that helps control the balance between proliferation and differentiation of aNSCs.
Introduction
Neural stem cells in adult mammalian brains possess the two essential properties of stem cells, self-renewal and multipotency, and they generate new neurons that are capable of functional integration into existing neural circuits (Zhao et al., 2008). The maintenance and differentiation of adult neural stem cells are tightly controlled by intricate molecular networks (Li and Zhao, 2008). Deciphering these regulatory mechanisms represents a step towards understanding the plasticity of adult brains and realizing the therapeutic potential of adult neural stem cells.
Epigenetic mechanisms, including DNA methylation and histone modification, are known to play significant roles in the modulation of stem cell proliferation and differentiation (Li and Zhao, 2008). Methylated-CpG binding proteins (MBDs), including MBD1 and MeCP2, can translate DNA methylation into gene expression changes (Klose and Bird, 2006). In vitro analyses have suggested a role for MBD1 in transcriptional repression, chromatin assembly, and heterochromatin structure maintenance, and functional reduction of MBD1 has been found in tumors (Sansom et al., 2007), suggesting a role for it in cellular growth control. Despite its ubiquitous expression pattern, MBD1 deficiency in mice results largely in brain-associated phenotypes, including impaired adult neurogenesis, defective hippocampus-dependent learning, and susceptibility to depression (Allan et al., 2008; Zhao et al., 2003). In the adult brain, MBD1 is expressed in both neurons and neural stem/progenitor cells (aNSCs), but not glial cells, and MBD1 deficiency results in reduced aNSC neuronal differentiation. However, since MBD1 has no known sequence specificity, other than CpGs for DNA binding, the efforts to identify downstream target genes of MBD1 have so far yielded only limited results (Jorgensen et al., 2004; Li et al., 2008; Zhao et al., 2003).
Recent evidence points to important roles for noncoding small RNAs, including microRNAs (miRNAs), in stem cell regulation (Liu and Zhao, 2009; Shen and Temple, 2009). Although the precise mechanism is still being worked out, extensive experimental evidence demonstrates that miRNAs regulate gene expression by targeting RNA-induced silencing complex to specific messenger RNAs. Specific miRNAs are known to modulate the functions of many types of stem cells, including aNSCs (Cheng et al., 2009; Zhao et al., 2009). However, we still lack a complete picture of miRNA function in aNSCs. In particular, it is unclear how the expression of miRNAs themselves is controlled in aNSCs and how the crosstalk between epigenetic regulation and the miRNA pathway modulates aNSC proliferation and differentiation.
Here we provide evidence to show that the MBD1-regulated miR-184 controls the balance between the proliferation and differentiation of aNSCs. We demonstrate that MBD1 directly regulates the expression of miR-184 in aNSCs, and high levels of miR-184 promoted aNSC proliferation and inhibited differentiation both in vitro and in vivo. We further identified Numblike (Numbl) as a downstream target of miR-184, and exogenously expressed Numbl could rescue aNSC proliferation and differentiation deficits resulting from either elevated miR-184 or MBD1 deficiency. Hence, our data support the novel idea that MBD1, miR-184, and Numbl form a regulatory network that controls the balance between the proliferation and differentiation of aNSCs.
Results
MBD1 deficiency results in altered proliferation and differentiation of aNSCs
To further assess the function of MBD1 in adult neurogenesis, we isolated aNSCs from adult Mbd1 KO mice and wild-type (WT) littermate controls. Early-passage proliferating aNSCs were positive for the two progenitor markers Nestin (99.8%) and Sox2 (88.2%), and virtually all Sox2-postiive cells were Nestin-positive (Figure 1A), confirming the immaturity of these proliferating aNSCs. MBD1 was easily visualized in WT aNSCs, but as expected, was undetectable in Mbd1 KO aNSCs (Figure 1B). To assess the proliferation of WT and KO aNSCs, we pulse-labeled the cells with BrdU for eight hours (Figure 1C). Quantification of labeled cells demonstrates that 38.6% more Mbd1 KO aNSCs than WT aNSCs had incorporated BrdU (Figure 1D).
Figure 1. Loss of MBD1 leads to increased proliferation and reduced differentiation of aNSCs.
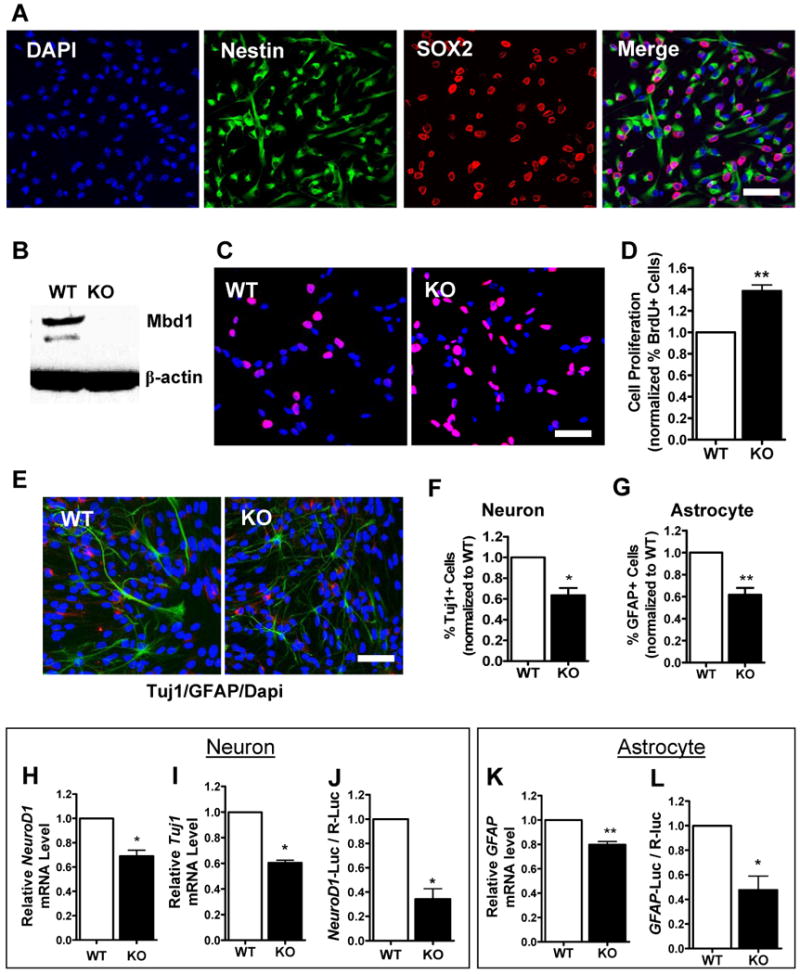
(A) Adult NSCs cultured under proliferating conditions expressed the neural progenitor markers Nestin (cytoplasmic, green) and Sox2 (nuclear, red).
(B) Western blotting showing the expression of MBD1 [2 different isoforms (Zhao et al., 2003)] in WT aNSCs and the absence of MBD1 in Mbd1 KO aNSCs. β-actin was used as an internal control.
(C) Both Mbd1 KO and WT aNSCs cultured under proliferating conditions incorporated bromodeoxyuridine (BrdU) in cell proliferation analyses (BrdU in red, DAPI in blue).
(D) Quantitative analysis showing that a higher percentage of Mbd1 KO aNSCs incorporated BrdU compared with WT control cells (n = 3).
(E, F, G) Mbd1 KO aNSCs differentiated into fewer TuJ1-positive (E, red; F, n = 4) neurons and GFAP-positive astrocytes (E, green; G, n = 4) (DAPI in blue).
(H, I, J) Quantitative analyses showing that, under differentiation conditions, Mbd1 KO aNSCs exhibited reduced neuronal differentiation capacity, as assessed by decreased mRNA levels of neuronal specific NeuroD1 (H, n = 4) and Tuj1 (I, n = 4) and reduced promoter activity of transfected NeuroD1-promoter driven firefly luciferase (NeuroD1-Luc) construct (J, n = 3).
(K, L) Quantitative analyses showing that Mbd1 KO aNSCs exhibited reduced astrocyte differentiation capacity, as assessed by decreased GFAP mRNA levels (K, n = 4) and reduced GFAP-promoter activity (L, n = 3). *, p < 0.05; **, p < 0.01.
Both WT and Mbd1 KO aNSCs could be induced to differentiate into neuron-specific type III tubulin-positive (Tuj1+) neurons and glial fibrillary acidic protein-positive (GFAP+) astrocytes (Figure 1E). Consistent with our previous findings (Li et al., 2008; Zhao et al., 2003), Mbd1 KO aNSCs differentiated into fewer Tuj1-positive neurons (Figure 1F). When astrocyte differentiation was evaluated by counting GFAP-positive cells, we found that this was also reduced in Mbd1 KO aNSCs (Figure 1G). Stepwise regression analysis indicated that only the cell genotypes, not the cell numbers, have significant effects on aNSC differentiation (Tuj1: F1,6 = 21.620, p = 0.004; GFAP: F1,6 = 16.254, p = 0.007). The reduced neuronal differentiation of Mbd1 KO aNSCs was next validated by quantitative PCR analyses for the expression of a pan-neuronal transcription factor, neurogenic differentiation 1 (NeuroD1, Figure 1H), as well as Tuj1 (Figure 1I). Moreover, we further confirmed the decreased differentiation potential of Mbd1 KO aNSCs by assessing the activity of a transfected NeuroD1 promoter construct. NeuroD1 promoter activity monitored by luciferase assay was reduced by 66% in Mbd1 KO aNSCs compared with WT aNSCs (Figure 1J). The decreased astrocytic differentiation of Mbd1 KO aNSCs was also validated by both the quantitative expression of GFAP mRNA (Figure 1K) and GFAP promoter activity (Figure 1L). These results show that MBD1 deficiency leads to an increased proliferation capacity in aNSCs but reduced differentiation potential.
MBD1 regulates the expression of miR-184
Recent evidence points to important roles for miRNAs in stem cell regulation. We hypothesized that MBD1 may govern the balance between the proliferation and differentiation of aNSCs by controlling the expression of specific miRNAs. To identify miRNAs that could be regulated by MBD1 in aNSCs, we evaluated the expression of 218 miRNAs in WT and Mbd1 KO aNSCs and identified a subset of miRNAs with significantly altered expression (>1.7× fold) in Mbd1 KO aNSCs (Figure 2A). We focused on the 26 miRNAs with increased expression in KO cells. We reckoned that their upregulation was likely to arise from a loss of MBD1 repression, whereas miRNAs that are downregulated could be due to secondary effects. We then used both aNSC differentiation assays and miRNA real-time PCR analyses to narrow down the candidate miRNAs capable of mediating MBD1 function. We reasoned that if the miRNA is a functional mediator of MBD1 in aNSCs, its overexpression should repress neuronal differentiation. For each miRNA, we cotransfected either its miRNA mimic (miR) or its specific inhibitor (anti-miR; miRNA sequence-specific 2′-O-methyl oligonucleotide) together with the NeuroD1–luciferase reporter. This strategy enabled us to identify candidate miRNAs that show opposite effects resulting from gain-of-function miR and loss-of-function anti-miR expression. Most miRNAs tested showed inconsistent effects (Table S1). Among the miRNAs analyzed, only miR-184 met the above criteria (Table S1). We then validated the altered expression of several miRNAs in Mbd1 KO aNSCs using real-time PCR. Several miRNAs (e.g. miR-133a, miR-133b, and miR-199) were expressed at very low levels in aNSCs, as evidenced by their high Ct values (Table S1), and did not show significant changes (Table S1, Figure S1). Among the miRNAs analyzed, only miR-184 showed consistently increased expression in Mbd1 KO aNSCs (Figure 2B).
Figure 2. Altered miRNA expression in Mbd1 KO aNSCs.
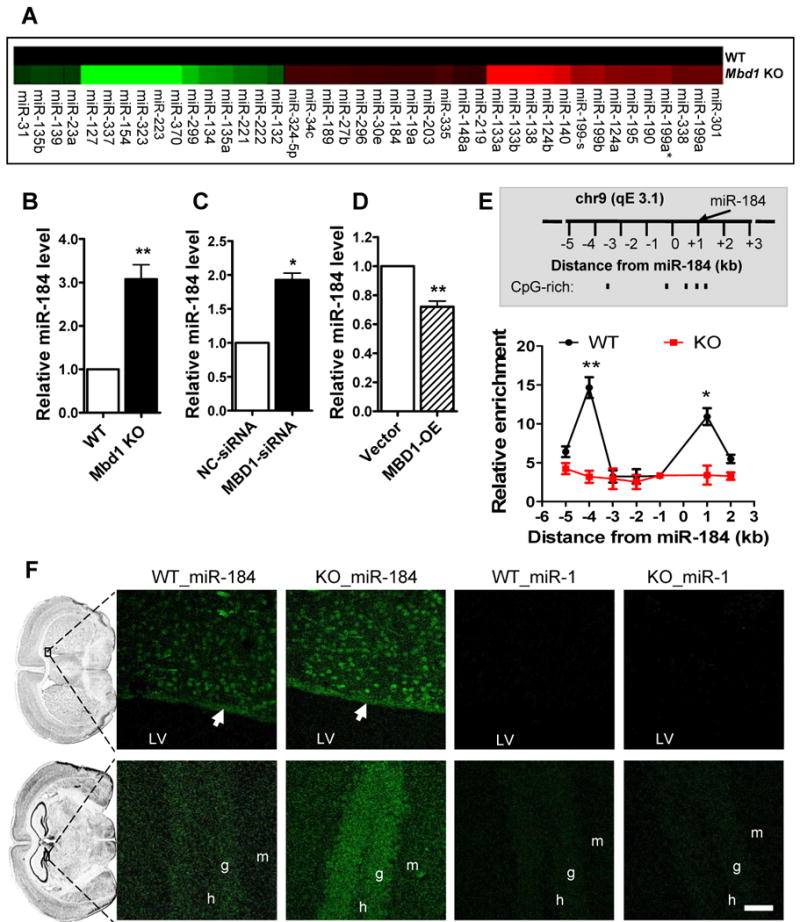
(A) Heatmap of miRNAs that show significant changes (> 1.7 × fold) in expression levels in proliferating Mbd1 KO aNSCs compared with WT aNSCs, with increased expression showing in red and decreased expression showing in green.
(B) The expression of miR-184 was increased in Mbd1 KO proliferating aNSCs. Real-time PCR analyses were performed using independently isolated aNSCs (n = 6).
(C) Acute knockdown of MBD1 resulted in increased miR-184 expression in aNSCs (n = 3).
(D) Overexpression of MBD1 in aNSCs led to reduced miR-184 expression (n = 4).
(E) Upper panel shows a schematic drawing of the 7-kilobase (kb) regions proximal to the miR-184 gene on chromosome 9qE3 that were assayed in ChIP experiments. The relative CpG-rich sequences are indicated. Lower panel shows the enrichment of MBD1 protein at genomic sequence 4 kb upstream and 1 kb downstream of the miR-184 locus in WT aNSCs, as assessed by MBD1-specific chromatin immunoprecipitation (ChIP). ChIP with IgG in WT aNSCs and ChIP of MBD1 antibody in Mbd1 KO aNSCs were used as negative controls. Relative enrichment of MBD1 in either WT or KO aNSCs was calculated relative to IgG-only nonspecific control in the same cells (n = 4). Quantities were calculated from an input DNA-generated standard curve. Two-way ANOVA, Bonferroni post-test.
(F) Fluorescence in situ hybridization (FISH) analyses showing expression of miR-184 in the subventricular zone (top panels) and the dentate gyrus (bottom panels) of WT and Mbd1 KO mice (Green: miRNA probe signal). White arrows point to the aNSC-containing germinal zone located at the lateral wall of the lateral ventricles. An increase in staining intensity for miR-184 was observed in Mbd1 KO brains. miR-1 probe was used as a negative control for FISH. Scale bars = 40 μm. LV, lateral ventricle. g, granule cells of the dentate gyrus. h, hilar region of the dentate gyrus. *, p < 0.05; **, p < 0.01. (Also see Figures S1, S2, S3, S4, and S5 and Table S1).
To further determine whether MBD1 regulates the expression of miR-184, we acutely manipulated MBD1 expression in aNSCs. As expected, we found that acute knockdown of MBD1 in aNSCs led to increased miR-184 expression (Figure 2C), whereas overexpression of MBD1 led to reduced miR-184 expression (Figure 2D).
We then proceeded to explore whether MBD1 directly regulates miR-184 and whether it acts through an epigenetic mechanism to suppress miR-184 expression. miR-184 is a highly conserved single copy miRNA located in an imprinted locus on mouse chromosome 9, and it is 55 kb away from the nearest coding gene (Nomura et al., 2008). The genomic region immediately surrounding miR-184 does not contain a classic CpG island, but does contain several CpG-rich sequences (Figure 2E) that are suitable for MBD1 binding (Jorgensen et al., 2004). To test whether MBD1 interacts directly with genomic regions proximal to miR-184, we used chromatin immunoprecipitation (ChIP) followed by real-time quantitative PCR to evaluate the region from -5 kb upstream to +2 kb downstream of the miR-184 gene. ChIP using an MBD1-specific antibody demonstrated that MBD1 was 4.6×-fold enriched at -4 kb upstream and 3.2×-fold enriched at +1 kb downstream of miR-184 in WT aNSCs relative to two negative controls, IgG-IP in WT cells and MBD1-IP in Mbd1 KO aNSCs (Figure 2E). These regions are either near or within the CpG-rich regions. Because MBD1 is involved in chromatin compaction, we also examined the effect of MBD1 deficiency on the chromatin state of the miR-184 locus by using histone-specific ChIP analysis. We found that MBD1 deficiency correlated with increased binding of two chromatin markers generally associated with actively transcribed genes, tri-methylated histone H3 lysine 4 and acetylated histone H3 lysine 9 (Figure S2). One repressive chromatin marker, tri-methylated histone 3 at lysine 27, showed mild enrichment in genomic sequence upstream from miR-184 in Mbd1 KO aNSCs compared with WT aNSCs (Figure S2C). These data suggest that, in the absence of MBD1, the chromatin immediately upstream of miR-184 might shift from a compact state towards either an active or bivalent chromatin structure (Bernstein et al., 2007). Interestingly, however, we did not observe a change in DNA methylation levels in this region in Mbd1 KO aNSCs, as assessed by immunoprecipitation of DNA with a 5′-Me-C–specific antibody (data not shown). Taken together, these data are consistent with the idea that MBD1 represses miR-184 expression in aNSCs by direct binding to the genomic regions surrounding miR-184.
To better understand the function of miR-184 in aNSCs, we next assessed the localization of miR-184 in adult brains using fluorescent in situ hybridization (FISH). We found that mature miR-184 was localized in the two regions with ongoing neurogenesis in adult brains: the subventricular zone (SVZ, arrow) of the lateral ventricles (LV, Figure 2F and Figure S3) and the dentate gyrus (DG, Figure 2F and Figure S4) of the hippocampus. Moreover, substantiating our earlier data, we observed a higher intensity of miR-184 probe signal in Mbd1 KO brains compared with WT brains, which was further validated by real-time PCR analysis of miR-184 in Mbd1 KO tissue (Figure S5). A probe for miR-1, a miRNA known to be expressed at extremely low levels in the brain, served as a negative control for FISH (Figure 2F, Figure S3, and S4). The relatively high levels of miR-184 FISH signal in neurons (Figure 2F) and co-localization with NeuN immuno reactivity (Figure S3 and S4) are consistent with what we had reported previously; namely, that MBD1 is expressed at high levels in neurons and lower levels in aNSCs and is undetectable in astrocytes (Zhao et al., 2003). Indeed, we found that MBD1 was more highly expressed in both differentiating aNSCs and primary cortical neurons, whereas miR-184 expression levels were lower in these more differentiated cells compared with proliferating aNSCs (Figure S5). The inverse correlation between MBD1 and miR-184 levels in both aNSCs and neurons lends further support to the negative regulation of miR-184 by MBD1. We then focused on the role of miR-184 as a functional mediator of MBD1 in controlling the balance between aNSC proliferation and differentiation.
MicroRNA miR-184 regulates the proliferation and differentiation of aNSCs
To define more directly the role of miR-184 on aNSC differentiation, we first performed assays to show miR-184 repressed and anti-miR-184 enhanced the activities of both NeuroD1 and GFAP promoters (Figure S6A and S6B). In these assays, miR transfection efficiency was demonstrated to be >90% as assessed by transfection of fluorescence-labeled control miR in a parallel culture, followed by flow cytometry analysis (data not shown). Indeed, aNSCs transfected with miR-184 showed reduced neuronal and astrocyte differentiation, whereas aNSCs transfected with anti-miR184 showed increased differentiation (Figure 3A, B and C). These results were further confirmed by quantitative analyses of the mRNA levels of Tuj1 (Figure 3D) and GFAP (Figure 3E). To validate the above results, we then used recombinant lentivirus expressing a small hairpin miR-184 (sh-miR-184; Figure 3F). Lentivirus-sh-miR-184–infected aNSCs expressed significantly higher levels of miR-184 compared with control virus-infected aNSCs (Figure S6C). Because the lentivector coexpressed enhanced green fluorescence protein (eGFP), we were able to identify specific virus-transduced cells (Figure 3G and Figure S6D). As expected, aNSCs infected by lentivirus-sh-miR-184 differentiated into 31.7% fewer Tuj1+ neurons (Figure 3H) and 27.2% fewer GFAP+ astrocytes (Figure 3I) compared with aNSCs infected by a lentivirus expressing control shRNA. Therefore, a high expression level of miR-184, either by direct transfection or viral vector-mediated expression, inhibits aNSC differentiation into neurons and astrocytes, whereas inhibiting endogenous miR-184 by an anti-miR-184 enhances aNSC differentiation.
Figure 3. miR-184 modulates the proliferation and differentiation of adult NSCs in vitro.
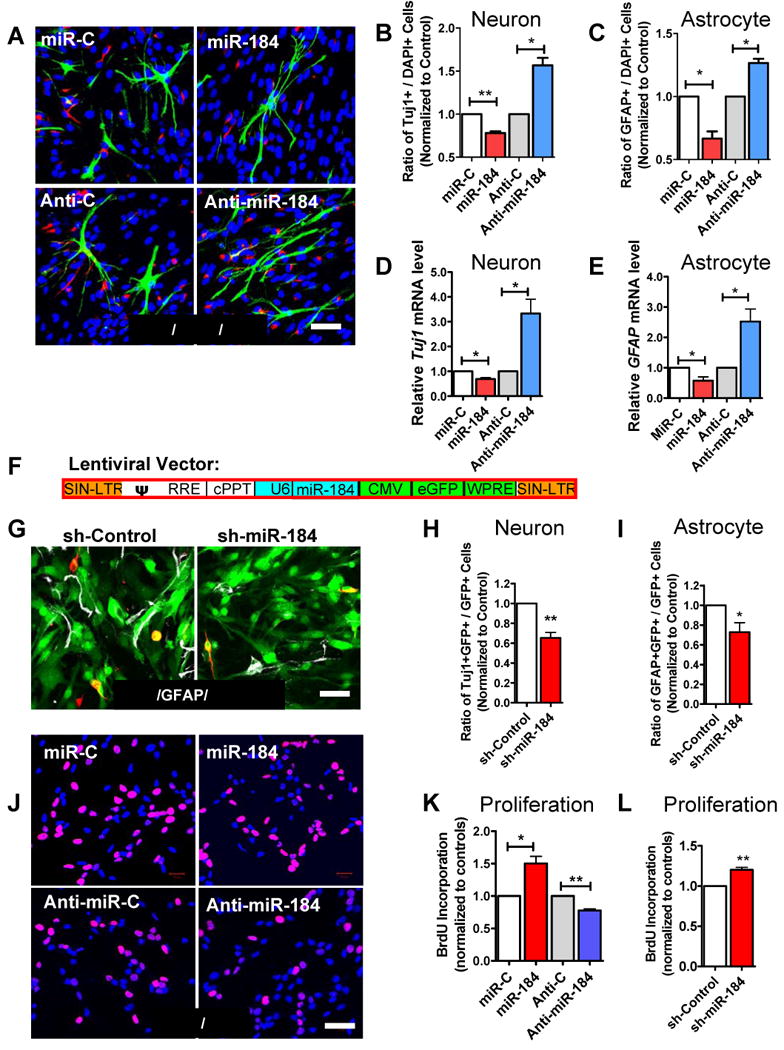
(A) RNA transfected aNSCs differentiated into neurons (Tuj1, red) and astrocytes (GFAP, green; DAPI, blue).
(B, C) Transfection with miR-184 RNA led to reduced neuronal (B, n = 3) and astrocyte (C, n = 3) differentiation, compared with control nonspecific miR (miR-C). On the other hand, transfection with specific inhibitor to miR-184 (anti-miR-184) led to increased neuronal (B) and astrocyte (C) differentiation, compared with anti-miR control (Anti-C).
(D, E) Similar results as B and C were obtained by using real-time PCR analyses for mRNA levels of neuronal-specific Tuj1 (D, n = 4) and astrocyte marker GFAP (E, n = 4).
(F, G) We then used lentivirus expressing a small hairpin of miR-184 (F) to infect aNSCs. This lentiviral vector also expressed GFP under the CMV promoter, allowing us to track infected cells (G, green). Neuronal and glial differentiation was assessed using Tuj1 (red) and GFAP (white) staining and quantification.
(H, I) Adult NSCs infected by the lentivirus expressing sh-miR-184 differentiated into fewer neurons (H, n = 5) and fewer astrocytes (I, n = 5) compared with aNSCs infected with lentivirus expressing a nonspecific shRNA (sh-Control).
(J) Proliferation of miR-184- or anti-miR-184-transfected aNSCs was analyzed using BrdU pulse labeling. BrdU, red; DAPI, blue.
(K) miR-184–transfected aNSCs had increased BrdU incorporation relative to miR-C-transfected cells (n = 3). Anti-miR-184–treated aNSCs, on the other hand, displayed reduced BrdU incorporation relative to Anti-C-transfected aNSCs (n = 3).
(L) Lentivirus-shRNA-miR-184–infected aNSCs had increased BrdU incorporation relative to sh-Control lentivirus-infected aNSCs (n = 4). *, p < 0.05; **, p < 0.01. Scale bars = 40 μm. (Also see Figure S6).
To determine whether miR-184 controls the balance between proliferation and differentiation, we examined the effect of miR-184 on cell proliferation using BrdU pulse-labeling (Figure 3J). The aNSCs transfected with miR-184 exhibited 50.3% more BrdU incorporation compared with control miR-transfected cells (Figure 3K). On the other hand, aNSCs transfected with anti-miR-184 had 22.2% reduced BrdU incorporation compared with controls (Figure 3K). We then repeated this experiment using lentivirus-expressed miR184. Indeed, lentivirus-sh-miR-184–infected aNSCs exhibited 20.2% more BrdU incorporation compared with aNSCs infected by lentivirus expressing control shRNA (Figure 3L). In addition, we found that lentivirus-sh-miR-184-infected primary aNSCs generated more neurospheres compared with control virus-infected aNSCs (Figure S6E). These results demonstrate that miR-184 promotes aNSC proliferation and inhibits differentiation, whereas inhibition of miR-184 leads to reduced proliferation but increased differentiation. These findings are consistent with the phenotypes of Mbd1 KO aNSCs with elevated miR-184 levels.
MicroRNA miR-184 regulates aNSC proliferation and differentiation in vivo
To assess gene functions in adult neurogenesis, we and others have used recombinant retroviruses that are only capable of infecting dividing cells to selectively transduce single dispersed aNSCs in the adult hippocampus (Ge et al., 2006; Smrt et al., 2007; van Praag et al., 2002). We therefore constructed a retroviral vector that contained both sh-miR-184 driven by a U6 promoter and GFP by a chicken actin (CAG) promoter (Figure 4A). Retrovirus expressing sh-miR-184 was stereotaxically grafted into the right DG, and retrovirus expressing a nonspecific control (sh-Control) was grafted into the left DG of the same animal (Figure 4B, C). Mice also received BrdU injections immediately after the surgery to label dividing cells. At one week post-viral injection, when some of the retrovirus-labeled NSCs (eGFP+) would be expected to have differentiated, we analyzed viral-infected cells for BrdU incorporation and expression of the early neuronal marker, doublecortin (DCX). Many retrovirus-labeled cells (GFP+) were positively labeled with BrdU, indicating that these cells were in fact dividing after viral infection. Some of these retrovirus-labeled cells were positive for DCX expression, suggesting that they had initiated neuronal differentiation (Figure 4D). Using Z-stack images of confocal microscopy at 1-μm resolution, we quantified the percentage of retrovirus-labeled GFP+ cells that expressed either DCX or incorporated BrdU. Compared with sh-Control retrovirus-infected cells, a significantly higher percentage of sh-miR-184 retrovirus-infected cells incorporated BrdU (Figure 4E, BrdU+GFP+/GFP+), whereas the percentage of sh-miR-184 retrovirus-infected cells that expressed DCX was lower compared with control virus-infected cells (Figure 4F, DCX+GFP+/GFP+). These results suggest that, consistent with our results in cultured aNSCs, miR-184-overexpressing aNSCs proliferate more and exhibit reduced neuronal differentiation capacity in vivo.
Figure 4. miR-184 modulates the proliferation and differentiation of adult NSCs in vivo.
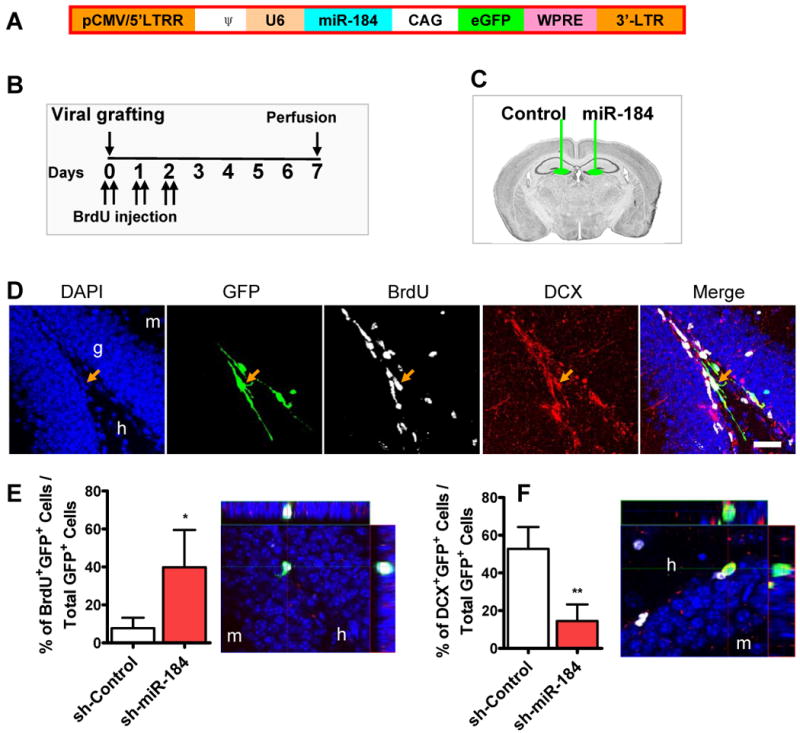
(A) Retroviral vector used for in vivo miRNA expression. miRNA was expressed as a short hairpin under U6 RNA Polymerase III promoter, while GFP was expressed under a chicken actin (CAG) promoter.
(B) Experimental timeline for in vivo analyses.
(C) Retroviruses expressing sh-miR-184 and control shRNA were grafted into contralateral sides of the same animals.
(D) A representative image of immunohistological analysis of virus-infected cells in the subgranular zone of the dentate gyrus. Orange arrow points to a cell that was positive for GFP (green), BrdU (white), and DCX (red), indicating that this viral-infected cell proliferated and then differentiated into neurons. Scale bar = 20 μm. g, granule cells layer. h, hilar region. m, molecular layer.
(E) Sh-miR-184 virus-infected cells proliferated more compared with control virus-infected cells (n = 4). Right panel shows a representative 3D Z-stack image used for quantification of BrdU+GFP+ DCX- cells.
(F) Sh-miR-184–infected cells differentiated into fewer DCX+ early neurons when compared with control virus-infected cells (n = 4). Right panel shows a representative confocal 3D Z-stack image used for quantification of DCX+GFP+BrdU- cells. DCX, red; GFP, green; BrdU, white. *, p < 0.05; **, p < 0.01.
Numblike is a target of miR-184 in aNSCs
To investigate the downstream target underlying miR-184 regulation of aNSCs, we searched for potential mRNA targets of miR184 by cross-referencing three widely used programs, TargetScan (Lewis et al., 2003), PicTar (Krek et al., 2005), and miRanda (John et al., 2004), and they respectively predicted 18, 10, and 852 target genes for miR-184; however, no common target was predicted by all three programs. We therefore used DAVID Bioinformatics Resources (Huang et al., 2009) to assign these predicted targets into different cellular functional categories. Based on both conserved seed sequences and the observed functional effects of miR-184 on aNSC proliferation and differentiation, we selected 22 genes as top candidates (Table S2). Among these candidates, Numblike (Numbl) is known to be important in embryonic neural stem cell function and cortical brain development (Li et al., 2003; Petersen et al., 2002). To determine whether Numbl is a target of miR-184, we inserted the 3′-untranslated region (3′-UTR) sequence of Numbl mRNA containing a prominent miR-184 seed sequence into a dual luciferase reporter construct, which allowed us to assess Numbl protein translation based on luciferase activities (Figure 5A). We found that miR-184 could repress the expression of Renilla luciferase (R-Luc) through the Numbl 3′-UTR, whereas anti-miR-184 enhanced the R-Luc expression (Figure 5B). To determine whether miR-184 targeting of Numbl was specific, we mutated the miR-184 seed sequence within the R-Luc-Numbl-3′-UTR reporter (Figure 5A) and found that this abolished both miR-184-mediated suppression and anti-miR-184-mediated enhancement of R-Luc reporter activity (Figure 5C).
Figure 5. Numblike (Numbl) is a functional target of miR-184.
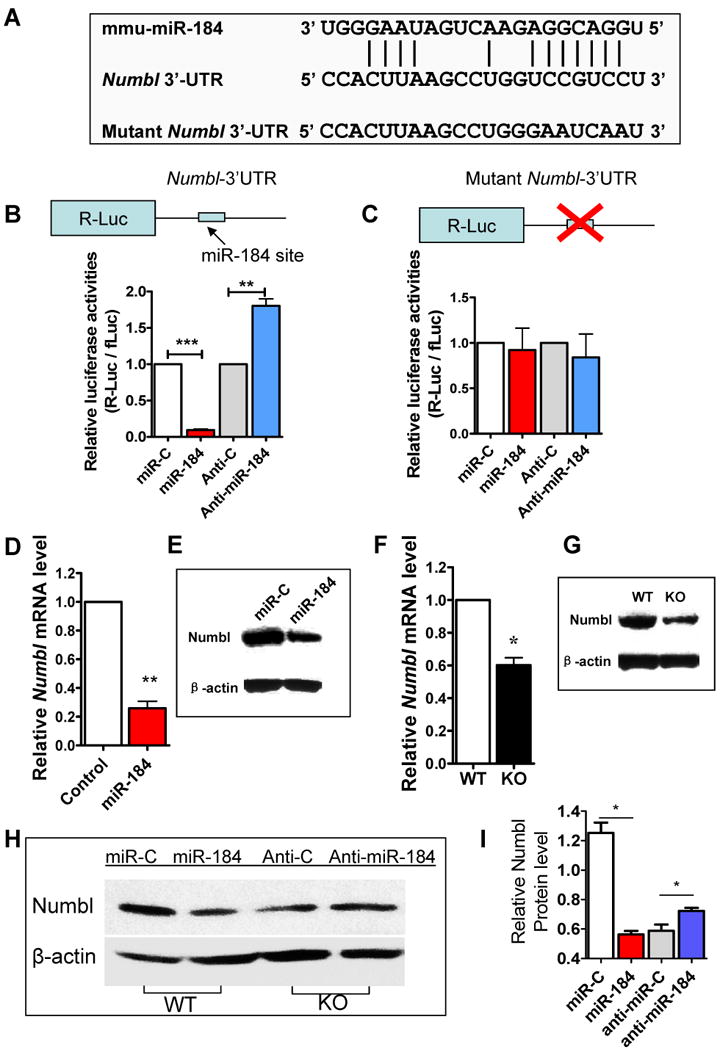
(A) A miR-184 target site was found in the Numbl 3′-untranslated region (3′-UTR) as predicted by miRanda software. The Mutant Numbl 3′-UTR used in C is shown.
(B) Numbl-3′-UTR–dependent expression of a Renilla luciferase (R-luc) was suppressed by miR-184 and increased by anti-miR-184 in aNSCs.
(C) miR-184-mediated suppression of R-luc-Numbl-3-′UTR was dependent on the miR-184 target site, because that mutation of the miR-184 target site in the Numbl-3′-UTR abolished the repression by miR-184 and the enhancement by anti-miR-184 (n = 3). For B and C, R-luc-Numbl-3′-UTR expression was normalized to control firefly luciferase (fLuc) activities.
(D, E) Overexpression of miR-184 in WT aNSCs led to reduced endogenous Numbl mRNA (D, real-time PCR, n = 3) and protein (E, representative western blot) expression.
(F, G) Mbd1 KO aNSCs exhibited reduced expression levels of both Numbl mRNA (D, real-time PCR, n = 4) and protein (E, representative western blot) expression.
(H, I) Transfection of anti-miR-184 into Mbd1 KO aNSCs could restore Numbl protein expression to levels similar to those in WT aNSCs (n = 3). *, p < 0.05; **, p < 0.01; ***, p < 0.001. (Also see Table S2)
We further determined the effect of miR-184 overexpression on endogenous Numbl expression in aNSCs. Even though miRNAs are proposed to be translational regulators, miRNA-mediated mRNA reductions have been found in cases of strong miRNA-mediated repression (Adams et al., 2007; Pandey and Picard, 2009). Indeed, we found that miR-184-transfected aNSCs showed a reduction in both Numbl mRNA (Figure 5D) and Numbl protein (Figure 5E) levels. Next we assessed Numbl expression in Mbd1 KO aNSCs that have elevated miR-184 levels and found that Mbd1 KO aNSCs also exhibited reduced levels of both Numbl mRNA (Figure 5F) and Numbl protein (Figure 5G), reminiscent of what we observed in miR-184-transfected WT aNSCs (Figure 5D and 5E). To verify that elevated miR-184 was responsible for the reduced expression of Numbl in Mbd1 KO cells, we transfected anti-miR-184 into Mbd1 KO aNSC cells and found that blocking miR-184 in Mbd1 KO cells could restore Numbl expression to levels similar to those observed in WT aNSCs (Figure 5H and 5I). Taken together, these data support the idea that Numbl is a direct target of miR-184, which is in turn regulated by MBD1 in aNSCs, and that either elevated miR-184 or Mbd1 deficiency results in the decreased expression of Numbl.
Numbl rescues the deficits associated with miR-184 overexpression in aNSCs
We next asked whether Numbl could rescue the deficits associated with miR-184 overexpression. Numbl has been shown to affect the proliferation and differentiation of embryonic NSCs (Johnson, 2003; Li et al., 2003); however, its roles in adult NSCs have not been clearly defined. We therefore tested whether overexpression of Numbl would repress the proliferation of aNSCs. As shown in Figure 6A, lentiviral expression of Numbl (without 3′-UTR) reduced the proliferation of aNSCs by 11% compared with aNSCs infected with lentivirus expressing eGFP (Figure 6A). Furthermore, acute reduction of Numbl in aNSCs using a specific siRNA led to a 78% increase in proliferation (Figure 6B). We then explored whether expression of exogenous Numbl could reverse the increased proliferation induced by miR-184 overexpression in aNSCs; indeed, coexpression of lentivirus-expressed Numbl and miR-184 substantially reduced the proliferative effect over miR-184 alone (Figure 6C).
Figure 6. Numbl rescues the aNSC deficits associated with miR-184 overexpression.

(A) Overexpression of Numbl in WT aNSCs using lentivirus resulted in reduced proliferation of aNSCs as assessed by BrdU pulse labeling (n = 3).
(B) Acute knockdown of Numbl using lentivirus expressing Numbl siRNA led to increased aNSC proliferation of aNSCs (n = 3).
(C) Expression of Numbl could suppress increased proliferation of aNSCs caused by overexpression of miR-184 (n = 3). The Numbl expression vector containing Numbl 3′-UTR (Numbl+3′-UTR) was not as effective in rescuing the proliferation effect of miR-184.
(D) Overexpression of Numbl in WT aNSCs resulted in increased neuronal differentiation as assessed by Tuj1 mRNA levels (n = 3) and NeuroD1 promoter activities (n = 3).
(E) Acute knockdown of Numbl in WT aNSCs resulted in reduced neuronal differentiation as assessed by Tuj1 mRNA levels (n = 3) and NeuroD1 promoter activities (n = 5).
(F and G) Expression of Numbl could rescue the decreased neuronal differentiation of aNSCs caused by overexpression of miR-184 as assessed by both mRNA levels of NeuroD1 (F left, n = 3) and Tuj1 (F right, n = 3) and NeuroD1 promoter activities (G, n = 6). The Numbl expression vector containing Numbl 3′-UTR (Numbl+3′-UTR) was not as effective at rescuing the differentiation effect of miR-184 overexpression (G, hatched bar). *, p < 0.05; **, p < 0.01, ***, p < 0.001.
We next assessed whether Numbl could also rescue the differentiation deficits induced by overexpression of miR-184. Since MBD1 is expressed in aNSCs and neurons, but not astrocytes, we decided to focus on neuronal differentiation for subsequent differentiation assays. As expected, Numbl expression alone led to increased neuronal differentiation (Figure 6D), whereas acute reduction of endogenous Numbl led to decreased neuronal differentiation (Figure 6E). We then demonstrated that exogenous Numbl could rescue the reduced neuronal differentiation deficits caused by miR-184 overexpression (Figure 6F). Interestingly, the Numbl expression vector containing the 3′-UTR sequence (Numbl+3′-UTR) was less effective at reversing the effect of miR-184 on both aNSC proliferation (Figure 6C, hatched bar) and neuronal differentiation (Figure 6G, hatched bar). These data support our model that Numbl is a functional target of miR-184 in aNSCs.
Numbl rescues the deficits associated with MBD1 deficiency in aNSCs
We reasoned that if MBD1 regulates Numbl expression through miR-184, exogenous MBD1 should restore Numbl expression levels in Mbd1 KO aNSCs. We therefore expressed exogenous MBD1 by lentiviral infection and assayed the level of Numbl protein by western blotting. As shown in Figure 7, MBD1 expression in KO cells restored Numbl expression to the WT level (Figure 7A and B). Consistent with the positive regulation of Numbl by MBD1, we found that Numbl expression was lower in aNSCs compared with primary neurons (Figure S7A), similar to the expression patterns of MBD1 (Figure S5A). Furthermore, the Numbl protein level was lower in Mbd1 KO hippocampal tissue compared with WT controls (Figure S7B). These data support the idea that MBD1 is a positive regulator of Numbl.
Figure 7. Numbl rescues the aNSC deficits associated with MBD1 deficiency.
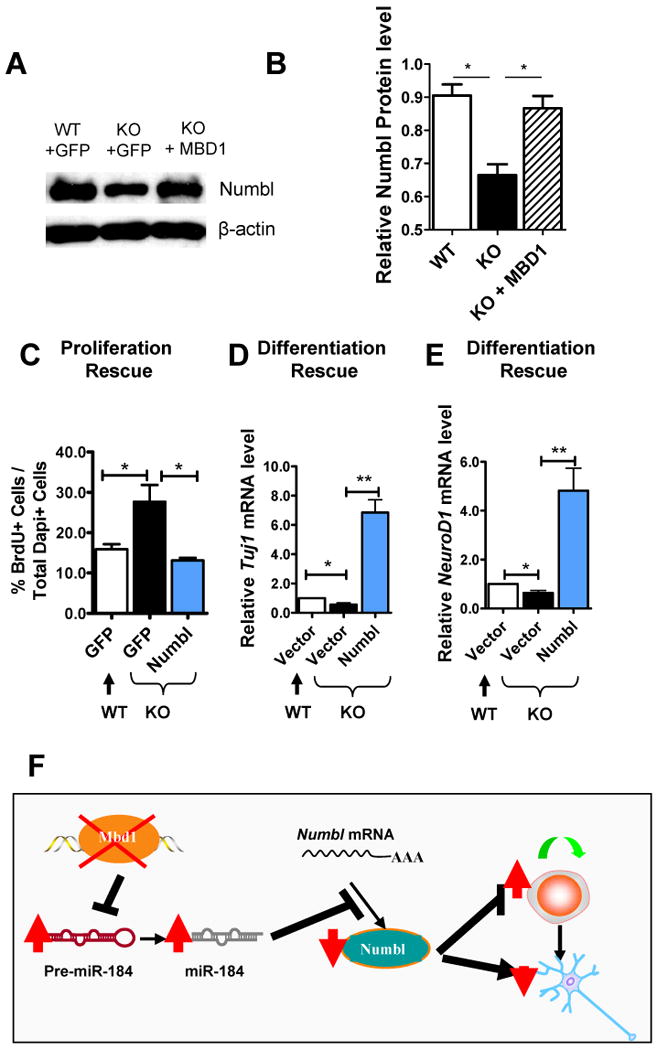
(A-B) Exogenous MBD1 expressed by a recombinant lentivirus could restore the Numbl expression levels in Mbd1 KO aNSCs to levels seen in the WT aNSCs (n = 3).
(C) Exogenous Numbl could rescue proliferation deficits exhibited by Mbd1 KO aNSCs (n = 3).
(D, E) Exogenous Numbl could rescue neuronal differentiation deficits exhibited by Mbd1 KO aNSCs as assessed by both Tuj1 and NeuroD1 mRNA expression in differentiating cells (n = 4). *, p < 0.05; **, p < 0.01. (Also see Figure S7).
(F) Model for the MBD1, miR-184, and Numbl molecular network in modulating adult neurogenesis.
Finally, we investigated whether exogenous Numbl could rescue the phenotypic deficits exhibited by Mbd1 KO aNSCs. We found that, indeed, expressed Numbl suppressed proliferation (Figure 7C) and enhanced neuronal differentiation (Figure 7D and 7E) of Mbd1 KO aNSCs. Together these results implicate Numbl as a target of a regulatory pathway in which MBD1 acts to suppress the expression of miR-184, and further indicate that miR-184 in turn promotes proliferation and represses differentiation by its downregulation of Numbl (Figure 7F).
Discussion
Although the crosstalk between miRNA and DNA methylation is likely a common mechanism regulating critical cellular processes, evidence for this in mammals has been limited. Here we demonstrate that the interplay between these epigenetic mechanisms has an important role in adult NSCs and neurogenesis. Previous studies have implicated MBD1 in the control of cellular proliferation in certain types of tumors (Klose and Bird, 2006; Sansom et al., 2007). We reported that MBD1 plays an important role in adult hippocampal neurogenesis (Zhao et al., 2003), and we found that MBD1 directly represses FGF-2 expression at the transcriptional level (Li et al., 2008). Because the promoter of the mouse Fgf-2 gene has a classic CpG island and exhibits reduced DNA methylation in Mbd1 KO aNSCs, we determined the DNA methylation status of the genomic region immediately 5′ of miR-184, which contains a few small CpG-rich regions but not a classic CpG island. Interestingly, we found no significant change in the DNA methylation levels of miR-184 in the absence of MBD1. It is possible that the promoters of Fgf-2 and miR-184 represent distinct types of promoters regulated by MBD1 via different mechanisms.
Both our data and reports by others provide strong evidence to support the idea that miR-184 is an important modulator of stem cell proliferation and growth. For instance, miR-184 has been found to regulate germline cell proliferation and patterning in Drosophila (Iovino et al., 2009). In mammals, mature miR-184 is particularly enriched in the brain and testis, and interestingly, only its expression in the brain is subjected to imprinting that selectively silences the maternal allele (Nomura et al., 2008). Whereas many imprinted genes have been reported and most of them are shown to be involved in fetal growth control (Keverne and Curley, 2008), brain-specific imprinting has been found in only a few key regulatory genes, such as UBE3A and Igf2r (Kishino, 2006). Altered miR-184 expression has been found in several types of tumors, although the proposed role of miR-184 in cell growth remains controversial (Chen and Stallings, 2007; Schafer et al., 2009; Wong et al., 2009; Wong et al., 2008; Yu et al., 2008). We found that overexpression of miR-184 repressed the proliferation of p19 embryonic carcinoma cells (data not shown), which is different from its effects on primary aNSCs. Therefore, the effect of miR-184 on cell proliferation may in fact be context-dependent, and primary cells are necessary for studying normal biological pathways.
Despite having largely overlapping expression profiles, Mecp2 and MBD1 seem to have distinct functions in the nervous system. MBD1 regulates NSC differentiation in adult brains (Li et al., 2008; Zhao et al., 2003), while MeCP2 is involved mainly in the maturation of young neurons (Smrt et al., 2007). Both MBD1 and MeCP2 are known to repress imprinted genes (Klose and Bird, 2006), and MeCP2 also binds the 5′ region of miR-184 and represses miR-184 expression in cultured neurons (Nomura et al., 2008). However, miR-184 levels have been reported to be reduced in the brains of MeCP2 KO animals (Nomura et al., 2008). We found that miR-184 levels were unchanged in aNSCs derived from MeCP2 KO mice, and acute knockdown of MeCP2 in Mbd1 KO aNSCs has no additional effect on miR-184 expression (unpublished data), suggesting that MBD1 is the major regulator of miR-184 in aNSCs. Whether MeCP2 directly regulates miR-184 in the brain therefore remains to be seen.
Numb and Numbl are related proteins that have been implicated in embryonic brain development, although their precise functions are somewhat controversial (Petersen et al., 2004). Numb is localized in stem and progenitor cells and is thought to be involved in the asymmetric cell division of cultured primary cortical progenitors (Shen et al., 2002). The function of Numbl, on the other hand, is less clear. While Numb mutation results in severe neurogenic deficits and embryonic lethality, Numbl-deficient mice do not show significant abnormalities in neurogenesis. Nevertheless, double mutant mice exhibit earlier and more widespread neurogenic defects, indicating that Numbl and Numb share a pathway that regulates embryonic aNSCs, although how they interact is unknown (Li et al., 2003; Petersen et al., 2002). We showed that acute knockdown of Numbl significantly affects the proliferation and differentiation of aNSCs. This might be explained by the fact that acute knockdown of a gene via siRNA generally yields a more significant phenotype compared with standard genetic knockout, likely due to a compensatory effect elicited by other proteins in the same pathway during development. In addition, both Numb and Numbl can inhibit the Notch pathway (Petersen et al., 2006; Zhong et al., 1997). Our ongoing work shows that two downstream effectors of Notch signaling, Hes1 and Hes5, are elevated under both MBD1-deficient and miR-184-overexpressing conditions, and this could be reversed by either exogenous MBD1 or a miR-184 inhibitor (data not shown). Moreover, a high level of Notch signaling has also been shown to repress Numb and Numblike expression (Chapman et al., 2006). Even though Numb is not a predicted target of miR-184, we still found that Numb expression is also reduced in miR-184-overexpressing aNSCs (data not shown), possibly due to elevated Notch signaling. The downregulation of Numb may further contribute to the aNSC phenotypes we observed in both MBD1-deficient and miR-184-overexpressing aNSCs with reduced Numbl expression. Therefore, Numbl plays important modulatory roles in aNSCs, potentially via Notch signaling and subsequently Numb. Future studies extending beyond the current manuscript will give us a better understanding of the complex pathway regulating aNSCs.
Taken together, our data suggest that MBD1, miR-184, and Numbl form a novel regulatory network that controls the balance between the proliferation and differentiation of aNSCs. Deciphering such a mechanism represents a step towards unraveling the regulatory network that underlies adult brain plasticity and brings us closer to eventually realizing the potential of stem cells to repair the brain.
Experimental Procedures
Isolation and Analyses of aNSCs
Adult aNSCs used in this study were isolated from adult male Mbd1 KO mice and WT littermates as described (Zhao et al., 2003)(Babu et al., 2007). Proliferation and differentiation analyses were carried out as described.
Expression Analysis of Mature miRNAs
Profiling of mature miRNA expression was performed using Applied Biosystems' TaqMan® microRNA Assays according to protocols provided by vendor. Individual reverse transcription and TaqMan® microRNA assays were performed on an Applied Biosystems 7300 Instrument.
Chromatin Immunoprecipitation
ChIP was performed according to published methods (Allan et al., 2008). Antibodies used were normal Rabbit IgG (Upstate, 12-370), rabbit MBD1 (M-254, SC-10751, Santa Cruz Biotechnology), rabbit H3K4Me3 (Abcam, ab8580), rabbit H3K9ace (Upstate, 07-352), H3K27Me3 (Upstate, 07-449), and 5-methylcytidine antibody (Eurogentec, BI-MECY-0500).
RNA and DNA Plasmid
Control miR (miR-C), miR-184, anti-miR-184, and anti-miR control (Anti-C) were purchased from GenePharm (Shanghai, China). NeuroD1-luciferase DNA, GFAP-luciferase, and E1α-R-luc DNA plasmids were described previously (Barkho et al., 2006). MBD1 expression and siRNA constructs were described previously (Li et al., 2008). Numbl expression plasmid was purchased from Open Biosystems. Numbl shRNA plasmid was purchased from SABioscience. Lentivirus-shControl was described previously (Barkho et al., 2008; Li et al., 2008). Lentivector expressing sh-miR-184 was cloned as described previously (Barkho et al., 2008; Li et al., 2008). Retroviral vector expressing miR-184 and GFP was engineered by deleting the original HpaI and ClaI sites in the CAG-GFP vector (Smrt et al., 2007) and inserting new HpaI and ClaI sites 5′-upstream from CAG promoter. The U6-miR-184 or UR-shControl cassettes (described above) were then inserted between the HapI and ClaI sites (Figure 4).
Electroporation, Transfection, and Luciferase Assay of aNSCs
Electroporation of RNA or plasmid DNA into aNSCs and the luciferase assay were carried out using an Amaxa Nucleofector electroporator (Amaxa) based on the manufacturer's protocol with modifications (Li et al., 2008). Transfection of aNSCs was carried out using either Fugene HD (Roche) or StemFect (Stemgent) based on the manufacturer's protocol with modification. At 16-20 hours post-electroporation or transfection, cells were changed into differentiation medium for 24-48 hours before harvesting. Luciferase activity was detected using the Dual-Luciferase Reporter 1000 System (Promega) based on the manufacturer's protocol.
In vivo Retroviral Grafting
Retroviral production and in vivo retroviral grating was performed as described (Smrt et al., 2007). Briefly, ∼1 μl (> 5×10⁵/μl) of virus was injected stereotaxically into the DG. Mice received 2 BrdU injections per day (50 mg/kg, i.p.) for a total 7 injections and were perfused with 4% PFA at one week after viral grafting.
3′-UTR Dual Luciferase Assays
The 3′-UTR sequence of Numbl was PCR-amplified directly from cDNA of proliferating aNSCs and cloned into psiCHECK-2 dual luciferase vector with Numbl-3′-UTR following the coding sequence of R-Luc (Promega). The constructs were co-transfected with small RNAs into aNSCs using FuGENE HD transfection reagent, and luciferase activities were detected using the Dual luciferase reporter system (Promega). R-luc activities were first normalized to internal control f-Luc activities to control transfection efficiency. Each transfection was done in > 3 replicates that were averaged as n = 1. miR-184-mediated repression of R-luc/f-Luc activity was then calculated as the ratio of R-luc/fLuc in the miR-184 or anti-miR-184 transfected conditions to R-luc/fLuc in the miR-C or anti-C control conditions.
Western Blotting
Protein samples were separated on SDS-PAGE gels (Bio-Rad) and then transferred to PVDF membranes (Millipore). Membranes were processed following the ECL Western blotting protocol (GE Healthcare). Rabbit anti-MBD1 (Santa Cruz, SC-10751) or rabbit anti-Numbl (Abcam, ab37500-100) were used as primary antibodies. HRP-labeled secondary antibodies were obtained from Sigma. For loading controls, membranes were stripped and reprobed with the mouse antibody against β-Actin (Sigma A5441).
Real-time PCR
RNA isolation, cDNA synthesis, and real-time PCR analyses were performed as described (Barkho et al., 2008; Li et al., 2008). The primer sequences are provided in Supplemental Data.
Fluorescence In Situ Hybridization (FISH)
miR-184 FISH and combined FISH and immunohistology were performed on 10-μm frozen thin sections of 4% paraformaldehyde-fixed brains using a LNA probe (Exiqon), based on a previously described protocol (Silahtaroglu et al., 2007).
Statistical Analysis
Statistical analysis was performed using ANOVA and Student's t-test, unless specified with the aid of SPSS v.17. All percentages were arcsine-transformed before statistical analysis. The Bonferroni correction was used to control type I error (Rice, 1989). We first normalized the treatment group by the control group for luciferase, RT-PCR, and cell counting analyses, and then one-sample t-test against a mean of 1 was used on the normalized values. All data were shown as mean with standard error of mean (mean ± SEM). Probabilities of P < 0.05 were considered significant.
Supplementary Material
Acknowledgments
We thank Dr. M.C. Wilson, Dr. T. Xie, and Ms. C.T. Strauss for editing the manuscript and Dr. W. Zhong for providing Numbl antibody. Images were generated in the UNM Cancer Center Fluorescence Microscopy Facility. This work was supported by grants from the International Rett Syndrome Foundation and the NIH (MH080434 and MH078972) to X.Z., an Autism Speaks Postdoctoral Fellowship to C.L., and a MARC fellowship to N.J.S. (NIH/T34GM00851).
Footnotes
Supplemental Data: Supplemental data includes 7 figures, 2 tables, and Supplemental Experimental Procedures.
Publisher's Disclaimer: This is a PDF file of an unedited manuscript that has been accepted for publication. As a service to our customers we are providing this early version of the manuscript. The manuscript will undergo copyediting, typesetting, and review of the resulting proof before it is published in its final citable form. Please note that during the production process errors may be discovered which could affect the content, and all legal disclaimers that apply to the journal pertain.
References
- Adams BD, Furneaux H, White BA. The micro-ribonucleic acid (miRNA) miR-206 targets the human estrogen receptor-alpha (ERalpha) and represses ERalpha messenger RNA and protein expression in breast cancer cell lines. Mol Endocrinol. 2007;21:1132–1147. doi: 10.1210/me.2007-0022. [DOI] [PubMed] [Google Scholar]
- Allan AM, Liang X, Luo Y, Pak C, Li X, Szulwach KE, Chen D, Jin P, Zhao X. The loss of methyl-CpG binding protein 1 leads to autism-like behavioral deficits. Hum Mol Genet. 2008;17:2047–2057. doi: 10.1093/hmg/ddn102. [DOI] [PMC free article] [PubMed] [Google Scholar]
- Babu H, Cheung G, Kettenmann H, Palmer TD, Kempermann G. Enriched monolayer precursor cell cultures from micro-dissected adult mouse dentate gyrus yield functional granule cell-like neurons. PLoS ONE. 2007;2:e388. doi: 10.1371/journal.pone.0000388. [DOI] [PMC free article] [PubMed] [Google Scholar]
- Barkho BZ, Munoz AE, Li X, Li L, Cunningham LA, Zhao X. Endogenous matrix metalloproteinase (MMP)-3 and MMP-9 promote the differentiation and migration of adult neural progenitor cells in response to chemokines. Stem Cells. 2008;26:3139–3149. doi: 10.1634/stemcells.2008-0519. [DOI] [PMC free article] [PubMed] [Google Scholar]
- Barkho BZ, Song HJ, Aimone JB, Smrt RD, Kuwabara T, Nakashima K, Gage FH, Zhao XY. Identification of astrocyte-expressed factors that modulate neural stem/progenitor cell differentiation. Stem Cells and Development. 2006;15:407–421. doi: 10.1089/scd.2006.15.407. [DOI] [PMC free article] [PubMed] [Google Scholar]
- Bernstein BE, Meissner A, Lander ES. The mammalian epigenome. Cell. 2007;128:669–681. doi: 10.1016/j.cell.2007.01.033. [DOI] [PubMed] [Google Scholar]
- Chapman G, Liu L, Sahlgren C, Dahlqvist C, Lendahl U. High levels of Notch signaling down-regulate Numb and Numblike. J Cell Biol. 2006;175:535–540. doi: 10.1083/jcb.200602009. [DOI] [PMC free article] [PubMed] [Google Scholar]
- Chen Y, Stallings RL. Differential patterns of microRNA expression in neuroblastoma are correlated with prognosis, differentiation, and apoptosis. Cancer Res. 2007;67:976–983. doi: 10.1158/0008-5472.CAN-06-3667. [DOI] [PubMed] [Google Scholar]
- Cheng LC, Pastrana E, Tavazoie M, Doetsch F. miR-124 regulates adult neurogenesis in the subventricular zone stem cell niche. Nat Neurosci. 2009;12:399–408. doi: 10.1038/nn.2294. [DOI] [PMC free article] [PubMed] [Google Scholar]
- Ge S, Goh EL, Sailor KA, Kitabatake Y, Ming GL, Song H. GABA regulates synaptic integration of newly generated neurons in the adult brain. Nature. 2006;439:589–593. doi: 10.1038/nature04404. [DOI] [PMC free article] [PubMed] [Google Scholar]
- Huang DW, Sherman BT, Lempicki RA. and integrative analysis of large gene lists using DAVID Bioinformatics Resources. Nature Protoc. 2009;4:44–57. doi: 10.1038/nprot.2008.211. [DOI] [PubMed] [Google Scholar]
- Iovino N, Pane A, Gaul U. miR-184 has multiple roles in Drosophila female germline development. Dev Cell. 2009;17:123–133. doi: 10.1016/j.devcel.2009.06.008. [DOI] [PubMed] [Google Scholar]
- John B, Enright AJ, Aravin A, Tuschl T, Sander C, Marks DS. Human MicroRNA targets. PLoS Biol. 2004;2:e363. doi: 10.1371/journal.pbio.0020363. [DOI] [PMC free article] [PubMed] [Google Scholar]
- Johnson JE. Numb and Numblike control cell number during vertebrate neurogenesis. Trends Neurosci. 2003;26:395–396. doi: 10.1016/S0166-2236(03)00166-8. [DOI] [PubMed] [Google Scholar]
- Jorgensen HF, Ben-Porath I, Bird AP. Mbd1 is recruited to both methylated and nonmethylated CpGs via distinct DNA binding domains. Mol Cell Biol. 2004;24:3387–3395. doi: 10.1128/MCB.24.8.3387-3395.2004. [DOI] [PMC free article] [PubMed] [Google Scholar]
- Keverne EB, Curley JP. Epigenetics, brain evolution and behaviour. Front Neuroendocrinol. 2008;29:398–412. doi: 10.1016/j.yfrne.2008.03.001. [DOI] [PubMed] [Google Scholar]
- Kishino T. Imprinting in neurons. Cytogenet Genome Res. 2006;113:209–214. doi: 10.1159/000090834. [DOI] [PubMed] [Google Scholar]
- Klose RJ, Bird AP. Genomic DNA methylation: the mark and its mediators. Trends Biochem Sci. 2006;31:89–97. doi: 10.1016/j.tibs.2005.12.008. [DOI] [PubMed] [Google Scholar]
- Krek A, Grun D, Poy MN, Wolf R, Rosenberg L, Epstein EJ, MacMenamin P, da Piedade I, Gunsalus KC, Stoffel M, et al. Combinatorial microRNA target predictions. Nat Genet. 2005;37:495–500. doi: 10.1038/ng1536. [DOI] [PubMed] [Google Scholar]
- Lewis BP, Shih IH, Jones-Rhoades MW, Bartel DP, Burge CB. Prediction of mammalian microRNA targets. Cell. 2003;115:787–798. doi: 10.1016/s0092-8674(03)01018-3. [DOI] [PubMed] [Google Scholar]
- Li HS, Wang D, Shen Q, Schonemann MD, Gorski JA, Jones KR, Temple S, Jan LY, Jan YN. Inactivation of Numb and Numblike in embryonic dorsal forebrain impairs neurogenesis and disrupts cortical morphogenesis. Neuron. 2003;40:1105–1118. doi: 10.1016/s0896-6273(03)00755-4. [DOI] [PubMed] [Google Scholar]
- Li X, Barkho BZ, Luo Y, Smrt RD, Santistevan NJ, Liu C, Kuwabara T, Gage FH, Zhao X. Epigenetic regulation of the stem cell mitogen FGF-2 by mbd1 in adult neural stem/progenitor cells. J Biol Chem. 2008 doi: 10.1074/jbc.M804899200. in press. [DOI] [PMC free article] [PubMed] [Google Scholar]
- Li X, Zhao X. Epigenetic regulation of mammalian stem cells. Stem Cells Dev. 2008;17:1–10. doi: 10.1089/scd.2008.0036. [DOI] [PMC free article] [PubMed] [Google Scholar]
- Liu C, Zhao X. MicroRNAs in Adult and Embryonic Neurogenesis. Neuromolecular Med. 2009 doi: 10.1007/s12017-009-8077-y. [DOI] [PMC free article] [PubMed] [Google Scholar]
- Nomura T, Kimura M, Horii T, Morita S, Soejima H, Kudo S, Hatada I. MeCP2-dependent repression of an imprinted miR-184 released by depolarization. Hum Mol Genet. 2008;17:1192–1199. doi: 10.1093/hmg/ddn011. [DOI] [PubMed] [Google Scholar]
- Pandey DP, Picard D. miR-22 inhibits estrogen signaling by directly targeting the estrogen receptor alpha mRNA. Mol Cell Biol. 2009;29:3783–3790. doi: 10.1128/MCB.01875-08. [DOI] [PMC free article] [PubMed] [Google Scholar]
- Petersen PH, Tang H, Zou K, Zhong W. The enigma of the numb-Notch relationship during mammalian embryogenesis. Dev Neurosci. 2006;28:156–168. doi: 10.1159/000090761. [DOI] [PubMed] [Google Scholar]
- Petersen PH, Zou K, Hwang JK, Jan YN, Zhong W. Progenitor cell maintenance requires numb and numblike during mouse neurogenesis. Nature. 2002;419:929–934. doi: 10.1038/nature01124. [DOI] [PubMed] [Google Scholar]
- Petersen PH, Zou K, Krauss S, Zhong W. Continuing role for mouse Numb and Numbl in maintaining progenitor cells during cortical neurogenesis. Nat Neurosci. 2004;7:803–811. doi: 10.1038/nn1289. [DOI] [PubMed] [Google Scholar]
- Rice WR. Analyzing Tables of Statistical Tests. Evolution. 1989;43:223–225. doi: 10.1111/j.1558-5646.1989.tb04220.x. [DOI] [PubMed] [Google Scholar]
- Sansom OJ, Maddison K, Clarke AR. Mechanisms of disease: methyl-binding domain proteins as potential therapeutic targets in cancer. Nat Clin Pract Oncol. 2007;4:305–315. doi: 10.1038/ncponc0812. [DOI] [PubMed] [Google Scholar]
- Schafer A, Jung M, Mollenkopf HJ, Wagner I, Stephan C, Jentzmik F, Miller K, Lein M, Kristiansen G, Jung K. Diagnostic and prognostic implications of microRNA profiling in prostate carcinoma. Int J Cancer. 2009 doi: 10.1002/ijc.24827. [DOI] [PubMed] [Google Scholar]
- Shen Q, Temple S. Fine control: microRNA regulation of adult neurogenesis. Nat Neurosci. 2009;12:369–370. doi: 10.1038/nn0409-369. [DOI] [PubMed] [Google Scholar]
- Shen Q, Zhong W, Jan YN, Temple S. Asymmetric Numb distribution is critical for asymmetric cell division of mouse cerebral cortical stem cells and neuroblasts. Development. 2002;129:4843–4853. doi: 10.1242/dev.129.20.4843. [DOI] [PubMed] [Google Scholar]
- Silahtaroglu AN, Nolting D, Dyrskjot L, Berezikov E, Moller M, Tommerup N, Kauppinen S. Detection of microRNAs in frozen tissue sections by fluorescence in situ hybridization using locked nucleic acid probes and tyramide signal amplification. Nat Protoc. 2007;2:2520–2528. doi: 10.1038/nprot.2007.313. [DOI] [PubMed] [Google Scholar]
- Smrt RD, Eaves-Egenes J, Barkho BZ, Santistevan NJ, Zhao C, Aimone JB, Gage FH, Zhao X. Mecp2 deficiency leads to delayed maturation and altered gene expression in hippocampal neurons. Neurobiol Dis. 2007;27:77–89. doi: 10.1016/j.nbd.2007.04.005. [DOI] [PMC free article] [PubMed] [Google Scholar]
- van Praag H, Schinder AF, Christie BR, Toni N, Palmer TD, Gage FH. Functional neurogenesis in the adult hippocampus. Nature. 2002;415:1030–1034. doi: 10.1038/4151030a. [DOI] [PMC free article] [PubMed] [Google Scholar]
- Wong TS, Ho WK, Chan JY, Ng RW, Wei WI. Mature miR-184 and squamous cell carcinoma of the tongue. ScientificWorldJournal. 2009;9:130–132. doi: 10.1100/tsw.2009.12. [DOI] [PMC free article] [PubMed] [Google Scholar]
- Wong TS, Liu XB, Wong BY, Ng RW, Yuen AP, Wei WI. Mature miR-184 as Potential Oncogenic microRNA of Squamous Cell Carcinoma of Tongue. Clin Cancer Res. 2008;14:2588–2592. doi: 10.1158/1078-0432.CCR-07-0666. [DOI] [PubMed] [Google Scholar]
- Yu J, Ryan DG, Getsios S, Oliveira-Fernandes M, Fatima A, Lavker RM. MicroRNA-184 antagonizes microRNA-205 to maintain SHIP2 levels in epithelia. Proc Natl Acad Sci U S A. 2008;105:19300–19305. doi: 10.1073/pnas.0803992105. [DOI] [PMC free article] [PubMed] [Google Scholar]
- Zhao C, Deng W, Gage FH. Mechanisms and functional implications of adult neurogenesis. Cell. 2008;132:645–660. doi: 10.1016/j.cell.2008.01.033. [DOI] [PubMed] [Google Scholar]
- Zhao C, Sun G, Li S, Shi Y. A feedback regulatory loop involving microRNA-9 and nuclear receptor TLX in neural stem cell fate determination. Nat Struct Mol Biol. 2009;16:365–371. doi: 10.1038/nsmb.1576. [DOI] [PMC free article] [PubMed] [Google Scholar]
- Zhao X, Ueba T, Christie BR, Barkho B, McConnell MJ, Nakashima K, Lein ES, Eadie BD, Willhoite AR, Muotri AR, et al. Mice lacking methyl-CpG binding protein 1 have deficits in adult neurogenesis and hippocampal function. Proc Natl Acad Sci U S A. 2003;100:6777–6782. doi: 10.1073/pnas.1131928100. [DOI] [PMC free article] [PubMed] [Google Scholar]
- Zhong W, Jiang MM, Weinmaster G, Jan LY, Jan YN. Differential expression of mammalian Numb, Numblike and Notch1 suggests distinct roles during mouse cortical neurogenesis. Development. 1997;124:1887–1897. doi: 10.1242/dev.124.10.1887. [DOI] [PubMed] [Google Scholar]
Associated Data
This section collects any data citations, data availability statements, or supplementary materials included in this article.