

Abstract
Protein recognition of DNA sites is a primary event for gene function. Its ultimate mechanistic understanding requires an integrated structural, dynamic, kinetic, and thermodynamic dissection that is currently limited considering the hundreds of structures of protein-DNA complexes available. We describe a protein-DNA-binding pathway in which an initial, diffuse, transition state ensemble with some nonnative contacts is followed by formation of extensive nonnative interactions that drive the system into a kinetic trap. Finally, nonnative contacts are slowly rearranged into native-like interactions with the DNA backbone. Dissimilar protein-DNA interfaces that populate along the DNA-binding route are explained by a temporary degeneracy of protein-DNA interactions, centered on “dual-role” residues. The nonnative species slow down the reaction allowing for extended functionality.
Keywords: energy landscape, human papillomavirus E2 protein, kinetic trap, kinetics, protein-DNA interaction
The formation of specific protein-DNA complexes is key to the regulation of genome replication and expression. Understanding of such a fundamental molecular mechanism requires the integration of structure, thermodynamics, and kinetics. Most specific DNA-binding proteins show measurable affinity to DNA sequences bearing no similarity to their target site (1, 2). It is, thus, generally accepted that these proteins first bind nonspecifically to genomic DNA which speeds up the search for their target sequence through facilitated diffusion (3). The kinetics of DNA sequence recognition (3, 4) often involve multistate kinetic routes with populated intermediates (4–8). The build up of molecular interactions along multistate routes has been deduced indirectly from structural and thermodynamic studies (1–3, 9–17), but kinetic characterization of intermediates and transition state ensembles is still scarce.
The structures of several proteins in complex with target DNA sites, variants thereof and random DNA sequences, have been solved and used as models for transient intermediates of specific recognition (10–17). It has been found that proteins contact the DNA using approximately the same binding site and orientation in all complexes (10–18). In nonspecific complexes, the interface between the two molecules is stabilized by electrostatic interactions between charged protein side chains and the DNA backbone (1, 9–17). In complexes with target DNA sites, there are also interactions between side chains and bases (10–17). Strikingly, some so-called “dual-role residues” interact with the DNA backbone in nonspecific complexes and with DNA bases in specific complexes (14, 15, 17) or form different interactions with bases in nonspecific and specific complexes (13). These residues are postulated to form transient “nonnative” interactions. Because these studies are not time-resolved, the existence of nonnative interactions and their influence on the overall rate of specific complex formation remains to be directly tested.
Specific binding of the C-terminal domain of the human papillomavirus type 16 E2 master regulator (E2C) to its four target DNA sites in the viral genome is a well-characterized regulatory event (19–21) and an excellent model system that has been thoroughly studied from the structural, dynamic and thermodynamic viewpoints (19, 21–25). The energy landscape that underlies E2C binding to a short oligonucleotide populates two main routes. One of them can be described as 2-state and the other appears to populate at least two intermediates (4):

The rate-limiting transition state ensemble for the two-state route is stabilized mainly by specific interactions similar to those in the final complex (“native-like”), compatible with a minimally frustrated free energy landscape for sequence recognition (26). Here, we characterize the molecular interactions along the multistate route that allow us to map the overall topography of the binding energy landscape.
Results
Mutagenesis of the Multistate Route.
The HPV16 E2C domain folds into a homodimeric β-barrel wrapped by four α helices and two 310 helices (19, 22, 23). The domain is a very stable homodimer with a Kd of 0.4 nM under the conditions used in this work (27). Because we perform our measurements at 20 nM E2C or higher concentrations, it is safe to consider the monomer-dimer equilibrium negligible. The E2C domain does not fold or drastically change its average structure upon specific DNA-binding, undergoing only subtle changes in conformation and larger changes in the dynamics (23, 24). The HPV16 E2C-DNA interface involves a pseudopalindromic 14-base long DNA target site and 16 E2C residues as shown by detailed comparison of homologous E2C-DNA complexes, mutagenesis and biophysical measurements (19, 23–26) (Fig. 1A). Five highly conserved residues from α1 form specific contacts to DNA bases (19, 23–26) and are the main determinants of E2C sequence specificity (20). Twelve residues, mainly from helix α1, the 310 helix and the β2-β3 loop of each monomer, form only nonspecific contacts with the DNA backbone (23, 24, 26).
Fig. 1.

Effect of point mutations on the stability of the first and last transition state ensembles in the multistate E2C-DNA kinetic route. (A) Representation of the effects on  on the surface of the DNA-bound conformation of the HPV16 E2C homodimer (23). Relevant residues are labeled in a single monomer for clarity. Residues in α1 contacting the DNA bases as deduced from homologous E2C-DNA complexes, mutagenesis, and biophysical measurements (19, 23–26) (N294, K297, C298, Y301, and R302) are Underlined. Residues N294, K297, Y301, and R302 also form nonspecific contacts with the DNA backbone as well as two other residues in α1, T295 and R300 (19, 23–26). K304 and K305 from the 310 helix; V324, K325, and K327 from the β2-β3 loop; and T316, H318, K349, and T353 outside of the major recognition elements also form nonspecific contacts with the DNA backbone (23, 24, 26). Residues are colored according to changes in free energy upon mutation to alanine, except for K297R, R300M, and R302M. Uncharacterized residues are colored gray. (B) Comparison of the effects on
  (Blue Bars) and on the final complex (Black Bars). (C) Representation of the effects on
  on the surface of the DNA-bound conformation of the HPV16 E2C homodimer (23). (D) Comparison of the effects on
  (Green Bars) and on the final complex (Black Bars).
In previous work, we used a fluorescein-labeled cognate DNA site (Site35-18, which includes two flanking nucleotides at either side of the 14-base E2C target sequence) to measure equilibrium E2C-DNA binding for 17 E2C point mutants and characterized the contribution of 13 of the 16 interfacial residues to the stability of the final complex (25). We also reported the rate constants for association and dissociation along the two-state and multistate kinetic routes for 17 E2C point mutants (26) (Table S1 and Figs. S1 and S2). We assigned the rate constants to the two kinetic routes and used those corresponding to the two-state route to characterize the contribution of 10 of the 16 interfacial residues to the stability of the transition state ensemble of the two-state route (TSE2-state) (26). Here, we present data for the K349A mutant and use the rate constants assigned to the E2C-DNA multistate route to describe the energetics of 11 of the 16 interfacial residues in the first and last transition state ensembles for the multistate route. Additionally, we measure intrinsic E2C tryptophan fluorescence and ANS release to follow the interconversion of the intermediates populated along the multistate route (4) (Table S1 and Figs. S3 and S4. The effect of mutations on the stability of the final complex (25) and the kinetics of the two-state route (26) serve as a reference to interpret the results.
Early Transition State Ensemble ( ).
).
The first step of the E2C-DNA multistate route is the association of the free reagents to form an encounter complex (4). The free energy barrier that separates the unbound reagents from the encounter complex and the transmission coefficient determine the rate constant for association,  . Assuming that the transmission coefficient is the same for all E2C variants, we can evaluate the effect of mutations on the free energy barrier,
  , from the association rate constants for the wild type and mutant complexes:
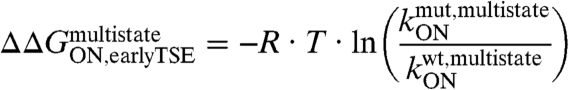 |
The results for 17 E2C mutants are shown in Table S1 and Fig. 1A and B. The effects of most mutations on the association rate, thus, on stability of  are small, with 14 mutants decreasing
  3-fold or less. This is consistent with a nonspecific association of the two molecules. Mutations Y301N, K304A, and K325R decrease
  at least 5-fold, and mutations K304A and K325R decrease
  at least 10-fold, standing out as likely “hot spots” for this first reaction step.
Remarkably, mutations K325R and K297R have opposite effects on the stability of  and that of the final complex. Namely, K325R stabilizes the final complex by 0.5 kcal/mol but destabilizes
  by 2.5 kcal/mol, and mutation K297R destabilizes the final complex by 3.3 kcal/mol but stabilizes
  by 0.6 kcal/mol. We interpret that these two side chains form intermolecular interactions in
  with energetics that are drastically different from those in the final complex, that is, the interactions are nonnative (28).
Intermediate Interconversion Along the Multistate Route.
After crossing  the E2C:DNA complex populates at least two intermediates, as indicated by two concentration-independent phases in the association kinetics followed by tryptophan fluorescence, with rate constants of 27.7 and 0.019 s-1 for wild type E2C (Table S1) (4). The faster phase monitors the interconversion between the encounter complex and a late intermediate (Ilate) (4), while the slower phase is the rate-limiting step of the multistate route and reports the conversion of Ilate into the final native complex (4).
The association kinetics of ANS-bound E2C to DNA report on the kinetics of desolvation of the E2C-DNA interface (4). They present a decrease in fluorescence with a single rate constant of 0.027 s-1, indicating that the DNA does not displace ANS until the last, rate-limiting step of the route (4). All tested E2C variants show ANS release upon formation of the final complex, with a rate constant that matches the slowest tryptophan phase (Table S1, Fig S5, correlation R-value 0.88, p-value 0.004, and slope 1.10 ± 0.15). This indicates that the multistate route is robust to small amino acid perturbations.
We observe that nine of the mutations change the rate constant for the faster tryptophan phase 2-fold or less, whereas seven variants of K297, C298, Y301, K304, K305, K325, and K327 slow down this phase more than 2-fold (Table S1 and Fig. 2A White Bars). This strongly suggests that the interactions formed between these wild type side chains and the DNA accelerate conversion from the encounter complex to Ilate.
Fig. 2.

Effect of point mutations on the fast and slow concentration-independent association phases in the multistate E2C-DNA kinetic route. (A) Bar plot of the effects on the fast (Empty Bars) and slow phases (Black Bars). Thin Lines are a guide for the eye and correspond to a 2-fold change in the rate constant. (B) Correlation between the mutational effects on the fast and slow phases. R is -0.75, p-value is 0.011.
Strikingly, 10 of the mutations lead to at least a 2-fold increase in the rate constant for the slower tryptophan phase and none of the mutations decreases it (Table S1 and Fig. 2A Black Bars). This implies that the interactions formed in Ilate by K297, C298, Y301, K305, V324, K325, and K327 slow down rearrangement of this species into the native complex. In other words, Ilate is a kinetic trap stabilized by interactions that must break apart to reach the global free energy minimum.
The DNA oligonucleotide used in this and previous work, Site35-18 (4, 25, 26), includes two flanking nucleotides at either side of the 14-base E2C target sequence (20). We have used tryptophan fluorescence to measure the association kinetics of E2C to Site35-18, Site35-48, and Site35-80, double-stranded oligonucleotides where the 14-base specific sequence is flanked at either side by a randomized sequence of 2, 17, and 33 nucleotides, respectively (Table 1 and Fig. S6). Due to the smaller amplitude compared to the fluorescein-labeled DNA, only one bimolecular reaction was observed. Interestingly, between the three oligonucleotides there are only 1.6-fold or smaller differences in the rate constants for association and dissociation of the encounter complex and in the fast and slow concentration-independent tryptophan phases that monitor formation and escape from the kinetic trap in the multistate route. Thus, the kinetic trap is not affected by the presence of flanking nonspecific DNA.
Table 1.
Association kinetics of E2C to a specific sequence within oligonucleotides of different lengths
| Site35 | kON/108 (M-1 s-1) | kOFF (encounter complex) (s-1) | kWfast (s-1) | kWslow (s-1) |
| 18 | 9.8 ± 1.2 | 22 ± 8 | 27.7 ± 2.8 | 0.019 ± 0.001 |
| 48 | 6.6 ± 0.6 | 16 ± 4 | 17.2 ± 0.6 | 0.019 ± 0.001 |
| 80 | 8.1 ± 1.4 | 17 ± 11 | 20.7 ± 1.1 | 0.023 ± 0.001 |
Kinetics were followed by intrinsic tryptophan fluorescence (4). The sequences of Site35-18, Site35-48, and Site35-80 are 5′ GTA ACC GAA ATC GGT TGA 3′, 5′ GCC CAT TTT GTA GCT GTA ACC GAA ATC GGT TGA ATG CTT TTT GGC ACA 3′, and 5′ TCT TTG TTC GGA CTG GGC CCA TTT TGT AGC TGT AAC CGA AAT CGG TTG AAT GCT TTT TGG CAC ACA TCG ACA GTC TGA CG 3′, resp. (specific sequence is in bold).
Late Transition State Ensemble ( ).
).
Exiting the kinetic trap that precedes the final complex requires crossing a large free energy barrier determined by  (4). We next investigate which intermolecular interactions stabilize
  , relative to the unbound reagents, by evaluating the effect of a mutation on the stability of the final complex and on the rate constant for dissociation as follows:
 |
The results are shown in Table S1 and Fig. 1A and B. For seven of the nine mutations probing residues that interact with the DNA backbone in the native complex, T295A, K305A, V324A, K325A, K325R, K327A, and K327R, the effect of mutation on  is approximately the same as for the stability of the native complex. Only mutations K304A and K349A destabilize
  much less than they destabilize the native complex. On the other hand, only two of the mutations probing residues that interact with DNA bases in the native complex, K297R and Y301N, destabilize
  significantly. The other four mutations, Y301F, Y301A, R302M, and R302Q, change the stability of
  by 0.36 kcal/mol at most, clearly less than for the final complex. Thus, the energetics of the nonspecific interactions with the DNA backbone in
  resemble those in the native complex. The side chains making specific interactions in the native complex contribute only marginally to the stability of
  .
.
Prevailing Role of Nonnative Interactions in the Multistate Route.
Combining the data for  and
and  with the effect of mutations on the two tryptophan phases allows for a general picture to emerge.
  is stabilized by nonnative interactions involving residues K325 and K297 (see above). Mutation K304A is a “hot spot” for
  but has nearly no effect on the on the stability of
  , suggesting that K304 also forms nonnative interactions in
  .
.
After crossing of  and formation of the encounter complex, the wild type side chains of K297, C298, Y301, K304, K305, V324, K325, and K327 speed up the fast tryptophan phase. We interpret that formation of Ilate involves more nonnative interactions than the few present in
  . Escape from this kinetic trap requires a reorganization of the E2C-DNA interactions. The energetics of K305, V324, K325, and K327 become similar to those in the final complex, whereas the interactions formed by K297, C298, Y301, and K304 are partial or totally disrupted. T295 plays a significant role in the multistate route by forming native-like interactions in
  , whereas R302 and K349 only contribute to the stability of the final E2C-DNA complex and do not appear to play a role in the kinetics.
The molecular picture that emerges for the E2C-DNA multistate route is an early formation of nonnative interactions that eventually lead the system into a late intermediate acting as a kinetic trap. Escape from the trap involves breaking these nonnative interactions which occurs in parallel with formation of native-like interactions between E2C and the DNA backbone.
Free Energy Correlations in E2C-DNA-Binding.
We use free energy correlations as a quantitative test of the residue-by-residue analysis of the two E2C-DNA kinetic routes. If two given E2C:DNA complexes (such as the native complex, a transient intermediate, or a transition state ensemble) have similar structures, we assume that the effects of mutation on the stability of the two complexes relative to the unbound reagents will be correlated (28, 29). We may also test for correlations with the effects of mutation on the fast and slow tryptophan phases that report on the interactions formed or broken upon formation of and exit from Ilate.
We first quantified the similarity between the final E2C:DNA complex and the transient complexes along the two parallel kinetic routes. There is a correlation between the effects of mutation on the stability of the final complex and TSE2-state (R 0.76, p-value 8·10-3, Fig. 3A and Table 2). This suggests that the E2C-DNA 2-state binding route is dominated by native-like interactions (28, 30), as we previously proposed (26). For the multistate route, there is no significant correlation between the stability of the final complex and the fast or slow tryptophan phases nor  (Fig. 3B and Table 2). Thus, measurable nonnative interactions take place in the first steps of the multistate route. The stabilities of the final complex and
  do show significant correlation (R 0.67, p-value 2.4·10-2, Fig. 3C and Table 2), suggesting that the E2C:DNA interactions at the last transition state ensemble of this route resemble those in the native complex. Interestingly, the effect of mutations on TSE2-state is not correlated with the effect on
  ,
,  , or the tryptophan phases (Fig. 3D and E and Table 2). This confirms that the two kinetic routes involve substantially different intermolecular interactions.
Fig. 3.

Free energy correlations in E2C-DNA complex formation. Each ΔΔG-value (in kcal/mol) describes the effect of a mutation on a given state along the E2C-DNA kinetic routes, taking the unbound reagents as a reference. The p-value describes the probability of observing the correlation by chance. (A) Final complex versus TSE2-state. (B) Final complex versus  . (C) Final complex vs.
 . (D) TSE2-state vs.
  . (E) TSE2-state vs.
  . (F)
. (F)  vs.
vs.  .
.
Table 2.
Free energy correlations in E2C-DNA complex formation
| R-value | P-value | |
| Comparison of the two routes with the final complex | ||
| ΔΔGeqversus TSE2-state | 0.76 | 0.008 |
ΔΔGeqversus
|
-0.15 | 0.55 |
| ΔΔGeqversus ln kWfast | 0.05 | 0.86 |
| ΔΔGeqversus ln kWslow | 0.09 | 0.73 |
ΔΔGeqversus
|
0.67 | 0.024 |
| Comparison between the two routes | ||
TSE2-stateversus
|
-0.38 | 0.15 |
| TSE2-stateversus ln kWfast | 0.09 | 0.74 |
| TSE2-stateversus ln kWslow | 0.01 | 0.99 |
TSE2-stateversus
|
0.29 | 0.29 |
| Early steps of the multistate route | ||
 versus ln kWfast versus ln kWfast
|
-0.16 | 0.53 |
 versus ln kWslow versus ln kWslow
|
0.07 | 0.78 |
| ln kWfastversus ln kWslow | -0.75 | 0.011 |
| Early versus late steps of the multistate route | ||
 versus versus
|
0.05 | 0.86 |
ln kWfastversus
|
0.19 | 0.51 |
ln kWslowversus
|
0.26 | 0.35 |
The p-value is the probability of observing the correlation by chance. Numbers in bold indicate correlations statistically significant at the 0.05 level.
The first steps of the E2C:DNA multistate route involve formation of nonnative interactions and lead to a kinetic trap. The lack of correlation between the effects of mutation on  and the two tryptophan phases (Table 2) suggests that nonnative interactions in
  and the kinetic trap are dissimilar. Remarkably, the rate constants for the two tryptophan phases respond in compensating ways to mutation (R -0.75, p-value 0.011, Fig. 2B and Table 2). Thus, the interactions that lead the E2C:DNA complex into the kinetic trap are, overall, similar to the interactions that need to be broken to exit from it. Finally, the effects of mutation on
  and the tryptophan phases are not correlated with the effects on
  (Fig. 3D and Table 2). This confirms that the E2C:DNA complex at
  resembles the final complex (Fig. 3F) rather than the species that precedes it.
Discussion
Specific protein-DNA-binding at equilibrium is often a deceptively simple, two-state process in which only the unbound reagents and the final complex are populated (4–8). However, the few kinetic mechanisms determined to date revealed a richer picture, with parallel routes and transient intermediates (4–8). In the absence of high-resolution kinetic work, structural studies suggested that multistate routes for protein-DNA-binding start with the formation of nonspecific interactions with the DNA backbone (1, 9–17), and that some dual-role residues may form transient nonnative interactions along the route (13–15, 17). E2C-DNA-binding is also two-state at equilibrium (21) but kinetically complex (4) (Figure 4A). Upon association the system partitions into two kinetic routes (4), whose rate constants differ only two-fold (Table S1), making both routes kinetically significant under the conditions of our measurements. Here, we study the intermolecular interactions present along the multistate route. Charged residues K297, K304, and K325 stabilize the first transition state of the multistate route, although through nonnative interactions that are not necessarily limited to the DNA backbone (13). After this first transition state, we find direct proof for nonnative interactions formed by eight dual-role E2C residues located in helix1 and the β2-β3 loop (Fig. 2), providing kinetic foundation to a hypothesis derived from static crystal structures (13–15, 17). These widespread nonnative interactions guide the E2C-DNA complex into a kinetic trap, delaying formation of the native complex (Fig. 2, Fig. 3, and Table 2). Neutral residues C298, Y301 and V324 form some of these nonnative interactions, indicating that the kinetic trap is not stabilized solely by electrostatic interactions with the DNA backbone and can not be pictured as a nonspecific complex. The native complex and the late intermediate form significantly different sets of intermolecular interactions (Table 2) and interconvert slowly, with a time constant in the order of tens of seconds. We speculate that Ilate may be a transient binding mode of E2C to its target sequence or a complex of E2C with a partially overlapping site. In this context, it is interesting to note that E2C (31) and other DNA-binding proteins (32) are able to bind specifically to distinct target sequences. We propose that the alternative E2C-DNA complex might have a functional role different from that of the native one, such as modulating the search for the target sequence (33) and/or the coalescence of other regulatory molecules through allosteric effects (34).
Fig. 4.

Schematic free energy landscape for DNA sequence recognition by E2C. (A) Illustration of free energy as a function of the similarity to the native complex (Qn, X-Axis) and to Ilate (Qt, Y-Axis), at conditions where both the native complex and the unbound reagents are populated. Low free energy regions are in Blue, high free energy regions in Red. The free energy minimum for the unbound reagents (U) is at the lower left corner of the plot, the native complex (N) is at the lower right corner and Ilate at the upper left corner. The two-state kinetic route takes place along the x-axis with the formation of native-like contacts. The multistate kinetic route takes place first along the y-axis with the formation of nonnative contacts in the encounter complex and Ilate, and then along the diagonal with the simultaneous disruption of nonnative contacts and formation of native-like ones to reach the final complex. (B) Double funnel projection of the free energy landscape (36). The width of the plot represents the conformational entropy of the E2C:DNA system, and its depth represents the energy of interaction between the two molecules. The top of the picture corresponds to non-interacting E2C and DNA, and the two funnels group native-like and nonnative protein-DNA interactions. The two-state kinetic route takes place in the minimally frustrated native funnel (Right), centered on the free energy minimum for the native complex. The multistate kinetic route maps to a frustrated nonnative funnel (Left) that is centered on Ilate. Conversion of this intermediate into the global minimum requires the E2C:DNA complex to switch to the native funnel over  . Dissociation of the native complex may take place over TSE2-state or
  .
.
We can use energy landscape theory to compare the two E2C-DNA-binding routes and describe the reaction globally (Fig. 4). The E2C-DNA-binding energy landscape has two very different facets that involve substantially different intermolecular interactions (Fig. 4B). The first one can be pictured as a smooth funnel where native-like interactions predominate and lead to a two-state transition (26). The second can be pictured as a rough funnel in which frustration leads to populated intermediates stabilized by nonnative interactions, in strong contrast with the expectations from structural studies and with a smooth funnel. Our mutagenesis of E2C DNA-binding residues shows that the roughness on the landscape arises, at least partially, from a nonnative protein-DNA interface. Additionally, other factors may increase the degree of frustration in the landscape in addition to side-chain-DNA contacts, such as the requirement for DNA bending (5, 7, 19, 21) or binding after sliding along nonspecific DNA (3). The free E2C domain is stable (27) yet highly dynamic, with less than half of backbone amide protons showing significant protection from exchange with the solvent (24), while most backbone amide protons are shielded from exchange in DNA-bound E2C (24). Moreover, the conformational diversity of the DNA-binding helix is restricted upon binding (35) and internal conformational rearrangements in the homodimeric β-barrel core take place (24). We propose that these conformational rearrangements involve internal interactions of E2C and contribute to the large free energy barrier for conversion of the nonnative Ilate into the final complex and its major enthalpic component (4). In turn, our results provide a functional explanation for the unusual dynamic properties of E2C. Protein folding landscapes are minimally frustrated (28), making it intriguing that the first protein-DNA-binding landscape studied in detail shows such a high degree of frustration. Future work on other protein-DNA complexes is needed to determine how common this behavior is. At this point, we speculate that the physical basis for frustration is the highly degenerate nature of protein-DNA interactions in a hydrated, fluid interface. The fact that the identified roughness is compatible with the evolutionary constrains for the E2C-DNA interaction suggests that it may play a functional role (34).
Materials and Methods
The association and dissociation kinetics of the HPV16-E2C wild type and mutant complexes were measured, analyzed with the proprietary Applied Photophysics software or ProFit (Quantumsoft), and assigned to the two binding routes as described (26). The structure representations were prepared with Pymol [W.L. DeLano, The PyMOL Molecular Graphics System (2002) DeLano Scientific].
Supplementary Material
Acknowledgments.
We acknowledge funding from Welcome Trust (Grant GR077355AYA); Agencia Nacional de Promoción Científica y Tecnológica (PICT 2000 01-08959); Consejo Nacional de Investigaciones Científicas y Técnicas (doctoral fellowship to D.U.F. and M.D.; G.d.P.G. and D.U.F. are CONICET career investigators); and Agencia Española de Cooperación Internacional (postdoctoral fellowship to I.E.S.).
Footnotes
The authors declare no conflict of interest.
This article is a PNAS Direct Submission.
This article contains supporting information online at www.pnas.org/cgi/content/full/0911734107/DCSupplemental.
References
- 1.Record MT, Jr, Ha JH, Fisher MA. Analysis of equilibrium and kinetic measurements to determine thermodynamic origins of stability and specificity and mechanism of formation of site-specific complexes between proteins and helical DNA. Methods Enzymol. 1991;208:291–343. doi: 10.1016/0076-6879(91)08018-d. [DOI] [PubMed] [Google Scholar]
- 2.Elf J, Li GW, Xie XS. Probing transcription factor dynamics at the single-molecule level in a living cell. Science. 2007;316:1191–1194. doi: 10.1126/science.1141967. [DOI] [PMC free article] [PubMed] [Google Scholar]
- 3.von Hippel PH, Berg OG. Facilitated target location in biological systems. J Biol Chem. 1989;264:675–678. [PubMed] [Google Scholar]
- 4.Ferreiro DU, Prat Gay Gd. A protein-DNA binding mechanism proceeds through multi-state or two-state parallel pathways. J Mol Biol. 2003;331:89–99. doi: 10.1016/s0022-2836(03)00720-4. [DOI] [PubMed] [Google Scholar]
- 5.Parkhurst KM, Richards RM, Brenowitz M, Parkhurst LJ. Intermediate species possessing bent DNA are present along the pathway to formation of a final TBP-TATA complex. J Mol Biol. 1999;289:1327–1341. doi: 10.1006/jmbi.1999.2835. [DOI] [PubMed] [Google Scholar]
- 6.Hooley E, Fairweather V, Clarke AR, Gaston K, Brady RL. The recognition of local DNA conformation by the human papillomavirus type 6 E2 protein. Nucleic Acids Res. 2006;34:3897–3908. doi: 10.1093/nar/gkl466. [DOI] [PMC free article] [PubMed] [Google Scholar]
- 7.Sugimura S, Crothers DM. Stepwise binding and bending of DNA by Escherichia coli integration host factor. Proc Natl Acad Sci USA. 2006;103:18510–18514. doi: 10.1073/pnas.0608337103. [DOI] [PMC free article] [PubMed] [Google Scholar]
- 8.Oddo C, Freire E, Frappier L, Prat Gay Gd. Mechanism of DNA recognition at a viral replication origin. J Biol Chem. 2006;281:26893–26903. doi: 10.1074/jbc.M602083200. [DOI] [PubMed] [Google Scholar]
- 9.Takeda Y, Ross PD, Mudd CP. Thermodynamics of Cro protein-DNA interactions. Proc Natl Acad Sci USA. 1992;89:8180–8184. doi: 10.1073/pnas.89.17.8180. [DOI] [PMC free article] [PubMed] [Google Scholar]
- 10.Luisi BF, et al. Crystallographic analysis of the interaction of the glucocorticoid receptor with DNA. Nature. 1991;352:497–505. doi: 10.1038/352497a0. [DOI] [PubMed] [Google Scholar]
- 11.Albright RA, Mossing MC, Matthews BW. Crystal structure of an engineered Cro monomer bound nonspecifically to DNA: possible implications for nonspecific binding by the wild-type protein. Protein Sci. 1998;7:1485–1494. doi: 10.1002/pro.5560070701. [DOI] [PMC free article] [PubMed] [Google Scholar]
- 12.Viadiu H, Aggarwal AK. Structure of BamHI bound to nonspecific DNA: A model for DNA sliding. Mol Cell. 2000;5:889–895. doi: 10.1016/s1097-2765(00)80329-9. [DOI] [PubMed] [Google Scholar]
- 13.Aishima J, Wolberger C. Insights into nonspecific binding of homeodomains from a structure of MATalpha2 bound to DNA. Proteins. 2003;51:544–551. doi: 10.1002/prot.10375. [DOI] [PubMed] [Google Scholar]
- 14.Kalodimos CG, et al. Structure and flexibility adaptation in nonspecific and specific protein-DNA complexes. Science. 2004;305:386–389. doi: 10.1126/science.1097064. [DOI] [PubMed] [Google Scholar]
- 15.Horton JR, Liebert K, Hattman S, Jeltsch A, Cheng X. Transition from nonspecific to specific DNA interactions along the substrate-recognition pathway of dam methyltransferase. Cell. 2005;121:349–361. doi: 10.1016/j.cell.2005.02.021. [DOI] [PMC free article] [PubMed] [Google Scholar]
- 16.Iwahara J, Zweckstetter M, Clore GM. NMR structural and kinetic characterization of a homeodomain diffusing and hopping on nonspecific DNA. Proc Natl Acad Sci USA. 2006;103:15062–15067. doi: 10.1073/pnas.0605868103. [DOI] [PMC free article] [PubMed] [Google Scholar]
- 17.Townson SA, Samuelson JC, Bao Y, Xu SY, Aggarwal AK. BstYI bound to noncognate DNA reveals a “hemispecific” complex: Implications for DNA scanning. Structure. 2007;15:449–459. doi: 10.1016/j.str.2007.03.002. [DOI] [PubMed] [Google Scholar]
- 18.Givaty O, Levy Y. Protein sliding along DNA: Dynamics and structural characterization. J Mol Biol. 2009;385:1087–1097. doi: 10.1016/j.jmb.2008.11.016. [DOI] [PubMed] [Google Scholar]
- 19.Hegde RS. The papillomavirus E2 proteins: Structure, function, and biology. Annu Rev Biophys Biomol Struct. 2002;31:343–360. doi: 10.1146/annurev.biophys.31.100901.142129. [DOI] [PubMed] [Google Scholar]
- 20.Sanchez IE, Dellarole M, Gaston K, de Prat Gay G. Comprehensive comparison of the interaction of the E2 master regulator with its cognate target DNA sites in 73 human papillomavirus types by sequence statistics. Nucleic Acids Res. 2008;36:756–769. doi: 10.1093/nar/gkm1104. [DOI] [PMC free article] [PubMed] [Google Scholar]
- 21.Prat Gay Gd, Gaston K, Cicero DO. The papillomavirus E2 DNA binding domain. Front Biosci. 2008;13:6006–6021. doi: 10.2741/3132. [DOI] [PubMed] [Google Scholar]
- 22.Nadra AD, et al. Solution structure of the HPV-16 E2 DNA binding domain, a transcriptional regulator with a dimeric beta-barrel fold. J Biomol NMR. 2004;30:211–214. doi: 10.1023/b:jnmr.0000048942.96866.76. [DOI] [PubMed] [Google Scholar]
- 23.Cicero DO, et al. Structural and thermodynamic basis for the enhanced transcriptional control by the human papillomavirus strain-16 E2 protein. Biochemistry. 2006;45:6551–6560. doi: 10.1021/bi060123h. [DOI] [PubMed] [Google Scholar]
- 24.Eliseo T, et al. Indirect DNAreadout on the protein side: Coupling between histidine protonation, global structural cooperativity, dynamics, and DNA binding of the human papillomavirus type 16 E2C domain. J Mol Biol. 2009;388:327–344. doi: 10.1016/j.jmb.2009.03.013. [DOI] [PubMed] [Google Scholar]
- 25.Ferreiro DU, Dellarole M, Nadra AD, Prat Gay Gd. Free energy contributions to direct readout of a DNA sequence. J Biol Chem. 2005;280:32480–32484. doi: 10.1074/jbc.M505706200. [DOI] [PubMed] [Google Scholar]
- 26.Ferreiro DU, Sanchez IE, de Prat Gay G. Transition state for protein-DNA recognition. Proc Natl Acad Sci USA. 2008;105:10797–10802. doi: 10.1073/pnas.0802383105. [DOI] [PMC free article] [PubMed] [Google Scholar]
- 27.Mok YK, Prat Gay Gd, Butler PJ, Bycroft M. Equilibrium dissociation and unfolding of the dimeric human papillomavirus strain-16 E2 DNA-binding domain. Protein Sci. 1996;5:310–319. doi: 10.1002/pro.5560050215. [DOI] [PMC free article] [PubMed] [Google Scholar]
- 28.Oliveberg M, Wolynes PG. The experimental survey of protein-folding energy landscapes. Q Rev Biophys. 2005;38:245–288. doi: 10.1017/S0033583506004185. [DOI] [PubMed] [Google Scholar]
- 29.Gianni S, et al. A PDZ domain recapitulates a unifying mechanism for protein folding. Proc Natl Acad Sci USA. 2007;104:128–133. doi: 10.1073/pnas.0602770104. [DOI] [PMC free article] [PubMed] [Google Scholar]
- 30.Wang J, Verkhivker GM. Energy landscape theory, funnels, specificity, and optimal criterion of biomolecular binding. Phys Rev Lett. 2003;90:188101. doi: 10.1103/PhysRevLett.90.188101. [DOI] [PubMed] [Google Scholar]
- 31.Newhouse CD, Silverstein SJ. Orientation of a novel DNA binding site affects human papillomavirus-mediated transcription and replication. J Virol. 2001;75:1722–1735. doi: 10.1128/JVI.75.4.1722-1735.2001. [DOI] [PMC free article] [PubMed] [Google Scholar]
- 32.Badis G, et al. Diversity and complexity in DNA recognition by transcription factors. Science. 2009;324:1720–1723. doi: 10.1126/science.1162327. [DOI] [PMC free article] [PubMed] [Google Scholar]
- 33.Bénichou O, Kafri Y, Sheinman M, Voituirez R. Searching fast for a target on DNA without falling to traps. Phys Rev Let. 2009;103:138102. doi: 10.1103/PhysRevLett.103.138102. [DOI] [PubMed] [Google Scholar]
- 34.Roy S, Semsey S, Liu M, Gussin GN, Adhya S. GalR represses galP1 by inhibiting the rate-determining open complex formation through RNA polymerase contact: a GalR negative control mutant. J Mol Biol. 2004;344:609–618. doi: 10.1016/j.jmb.2004.09.070. [DOI] [PubMed] [Google Scholar]
- 35.Wetzler DE, et al. A strained DNA binding helix is conserved for site recognition, folding nucleation, and conformational modulation. Biopolymers. 2009;91:432–443. doi: 10.1002/bip.21146. [DOI] [PubMed] [Google Scholar]
- 36.Clark PL. Protein folding in the cell: reshaping the folding funnel. Trends Biochem Sci. 2004;29:527–534. doi: 10.1016/j.tibs.2004.08.008. [DOI] [PubMed] [Google Scholar]
Associated Data
This section collects any data citations, data availability statements, or supplementary materials included in this article.