

Abstract
Crop production is the single largest cause of human alteration of the global nitrogen cycle. We present a comprehensive assessment of global nitrogen flows in cropland for the year 2000 with a spatial resolution of 5 arc-minutes. We calculated a total nitrogen input (IN) of 136.60 trillion grams (Tg) of N per year, of which almost half is contributed by mineral nitrogen fertilizers, and a total nitrogen output (OUT) of 148.14 Tg of N per year, of which 55% is uptake by harvested crops and crop residues. We present high-resolution maps quantifying the spatial distribution of nitrogen IN and OUT flows, soil nitrogen balance, and surface nitrogen balance. The high-resolution data are aggregated at the national level on a per capita basis to assess nitrogen stress levels. The results show that almost 80% of African countries are confronted with nitrogen scarcity or nitrogen stress problems, which, along with poverty, cause food insecurity and malnutrition. The assessment also shows a global average nitrogen recovery rate of 59%, indicating that nearly two-fifths of nitrogen inputs are lost in ecosystems. More effective management of nitrogen is essential to reduce the deleterious environmental consequences.
Keywords: global nitrogen cycle, malnutrition, nitrogen scarcity, soil fertility
Human-induced nitrogen flows are a major component of the earth's biogeochemical cycles and have become a topic of increasing research attention (1–7). Compared with the preindustrial condition, nitrogen loading to land surface has doubled as a result of anthropogenic activities (3, 4, 8). Human-induced changes in global nitrogen flows significantly affect the sustainability of food production and the health of the environment (9). The doubling of world food production in the past 4 decades could be achieved only with an almost sevenfold increase of nitrogen fertilization (10, 11). The relatively low current crop yield in Africa is, to a large extent, a result of low fertilizer application (5, 12, 13). Excessive nitrogenous fertilizer use causes eutrophication, loss of diversity, dominance by weedy species, air pollution, water pollution, soil acidification, and emission of the greenhouse- and ozone-depleting gas nitrous oxide (11, 14–17); therefore, poor management in nitrogen application can seriously affect environment health.
Crop production is by far the single largest cause of human alteration of the global nitrogen cycle (4), thus raising global sustainability concerns (4, 5, 18). Previous research on global nitrogen flows in cropland has not made full use of the spatially explicit databases available (19). These studies generally treated a country or region as a whole (4, 5, 9) and rarely paid attention to the spatial variations within a country or region. Recent advances in information technology have made it possible to estimate nitrogen flows with a high spatial resolution. Lesschen et al. (19) made an attempt to quantify nitrogen flows with a spatially explicit approach at the national level for Burkina Faso. Here, we conduct an assessment of global nitrogen flows in cropland with a spatial resolution of 5 arc-minutes (about 9 × 9 km2 nearby the equator) for the year 2000. The results are aggregated to the national level to analyze nitrogen scarcity across countries throughout the world.
Results
Nitrogen Inputs.
Our calculations show that the total nitrogen input (IN) was ≈136.60 trillion grams (Tg) of N per year in the year 2000 (Table 1). Nitrogen input from mineral nitrogen fertilizer (INfer) was the single largest nitrogen input in cropland, accounting for almost half of the global IN. Nitrogen input from biofixation (INfix) was the second largest input and contributed 16%. Nitrogen input from manure (INman), recycled crop residues (INres), and atmospheric deposition (INdep) provided similar amounts of nitrogen, with each contributing 8–13% of the total input. In contrast, nitrogen in sedimentation (INsed) was relatively marginal.
Table 1.
Continental breakdown of global nitrogen flows
| Nitrogen flows | World | Asia | Europe | Africa | North America | South America | Oceania |
| INfer | 67.84 | 41.08 | 8.38 | 2.16 | 12.17 | 3.02 | 1.03 |
| INman | 17.34 | 9.47 | 1.66 | 1.29 | 2.31 | 2.40 | 0.21 |
| INdep | 14.47 | 9.44 | 2.02 | 0.93 | 1.36 | 0.68 | 0.04 |
| INfix | 22.27 | 9.66 | 1.67 | 2.93 | 4.38 | 3.31 | 0.32 |
| INsed | 3.31 | 2.07 | 0.32 | 0.29 | 0.46 | 0.14 | 0.03 |
| INres | 11.37 | 3.03 | 1.48 | 1.03 | 4.75 | 0.88 | 0.19 |
| OUTcrop | 51.65 | 22.62 | 8.30 | 3.02 | 11.74 | 5.18 | 0.79 |
| OUTres | 29.22 | 14.27 | 3.69 | 2.04 | 6.52 | 2.39 | 0.30 |
| OUTlea | 22.99 | 14.61 | 2.68 | 1.01 | 2.64 | 1.71 | 0.34 |
| OUTgas | 20.28 | 14.12 | 1.66 | 1.25 | 1.89 | 1.21 | 0.15 |
| OUTero | 24.00 | 17.06 | 1.30 | 1.69 | 2.71 | 1.21 | 0.03 |
| IN | 136.60 | 74.76 | 15.52 | 8.63 | 25.43 | 10.44 | 1.83 |
| OUT | 148.14 | 82.69 | 17.63 | 9.01 | 25.49 | 11.70 | 1.61 |
Unit, Tg yr-1.
A continental breakdown of the global nitrogen inputs reveals considerable spatial heterogeneity across regions of the world (Table 1). Mineral fertilizers contributed over 55% of the IN in Oceania. In Europe, Asia, and North America, cropland received 48–55% of the IN from mineral fertilizers. In contrast, mineral fertilizers only contributed 25–29% of the IN in Africa and South America, a reflection of the low purchase of mineral fertilizers in many countries on both continents. Biofixation was the single largest nitrogen input in Africa and South America, and it accounted for about one-third of the IN on each continent. There are two major explanations for the important role of biofixation on both continents: extensive planting of soybeans and other leguminous crops and relatively low mineral fertilizer application. In other regions, biofixation accounted for no more than 18% of the IN. The relatively low percentage is partly attributable to the high application rates of mineral fertilizers. Manure was an important nitrogen source in South America, and it accounted for over 20% of the IN. On other continents, however, manure contributed no more than 15% of the IN.
There were significant spatial variations in the IN rates (Fig. 1A) and the nitrogen flows of all inputs (Fig. S1) in cropland among countries and even within a country. INfer in the Northern Hemisphere was generally higher than that in the Southern Hemisphere. INfer over 100 kg·ha−1·yr−1 mainly occurred in China, Western Europe, the western coastal areas and the Midwest in the United States, Pakistan, Saudi Arabia, Iran, Uzbekistan, and Egypt, whereas INfer below 10 kg·ha−1·yr−1 was common in many African countries and the remote areas of Russia, where climate conditions are not favorable for crop production. INman had a more even distribution between the Northern and Southern Hemispheres. All the continents had large regions with INman over 40 kg·ha−1·yr−1. High INdep was present mainly in the regions in which agricultural cropland was in close proximity to industrialized and densely populated areas, such as India, Western Europe, Eastern China, and the eastern United States. High INfix occurred in North America, South America, Southeast Asia, and Sub-Saharan Africa, where soybean and other leguminous crops are grown more often than in other regions. INsed was marginal compared with other inputs. Not surprisingly, a high nitrogen rate of INres was concentrated in the main crop production regions, such as Southern China, Europe, and the Midwest of the United States.
Fig. 1.

Maps of global IN (A), OUT (B), BALsoil (C), and BALsur (D).
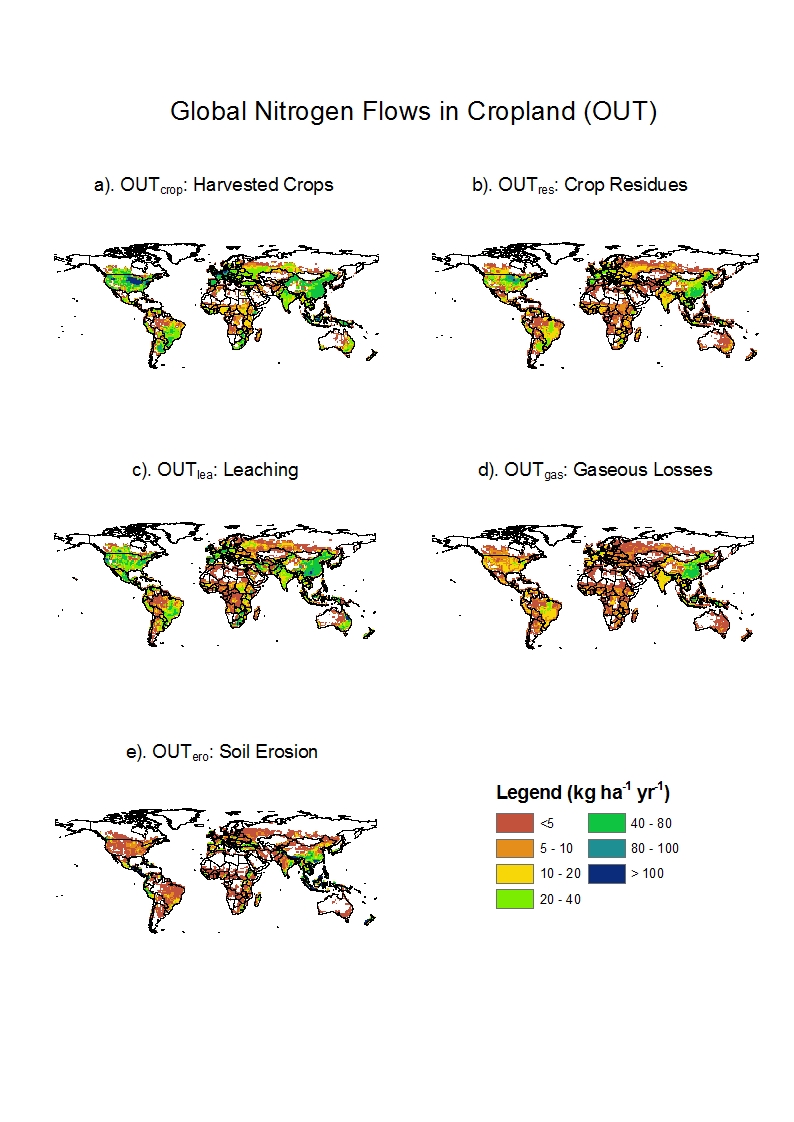
Nitrogen Outputs.
Our calculations show that the total nitrogen output (OUT) was ≈148.14 Tg of N per year in the year 2000 (Table 1). About 55% of the nitrogen outputs were uptake by harvested crops (35%) and crop residues (20%). The remainder was lost in leaching (16%), soil erosion (15%), and gaseous emission (14%). In North America, harvested crops and crop residues combined accounted for 72% of the OUT. In South America, Oceania, and Europe, they accounted for around two-thirds (65% for South America and 68% for Oceania and Europe). The shares of nitrogen in harvested crops and crop residues to the OUT were relatively low in Africa (56%) and Asia (45%).
OUT varied significantly among countries and even within a country (Fig. 1B). OUT was mainly affected by crop yields. The highest OUT per unit of cropland was found in Western Europe, the Midwest of the United States, Eastern and Southern China, Southeast Asian countries, New Zealand, and large areas in Argentina and Brazil. All these regions are major food production areas with high crop yields. In contrast, many African countries, West Asia, Eastern Europe, and several countries in South America generally have low crop yields as well as low OUT.
The rates of different nitrogen output flows also varied significantly across regions (Fig. S2). The highest nitrogen output in harvested crops (OUTcrop) and in crop residues (OUTres) occurred in Western Europe, Southeast Asia, and the Midwest of the United States. This is not surprising because these regions generally had very high crop yields. In contrast, many African countries had both OUTcrop and OUTres below 20 kg·ha−1·yr−1. Nitrogen output to leaching (OUTlea) occurred in the regions with both high precipitation and high fertilizer inputs, such as Southern China and several countries in Western Europe. Nitrogen output to gaseous losses (OUTgas) had high values in Southeast Asia, Southern China, and Western Europe. High values of nitrogen output to soil erosion (OUTero) occurred in regions of heavy rainfall (e.g., Southeast Asia, Latin America), areas of steep slopes and high-relief topography (e.g., the Andes, Tibetan Plateau), and where there has been extensive reclamation of land for agricultural and urban use (e.g., the northern shores of the Mediterranean).
Soil Nitrogen Balance.
The calculations show a negative soil nitrogen balance (BALsoil) of 11.53 Tg of N per year in cropland in the year 2000 (Table 1). This is equivalent to around 11 kg of N ha·yr−1. Oceania had soil nitrogen accumulation equivalent to around 10 kg of N ha· yr−1. North America had more or less balanced nitrogen in soil. Nitrogen depletion of 2.4 kg of N ha·yr−1 was obtained for Africa, whereas in all other countries, nitrogen depletion was as high as 14 kg of N ha·yr−1.
Soil nitrogen depletion or accumulation varied significantly across regions (Fig. 1C). Soil depletion mainly occurred in regions with high extensive rice cropping production (e.g., Southeast Asia), with low mineral fertilizer application rates (e.g., several countries in Sub-Saharan Africa, Eastern Europe, and the former Union of Soviet Socialist Republics) (Fig. 1C). The highest nitrogen accumulation occurred in regions with high mineral fertilizer application (e.g., India, the eastern coastal area of Australia, Northern China, South Africa).
Surface Nitrogen Balance and Nitrogen Recovery Rate.
Our calculations show a positive surface nitrogen balance (BALsur) of 55.74 Tg of N per year in cropland in the year 2000. This was equivalent to 53 kg of N ha·yr−1. A high positive BALsur mainly occurred in regions with high IN, particularly in the Midwest of the United States (Fig. 1D). The surplus of BALsur was the largest in the countries with multiple cropping systems (e.g., United States, China, India) and in the countries with highly intensive agricultural production (e.g., The Netherlands, Belgium, Denmark).
The nitrogen recovery rate (NRR), which is defined as the ratio of nitrogen output uptake by crops (OUTup = OUTcrop + OUTres) to IN, was 59% on the global average. Regions with the highest NRR included Europe, South America, and North America, where more than 70% of nitrogen was uptake by crops. The high rates in these continents were largely attributable to the high crop yields (e.g., in Europe) or extensive area of leguminous crops, particularly soybeans. North America and South America combined accounted for almost three-fourths of the world's harvested area of soybeans (20). Leguminous crops generally incorporated more of the available (and largely self-supplied) nitrogen, and the NRR of these crops could reach 90% (21). The lowest NRR was in Asia, where only 49% of nitrogen was uptake by crops. The low rate was likely a result of the extensive lowland rice area in this region. Asia accounted for almost 90% of the world's harvested area of rice (20). Rice generally has a low NRR because of difficulties in controlling nitrogen losses by ammonia volatilization and denitrification (22). In Asian rice fields, typical NRR values were between 30% and 35%, ranging from as low as 20% and rarely exceeding 40% (23).
Discussion
Comparison with Other Studies.
Our IN of 136.60 Tg of N per year is slightly lower than the low estimate by Smil (4) (146 Tg of N per year) and substantially lower than his mean and high estimates (169 and 186 Tg of N per year, respectively). Smil (4) calculated the nitrogen flows for all arable and permanent cropland, including forage cropland. For comparison, we adjusted that investigator's results by deducting the nitrogen in forage cropland (values after adjustment are provided in Table S1). After adjustment, the mean estimate of IN is 146 Tg of N per year, which is very close to our estimate. Our result of IN is lower than the estimate of Sheldrick et al. (5) partly because of the exclusion of forage crops in our estimation. We did not adjust the results of those investigators because their estimation method of nitrogen input in forage crops is not explicit. Our OUT of 148.14 Tg of N per year was also close to the mean estimate of Smil (4) after adjustment (Table S1). The global NRR was estimated to be 59%. This estimate is close to the upper limit of the estimate (i.e., 58%) by Smil (4) but lower than the estimate of 64% reported by Sheldrick et al. (5) and higher than that of 43% reported by Bouwman et al. (24). The overestimation of OUTcrop and OUTres by Sheldrick et al. (5) is one reason for their higher NRR. Bouwman et al. (24) estimated a low NRR because they did not include leguminous crops, which generally have a higher NRR than other crops. Each component of IN and OUT estimated in this study is compared with the findings from other studies [e.g., Smil (4), Sheldrick et al. (5)], and the comparison is described in detail in SI Text.
BALsoil.
Variation in BALsoil exists not only among countries but within a country. For example, China, as a whole, had a slight soil nitrogen depletion (−2.19 kg·ha·yr−1, equivalent to 1% of China's IN), but there was a distinct difference between Northern China and Southern China. Soil nitrogen accumulation dominated in the north, whereas nitrogen depletion dominated in the south. Higher precipitation in Southern China generally leads to higher nitrogen leaching rates. In addition, rice is widely planted in Southern China. Measurement data suggest that NH3 volatilization rates in lowland rice systems are often higher than those in upland crop systems (25). Although inundation in wetland rice may lead to lower emissions of N2O (26), the amount of NH3 emissions is generally much higher than the total amount of N2O and NO, leading to general high gaseous losses in rice fields. Higher leaching and gaseous losses partially explain the nitrogen depletion in Southern China. Another typical example is the United States, where nitrogen accumulation was found (10.56 kg·ha−1·yr−1, equivalent to 5% of the IN in the United States). Although nitrogen accumulation was dominant in the country, nitrogen depletion occurred in several grid cells in the Midwest (mainly in Iowa, Minnesota, Illinois, Indiana, and Ohio) and Idaho (Fig. 1C). The dominant ecosystem in the Midwest is the corn–soybean agricultural system, which accounts for 74% of cropland in the region. High crop yields of corn and soybean lead to high OUTcrop (e.g., >100 kg·ha−1·yr−1; Fig. S2A) and OUTres (e.g., >80 kg·ha−1·yr−1; Fig. S2B). As a result, soil is depleted of nitrogen. Our results of nitrogen depletion in high-yielding regions are consistent with the findings of Gentry et al. (27), who estimated a negative nitrogen balance in Illinois in 2002.
Many authors argue that soil nitrogen depletion is a major cause for low crop productivity and malnutrition problems in many countries in Sub-Saharan Africa (12, 28, 29). Although our results did show several African countries with both high nitrogen depletion and a high prevalence of malnourishment (e.g., Burundi, Ethiopia, Liberia, Sierra Leone, Rwanda), it was also found that several seriously malnourished countries had nitrogen accumulation (e.g., Eritrea, Comoros) (Fig. 2). A high prevalence of malnourishment also existed in countries with more or less balanced nitrogen budgets (e.g., Angola, Central Africa). There are no clear relations between soil depletion or accumulation and malnourishment. This is because depletion or accumulation depends on the nitrogen balance between inputs and outputs. The balance may be positive in low-input regions, where nitrogen outputs are extremely small, and it may be negative in high-input regions, where crop yields and nitrogen losses are high. For example, France had large areas with nitrogen depletion (Fig. 1C), and it had a negative nitrogen balance at the national level. The nitrogen depletion was partially a result of high crop yields (e.g., 7,240 kg·ha−1·yr−1 in 2000 for cereals) (19). Nitrogen depletion also occurred in the southern parts of South America (e.g., Argentina), the Amazon region, Central America, and some parts of the Midwest of the United States, partially attributable to the high crop yields. Soil nitrogen depletion occurs regardless of how high the nitrogen input once crop nitrogen uptake, along with other nitrogen losses, exceeds the IN. Sheldrick et al. (5) also reported negative BALsoil in regions with high fertilizer application rates (e.g., Europe, North America). Soil nitrogen depletion only reflects the BALsoil situation in a certain period; therefore, it may not necessarily indicate the level of crop productivity. In summary, nitrogen depletion is one of many factors affecting crop production; however, malnutrition seems not to be exclusively the result of nitrogen depletion. Soil nitrogen depletion cannot be viewed as a key explanatory factor for malnutrition.
Fig. 2.

BALsoil and prevalence of malnourishment in Africa in 2000. The prevalence of undernourishment in the total population (%) is obtained from the FAO (20). Data for the period 2000–2002 are used. BALsoil is estimated in this study.
Nitrogen Scarcity on Global and National Scales.
On a global average, the per capita (cap) nitrogen input was about 24 kg·cap−1·yr−1. According to our definition (Table 2), there was no nitrogen scarcity for the world as a whole. The nitrogen scarcity occurred mostly in African countries (Fig. 3). On a continental average, Africa had a per capita nitrogen input of about 11 kg·cap−1·yr−1, which was slightly higher than the nitrogen scarcity threshold (9 kg·cap−1·yr−1) but lower than the nitrogen stress threshold (15 kg·cap−1·yr−1). The disproportional distribution between population and nitrogen input worsens the situation. Among 50 African countries studied here, 29 countries had nitrogen scarcity, whereas 10 other countries had nitrogen stress (Fig. 3).
Table 2.
Definition of nitrogen stress levels
| IN in cropland (kg·cap−1·yr−1) | Nitrogen stress level |
| >30 | Nitrogen sufficiency |
| 15–30 | No nitrogen stress |
| 9–15 | Nitrogen stress |
| <9 | Nitrogen scarcity |
Fig. 3.

Nitrogen stress levels in cropland on national average.
Africa's malnutrition problem is severe. Particularly in Sub-Saharan Africa, the average prevalence of undernourishment in total population was over 30% during 2001–2003 (30). Because of the poor infrastructure in rural areas of Africa, the farm-gate price of fertilizer was often two to six times that of the rest of the world (29). The exorbitant cost to farmers was prohibitive for wide use of fertilizers. Any benefits from fertilizer application were often outweighed by the investment cost; thus, farmers were discouraged from using more fertilizer. Even worse, the lack of regional transport and storage facilities decreased the local market price of the crop products despite higher crop production yielded from higher fertilizer application (29). From 1990–2000, nitrogen fertilizer application declined from 3.4 kg·cap−1·yr−1 to 3.1 kg·cap−1·yr−1 in Africa (20). Partly because of the low mineral fertilizer application, the per capita cereal production declined from 149 kg·cap−1·yr−1 to 141·kg cap−1·yr−1. Poverty limited Africa's ability to import sufficient food from international markets. As a result, Africa did not make much progress in mitigating malnutrition over the past decades. Some African regions have shown an increasing prevalence of undernourishment (e.g., in Central Africa, from 36% during 1990–1992 to 56% during 2001–2003) (30).
Asia is another region with serious malnutrition problems, which is partially attributable to the considerable population size. In particular, the malnourished population in India accounted for 26% of the world's total malnutrition population, whereas it accounted for 17% in China. Our results show no nitrogen stress in most Asian countries (Fig. 3). Both India and China had no nitrogen stress. Most likely, malnutrition problems were not related to insufficient production of digestible nitrogen, but poverty prevented those with limited purchasing power from buying food from the market (29) in both countries. Although the absolute number of malnourished people was high, the prevalence of undernourishment (20% in India and 12% in China during 2001–2003) was lower than in many African countries. India and China had made great progress in fighting malnutrition. The prevalence of undernourishment was much lower than during the period 1990–1992 (25% in India and 16% in China). The improvement was partly attributable to the higher application of mineral nitrogen fertilizer (from 8.9 kg·cap−1·yr−1 in 1990 to 10.7·kg cap−1·yr−1 in 2000 in India and from 16.8 kg·cap−1·yr−1 in 1990 to 17.3 kg·cap−1·yr−1 in 2000 in China).
Big food exporters, such as the United States, Canada, Australia, Argentina, and France (31), had nitrogen sufficiency. The high per capita nitrogen input partly contributed to the exports of agricultural products in these countries. Japan had nitrogen scarcity, with an IN even less than 5 kg·cap−1·yr−1, but the malnutrition percentage was very low there. Japan imported a considerable amount of food from international markets. It lacks the arable land to feed its own population. Importing food is equivalent to importing nitrogen from other countries for the purpose of domestic consumption of digestible nitrogen. Nitrogen obtained from food trade can be termed “virtual nitrogen.” This term is very similar to the term “virtual water,” which describes a situation in which water-scarce countries attempt to mitigate water scarcity problems by importing food through the international market (32–34). It is useful to study to what extent the domestic nitrogen scarcity in food-importing countries was mitigated by virtual nitrogen. Grote et al. (9) reported the nitrogen-phosphorous-potassium (NPK) flows in net trade in different countries and regions in 1997. As a typical example, Japan relied heavily on food and nutrient imports to meet its domestic caloric NPK needs. About 88% of its needs were obtained from imported commodities (9). Africa imported 26% of the total NPK consumed (9). Assuming that this percentage applies to nitrogen imports, we calculated a total nitrogen consumption of 13.86 kg·cap−1·yr−1 in Africa, which is obviously below the nitrogen stress threshold (Table 2).
Nitrogen Losses and Consequences for Ecosystems.
The global average NRR of 59% suggests that over two-fifths of the nitrogen input was lost into ecosystems in different ways. Nitrogen losses put pressure on the surrounding environment. In particular, under humid and temperate climates, such as in many Western European countries, the eastern United States, and Southern China, soils in cropland remain wet or moist for most of the year. These soils, together with high fertilizer application, can result in a high level of nitrate leaching. For example, our results show that the highest OUTlea occurred in Western Europe (Fig. S2C), where a large amount of mineral fertilizer was applied in temperate agroecological zones. Nitrate leaching leads to eutrophication in lakes, reservoirs, estuaries, and coastal seas; serious groundwater contamination; and a higher NO3-nitrogen concentration in drinking water (24). Delivery of nitrate from rivers to oceans also results in harmful effects on coastal systems, with large-scale implications for biodiversity, water quality, fisheries, and recreation (35). Good soil and fertilizer management practices can reduce nitrate leaching to a certain extent (22); however, in tile-drained systems, nitrate losses still remain high even with good management (36). The increasing pollution by nitrogen will cause significant environmental damage (7).
How can environmental consequences be minimized without compromising food production? One solution is to increase the NRR. Smil (4) reviewed different solutions for improving the NRR and listed a number of direct measures of universal applicability (e.g., soil testing, choice of appropriate fertilizing compounds, maintenance of proper nutrient ratios, attention to timing and placement of fertilizers) and indirect approaches that can either reduce the need for synthetic fertilizers or increase the efficiency of their use, relying primarily on greater contributions by biofixation. Some issues are addressed below mainly based on our results.
Differences in the NRR among regions can be partly explained by the existing crop production systems. For example, the high NRR values in South America and North America were largely attributable to the extensive cultivation of leguminous crops, whereas the low NRR values in Asia were largely affected by extensive rice cultivation. Two points need to be noted here. First, more frequent planting of leguminous crops may help to reduce the world's reliance on nitrogen fertilizer. Second, land use planners need to find out what crop mixes are best for a given agroecological zone. In addition to other selection criteria (e.g., crop yield, suitability to environment, cost-benefit ratio), the BALsur and potential impact of nitrogen losses on the surrounding environment need to be considered.
On a global average, nearly half of crop residues were recycled. In some developed countries, crop residues were an important source of nitrogen input. For example, in North America, three-fourths of the crop residues were recycled and they accounted for about 20% of the IN. Leaving more crop residues in cropland, or reduced tillage, can increase nitrogen input and reduce nitrogen losses by leaching, volatilization, and soil erosion, and hence increase the NRR (37). The recycling rate of crop residues was generally low in many developing countries, presumably because of the alternative uses of crop residues (e.g., as fuels). In Asia, less than 30% of crop residues were recycled in cropland, whereas in Africa, the recycling rate was 45% (37). If 60% of the crop residues were recycled (which was not uncommon in many developed countries), four African countries would move from nitrogen scarcity to nitrogen stress.
Limitations.
Given the current absence of spatially explicit nitrogen flow data with global coverage, we consider the results from this paper encouraging and reasonable as an early approximation. Nonetheless, a number of limitations in our methodology and results still remain. First, the results may be largely influenced by the lack of several spatially explicit data, including crop-specific fertilizer, volatilization rates, removal factor, or crop-specific nitrogen fixation (INfix). Second, apart from the unavailability of data, we regard the quality of the data used in this paper as a secondary influence. Third, the regression equation may underestimate nitrate leaching in tile-drained systems, where nitrate leaching is generally substantial. Fourth, without considering explicitly the dinitrogen component, our estimate is conservative for the estimation of nitrogen gaseous losses. Last but not least, an unequivocal validation of our results is difficult because this is an early comprehensive assessment of global nitrogen flows on a global scale. A detailed description of these limitations is provided in SI Text.
Materials and Methods
Nitrogen Flows.
The nitrogen flows in cropland are often studied by calculating different input and output nitrogen elements (18, 28). In this study, IN is divided into six elements, whereas OUT is divided into five elements as shown in Eqs. 1 and 2.
where IN and OUT are the total nitrogen input and output, respectively; INfer is the mineral nitrogen fertilizer input; INman is the manure nitrogen input; INdep is the nitrogen input from wet and dry atmospheric deposition; INfix is nitrogen fixation; INsed is the nitrogen input from sedimentation; INres is the nitrogen input from recycled crop residue; and OUTcrop, OUTres, OUTlea, OUTgas, and OUTero are the nitrogen output to harvested crops, crop residues, leaching, gaseous losses, and soil erosion, respectively. All these variables have the same unit (i.e., kilograms of N ha−1·yr−1).
INfer was calculated by using two sources of fertilizer data and the spatially explicit data on crop distribution from the Spatial Production Allocation Model (SPAM) (38, 39). The International Fertilizer Industry Association (IFA) provided statistical data on crop- and country-specific nitrogen fertilizer application rates (40), and the Food and Agriculture Organization of the United Nations (FAO) provided total nitrogen fertilizer application at the country level (20). Several crop distribution maps were available (41–43). We selected the data product generated from the SPAM for two reasons. First, this product provides crop-specific information on harvest area, yield, and production under three different production systems (i.e., irrigated, high-input/commercial rain-fed, low-input/subsistence rain-fed). To our best knowledge, this product is by far the most comprehensive one with such detailed information. Second, this product has undergone a significant validation and feedback process involving centers from the Consultative Group on International Agricultural Research (CGIAR) and other collaborators. Previous validation has indicated that the SPAM produces promising results even in many developing countries, where subnational statistical information is relatively scarce [e.g., Sub-Saharan Africa (39, 44), Brazil (38)]. The SPAM applies a cross-entropy approach and takes account of a broad range of data relevant in downscaling subnational statistical or survey data to the grid cell, including subnational production statistics; interpreted satellite imagery on the extent and area intensity of rain-fed and irrigated crop systems; and other land use data, crop prices, population density, biophysical assessments of location-specific crop “suitability,” and time of travel from farms and local markets to urban centers (38, 44). A more detailed description of the SPAM and data products is provided in SI Text. INman was calculated by multiplying livestock density with animal-specific excretion rates and excretion collection rates. Allocation of manure between cropland and pasture is more relevant for developed countries, particularly for Europe and North America. We have collected data on the share of manure that is used in cropland, mainly for Europe and North America (SI Text). For the United States, the share for each state was collected and used in this study. For Europe, the national averages were used. In developing countries, manure produced in a stable is rarely used in a pasture. Following Smil (4), we assume that 90% of the manure is eventually recycled to crops studied here, whereas the remainder is used for other fodder crops. INdep was based on modeled estimates of total wet and dry mineral (NOy + NHx) deposition as reported by Dentener (45) and Galloway (46). INfix was estimated based on symbiotic INfix rates by leguminous crops or nonsymbiotic INfix rates by Cyanobacteria. INsed was assessed by considering nitrogen inputs both in irrigation and in sediment as a result of erosion. INres was calculated by multiplying OUTres with a removal factor indicating the ratio of the residues removed from the field to the total crop residues. OUTcrop was estimated by multiplying dry crop yield by the nutrient content of the crops. OUTres was calculated by multiplying the dry yield of crop residue by the nutrient content of the crop residues. OUTlea was calculated with a revised regression model developed by De Willigen (47). This model has been used by the FAO (48, 49) and by other researchers [e.g., Smaling et al. (50), Lesschen et al. (19), Haileslassie et al. (51)]. OUTgas was the sum of the emissions of N2O, NO, and NH3. The emissions of N2O and NO were estimated with statistical models developed by Stehfest and Bouwman (26) based on 1,008 N2O and 189 NO emission measurements from agricultural fields around the world. The emissions of NH3 were estimated with statistical models developed by Bouwman et al. (25) based on 1,667 NH3 volatilization measurements from around the world. OUTero was calculated by considering soil erosion, total nitrogen in soil, and a redeposition coefficient. A detailed description of the calculation of different elements of IN and OUT is presented in SI Text.
Two types of nitrogen balances were differentiated in this study. BALsoil was calculated as the difference between IN and OUT, whereas BALsur was calculated as the difference between IN and the nitrogen uptake by crops (OUTup) (OUTup = OUTcrop + OUTres). The NRR is defined as the ratio of OUTup to nitrogen intake by crops.
Nitrogen Scarcity.
A person needs at least 9 kg of N cap−1·yr−1 to maintain a healthy life with an overwhelmingly vegetarian diet (52, 53). This amount is considered the minimum nitrogen input in crop land to support a healthy human being. When the average per capita nitrogen input in a country is lower than this amount, that country is in absolute nitrogen scarcity. It has to import a certain amount of food from the international market to meet part of the domestic digestible nitrogen demand or malnutrition will likely occur. How much nitrogen is sufficient for human's digestible nitrogen requirement is not clear. By using a body weight of 70 kg per person (close to the average body weight for Europeans), a low NRR of 40%, and assuming that 55% of digestible nitrogen is obtained from meat products (average in developed countries), we calculate an amount of 30 kg of N cap−1·yr−1. When a country applies nitrogen above this level in cropland, there should be sufficient nitrogen for this country. We consider half this level (or 15 kg of N cap−1·yr−1) as a threshold below which nitrogen stress occurs. Accordingly, four categories of nitrogen sufficiency are defined, as shown in Table 2. We are aware that such a classification is somehow subjective; nevertheless, it does give a rough estimation of nitrogen scarcity across countries on a global scale.
Supplementary Material
Acknowledgments
We thank Wilfried Winiwarter and Petr Havlik from the International Institute for Applied Systems Analysis, who have shared many discussions through the revision process. We are also indebted to Hans Peter H. Arp (Norwegian Geotechnical Institute) and Pat Fowlkes for editing the paper. We thank the editor and two anonymous reviewers for their constructive comments on an earlier version of the manuscript. This study was supported by the Outstanding Scholar Program of Beijing Forestry University, Beijing, China (Grant BLJ200909).
Footnotes
The authors declare no conflict of interest.
This article is a PNAS Direct Submission.
This article contains supporting information online at www.pnas.org/cgi/content/full/0913658107/DCSupplemental.
References
- 1.Kinzig AP, Socolow RH. Human impacts on the nitrogen cycle. Phys Today. 1994;47:24–31. [Google Scholar]
- 2.Galloway JN, Schlesinger WH, Levy H, II, Michaels A, Schnoor JL. Nitrogen fixation: Anthropogenic enhancement-environmental response. Global Biogeochem Cycles. 1995;9:235–252. [Google Scholar]
- 3.Galloway JN. Environ Pollut. Suppl 1. Vol. 102. Oxford, UK: 1998. The global nitrogen cycle: Changes and consequences; pp. 15–24. [Google Scholar]
- 4.Smil V. Nitrogen in crop production: An account of global flows. Global Biogeochem Cycles. 1999;13:647–662. [Google Scholar]
- 5.Sheldrick WF, Syers JK, Lingard J. A conceptual model for conducting nutrient audits at national, regional, and global scales. Nutr Cycl Agroecosys. 2002;62:61–72. [Google Scholar]
- 6.Sheldrick W, Keith Syers J, Lingard J. Contribution of livestock excreta to nutrient balances. Nutr Cycl Agroecosys. 2003;66:119–131. [Google Scholar]
- 7.Schlesinger WH. On the fate of anthropogenic nitrogen. Proc Natl Acad Sci USA. 2009;106:203–208. doi: 10.1073/pnas.0810193105. [DOI] [PMC free article] [PubMed] [Google Scholar]
- 8.Green PA, et al. Pre-industrial and contemporary fluxes of nitrogen through rivers: A global assessment based on typology. Biogeochemistry. 2004;68:71–105. [Google Scholar]
- 9.Grote U, Craswell E, Vlek P. Nutrient flows in international trade: Ecology and policy issues. Environmental Science & Policy. 2005;8:439–451. [Google Scholar]
- 10.Tilman D. Global environmental impacts of agricultural expansion: The need for sustainable and efficient practices. Proc Natl Acad Sci USA. 1999;96:5995–6000. doi: 10.1073/pnas.96.11.5995. [DOI] [PMC free article] [PubMed] [Google Scholar]
- 11.Tilman D, et al. Forecasting agriculturally driven global environmental change. Science. 2001;292:281–284. doi: 10.1126/science.1057544. [DOI] [PubMed] [Google Scholar]
- 12.Sanchez PA. Soil fertility and hunger in Africa. Science. 2002;295:2019–2020. doi: 10.1126/science.1065256. [DOI] [PubMed] [Google Scholar]
- 13.Liu J, Williams JR, Zehnder AJB, Yang H. GEPIC—Modelling wheat yield and crop water productivity with high resolution on a global scale. Agric Syst. 2007;94:478–493. [Google Scholar]
- 14.Vitousek PM, Mooney HA, Lubchenco J, Melillo JM. Human domination of earth's ecosystems. Science. 1997;277:494–499. [Google Scholar]
- 15.Cicerone RJ, Oremland RS. Biogeochemical aspects of atmospheric methane. Global Biogeochem Cycles. 1998;2:299–327. [Google Scholar]
- 16.Holland EA, Dentener FJ, Braswell BH, Sulzman JM. Contemporary and pre-industrial global reactive nitrogen budgets. Biogeochemistry. 1999;46:7–43. [Google Scholar]
- 17.Ravishankara AR, Daniel JS, Portmann RW. Nitrous oxide (N2O): The dominant ozone-depleting substance emitted in the 21st century. Science. 2009;326:123–125. doi: 10.1126/science.1176985. [DOI] [PubMed] [Google Scholar]
- 18.Smaling EMA, Stoorvogel JJ, Windmeijer PN. Calculating soil nutrient balances in Africa at different scales: II. District scale. Fertilizer Research. 1993;35:237–250. [Google Scholar]
- 19.Lesschen J, Stoorvogel J, Smaling E, Heuvelink G, Veldkamp A. A spatially explicit methodology to quantify soil nutrient balances and their uncertainties at the national level. Nutr Cycl Agroecosys. 2007;78:111–131. [Google Scholar]
- 20.FAO . FAOSTAT: FAO Statistical Databases. Rome: Food and Agriculture Organization of the United Nations; 2006. [Google Scholar]
- 21.Herridge DF, Peoples MB. Ureide assay for measuring nitrogen fixation by nodulated soybean calibrated by 15N methods. Plant Physiol. 1990;93:495–503. doi: 10.1104/pp.93.2.495. [DOI] [PMC free article] [PubMed] [Google Scholar]
- 22.Singh B, Singh Y, Sekhon GS. Fertilizer-N use efficiency and nitrate pollution of groundwater in developing countries. J Contam Hydrol. 1995;20:167–184. [Google Scholar]
- 23.Cassman KG, et al. Long-term comparison of the agronomic efficiency and residual benefits of organic and inorganic nitrogen sources for tropical lowland rice. Experimental Agriculture. 1996;32:427–444. [Google Scholar]
- 24.Bouwman AF, Van Drecht G, Van der Hoek KW. Global and regional nitrogen balances in intensive agricultural production systems for the period 1970-2030. Pedosphere. 2005;15:137–155. [Google Scholar]
- 25.Bouwman AF, Boumans LJM, Batjes NH. Estimation of global NH3 volatilization loss from synthetic fertilizers and animal manure applied to arable lands and grasslands. Global Biogeochem Cycles. 2002;16:8–1. [Google Scholar]
- 26.Stehfest E, Bouwman L. N2O and NO emission from agricultural fields and soils under natural vegetation: Summarizing available measurement data and modeling of global annual emissions. Nutr Cycl Agroecosys. 2006;74:207–228. [Google Scholar]
- 27.Gentry LE, David MB, Below FE, Royer TV, McIsaac GF. Nitrogen mass balance of a tile-drained agricultural watershed in east-central Illinois. J Environ Qual. 2009;38:1841–1847. doi: 10.2134/jeq2008.0406. [DOI] [PubMed] [Google Scholar]
- 28.Stoorvogel JJ, Smaling EMA. Research on soil fertility decline in tropical environments: Integration of spatial scales. Nutr Cycl Agroecosys. 1998;50:151–158. [Google Scholar]
- 29.Sanchez PA, Swaminathan MS. Hunger in Africa: The link between unhealthy people and unhealthy soils. Lancet. 2005;365:442–444. doi: 10.1016/S0140-6736(05)17834-9. [DOI] [PubMed] [Google Scholar]
- 30.FAO . Food Security Statistics. Rome: FAO Statistics Division, Food and Agriculture Organization of the United Nations; 2006. [Google Scholar]
- 31.Liu J, Zehnder AJB, Yang H. Global consumptive water use for crop production: The importance of green water and virtual water. Water Resour Res. 2009;45:W05428. [Google Scholar]
- 32.Hoekstra AY, Hung PQ. Globalisation of water resources: International virtual water flows in relation to crop trade. Glob Environ Change A. 2005;15:45–56. [Google Scholar]
- 33.Yang H, Reichert P, Abbaspour KC, Zehnder AJB. A water resources threshold and its implications for food security. Environ Sci Technol. 2003;37:3048–3054. doi: 10.1021/es0263689. [DOI] [PubMed] [Google Scholar]
- 34.Liu J, Zehnder AJB, Yang H. Historical trends in China's virtual water trade. Water International. 2007;32:78–90. [Google Scholar]
- 35.Bouwman AF, Van Drecht G, Knoop JM, Beusen AHW, Meinardi CR. Exploring changes in river nitrogen export to the world's oceans. Global Biogeochem Cycles. 2005;19:GB1002. [Google Scholar]
- 36.David MB, et al. Modeling denitrification in a tile-drained, corn and soybean agroecosystem of Illinois, USA. Biogeochemistry. 2009;93:7–30. [Google Scholar]
- 37.Tilman D, Cassman KG, Matson PA, Naylor R, Polasky S. Agricultural sustainability and intensive production practices. Nature. 2002;418:671–677. doi: 10.1038/nature01014. [DOI] [PubMed] [Google Scholar]
- 38.You L, Wood S. An entropy approach to spatial disaggregation of agricultural production. Agric Syst. 2006;90:329–347. [Google Scholar]
- 39.You L, Wood S, Wood-Sichra U. Generating plausible crop distribution maps for Sub-Saharan Africa using a spatially disaggregated data fusion and optimization approach. Agric Syst. 2009;99:126–140. [Google Scholar]
- 40.IFA/IFDC/IPI/PPI/FAO . Fertilizer Use by Crops. 5th Ed. Rome: International Fertilizer Industry Association; 2002. [Google Scholar]
- 41.Leff B, Ramankutty N, Foley JA. Geographic distribution of major crops across the world. Global Biogeochem Cycles. 2004;18:GB1009. [Google Scholar]
- 42.Goldewijk KK, van Drecht G, Bouwman AF. Mapping contemporary global cropland and grassland distributions on a 5 × 5 minute resolution. Journal of Land Use Science. 2007;2:167–190. [Google Scholar]
- 43.Ramankutty N, Evan AT, Monfreda C, Foley JA. Farming the planet: 1. Geographic distribution of global agricultural lands in the year 2000. Global Biogeochem Cycles. 2008;22:GB1003. [Google Scholar]
- 44.You L, Wood S, Wood-Sichra U, Chamberlin J. Generating plausible crop distribution maps for Sub-Saharan Africa using a spatial allocation model. Information Development. 2007;23:151–159. [Google Scholar]
- 45.Dentener FJ. Global Maps of Atmospheric Nitrogen Deposition, 1860, 1993, and 2050. Oak Ridge, TN: Oak Ridge National Laboratory Distributed Active Archive Center; 2006. [Google Scholar]
- 46.Galloway JN. Nitrogen cycles: Past, present, and future. Biogeochemistry. 2004;70:153–226. [Google Scholar]
- 47.De Willigen P. An Analysis of the Calculation of Leaching and Denitrification Losses as Practised in the NUTMON Approach. Wageningen, The Netherlands: Plant Research International; 2000. [Google Scholar]
- 48.Roy RN, Misra RV, Lesschen JP, Smaling EMA. Assessment of Soil Nutrient Balance. Approaches and Methodologies. FAO Fertilizer and Plant Nutrition Bulletin 14. Rome: FAO; 2003. [Google Scholar]
- 49.FAO . Scaling Soil Nutrient Balances—Enabling Mesoscale Approaches for African Realities. FAO Fertilizer and Plant Nutrition Bulletin 15. Rome: FAO; 2004. [Google Scholar]
- 50.Smaling EMA, Roscoe R, Lesschen JP, Bouwman AF, Comunello E. From forest to waste: Assessment of the Brazilian soybean chain, using nitrogen as a marker. Agric Ecosyst Environ. 2008;128:185–197. [Google Scholar]
- 51.Haileslassie A, Priess JA, Veldkamp E, Lesschen JP. Smallholders’ soil fertility management in the Central Highlands of Ethiopia: Implications for nutrient stocks, balances and sustainability of agroecosystems. Nutr Cycl Agroecosys. 2006;75:135–146. [Google Scholar]
- 52.Smil V. Nitrogen and food production: Proteins for human fiets. Ambio. 2002;31:126–131. doi: 10.1579/0044-7447-31.2.126. [DOI] [PubMed] [Google Scholar]
- 53.Buck JL. Land Utilization in China. Nanking, China: Nanking University; 1937. [Google Scholar]
Associated Data
This section collects any data citations, data availability statements, or supplementary materials included in this article.