

Abstract
Chronic myelogenous leukemia is characterized by the presence of the chimeric BCR-ABL gene, which is expressed as the constitutively active Bcr-Abl kinase. Although kinase activity is directly responsible for the clinical phenotype, current diagnostic and prognostic methods focus on a genetic classification system where molecularly distinct subcategories are used to predict patient responses to small-molecule inhibitors of the Bcr-Abl kinase. Point mutations in the kinase domain are a central factor regulating inhibitor resistance; however, compensatory signaling caused by the activation of unrelated kinases can influence inhibitor efficacy. Kinase activity profiling can be used as a complementary approach to genetic screening and allows direct screening of small-molecule inhibitors. We developed a quantitative assay to monitor tyrosine kinase activities and inhibitor sensitivities in a model of chronic myelogenous leukemia using peptide reporters covalently immobilized on Luminex beads. Kinase activity is quantified by non-linear regression from well-specific internal standard curves. Using optimized synthetic substrates and peptides derived from native substrates as probes, we measured kinase inhibition in cell lysates by the signal transduction inhibitors imatinib and dasatinib. Taking advantage of a convenient 96-well plate format, this assay also allows a straightforward and quantitative analysis of the differential effects of ATP and inhibitors on kinase activity. This method for analyzing a focused signaling network benefits from rigorous statistical analysis and short processing times, thereby offering a powerful tool for drug discovery and clinical testing.
Chronic myelogenous leukemia (CML) is caused by a reciprocal translocation between chromosomes 9 and 22, resulting in the formation of a shortened chromosome, named the Philadelphia chromosome, that produces a hybrid gene, BCR-ABL. Expressed as a fusion protein with up-regulated tyrosine kinase activity, BCR-ABL affects multiple intracellular signaling pathways leading to the proliferation of hematopoietic progenitor cells. Because it is effectively diagnosed by the presence of BCR-ABL, CML is a prominent example for the use of molecular markers to support histology-based classifications of disease (1). However, cytogenetic and molecular response studies have demonstrated that the characterization of disease is complicated by molecularly distinct subgroups that respond differently to established therapies. Although resistance to small-molecule kinase inhibitors such as imatinib (Gleevec, STI571) may be the direct result of point mutations in the Bcr-Abl kinase domain, alternative causes of resistance include the over-expression of Bcr-Abl and members of the Src family, specifically Hck and Lyn (2-4). Indeed, Bcr-Abl signaling is regulated by interactions at Bcr and Abl domains, as well as Src homology SH2 and SH3, actin- and DNA-binding domains, and necessarily involves the participation of a variety of intracellular proteins to override normal regulatory cues (5). As a result, therapeutic strategies using a combination of inhibitors with restricted specificity or multi-target inhibitors are being developed to overcome resistance and modulate oncogenic signaling (6). Under these circumstances, the development of sensitive and reliable methods to monitor pathway activation and the effects of multi-target inhibitors may be as important to cancer therapy as the development of novel pharmaceutical compounds (7).
The diversity of phenotypes in clinical examples of CML may be attributed to differential signaling patterns that originate from changes in multiple kinase activities. Genome-wide profiling of gene expression has provided distinct signatures that may identify active signaling pathways and guide the prediction of prognostic subclasses (8). However, functional screens that involve a direct assay of kinase activity are more efficient tests of inhibitor efficacy and may be better suited to clinical applications (9). Several approaches have been developed to assess the influence of multiple kinases within an intracellular signaling network; these range from arrays of antibodies to capture kinase and substrate phosphorylation sites to arrays of protein substrates for direct assays of kinase activity. These array-based approaches are particularly useful for assessing pathway activation in response to small-molecule inhibitors. The use of peptide substrates has significantly simplified array production and handling (10). Indeed, peptide microarrays offer highly multiplexed detection of substrate phosphorylation with spatial addressing, allowing the interrogation of multiple kinase activities in cell extracts with a single anti-phosphotyrosine antibody (11). Recent advances have prompted the development of large-scale peptide arrays with varying formats and detection strategies. These include parallel analyses of peptide substrates arranged in 96-well plates (12) or spotted on glass slides (13) to monitor the incorporation of isotope-labeled phosphate from radioactive ATP. Bead-based capture of phosphorylated peptide substrates with oligonucleotide affinity tags and three-step phospho-labeling has been used to facilitate rapid solution-phase kinetics using purified kinases (14). Synthetic peptide substrates have been enriched from solution-phase reactions with cell lysates and quantitatively identified by mass spectrometry (15). Advanced production techniques have constructed miniaturized three-dimensional peptide matrices, which are labeled by a fluorescent anti-phosphotyrosine antibody and monitored periodically by a charge-coupled device camera to derive rate measurements (16). Several of these methods rely on an expanded library of peptide substrates to derive multiple kinase activities from patterns of preferential phosphorylation. Although this provides a comprehensive view and is a common means to circumvent the challenge of monitoring specific kinase activity with a single peptide substrate, a smaller selection of peptides may be chosen from previously validated assays to monitor pathway activation and inhibition. Toward this end, we developed an assay that uses a focused group of peptide substrates covalently immobilized on Luminex beads to monitor tyrosine kinase activity and inhibition in whole cell lysates.
Materials and Methods
Cell culture, lysis, and inhibition
Imatinib and dasatinib were purchased from LC Laboratories (Woburn, MA). Pyrido[2,3-d]pyrimidine-7-one class kinase inhibitors PD166326, PD173955, and DV2-273 were generously provided by Darren Veach and Bayard Clarkson (Memorial Sloan-Kettering Cancer Center, New York, NY). K-562 cells were purchased from American Type Culture Collection and cultured according to the manufacturer's instructions. Lysates used for activity and inhibition assays were prepared from confluent cells as previously described (17). For K-562 cells treated with inhibitors in culture, cells were grown to confluence from the minimum recommended density over 3-4 days without serum replenishment before treatment. Confluent cells were distributed in sterile 96-well filter plates (AcroPrep™, Pall, East Hills, NY) and treated with inhibitors serially diluted in DMSO for 1 h at 37 °C. All subsequent steps were carried out on ice or at 4 °C and in-plate lysis was performed as previously described (18).
Peptide synthesis and generation of internal standards
Peptides were designed based on established kinase substrate sequences and synthesized with amino-terminal cysteines as previously described (17). Abltide (CEAIYAAPFAKKK) and Srctide (CAEEEIYGEFEAKKKK) are optimized synthetic substrates for Abl and Src kinases, respectively (19). Abltide was also synthesized with a carboxyl-terminal cysteine (KGEAIYAAPFAKKKGC) for immobilization in the opposite orientation. To investigate the effects of modular kinase recognition domains, we synthesized Abltide in tandem with p40, the high-affinity peptide ligand for the Abl kinase SH3 domain (20). This was positioned in two orientations with Abltide at either the amino-terminus (CEAIYAAPFAKKKGGAPTYSPPPPPLL) or at the carboxyl-terminus (CGGAPTYSPPPPPLLEAIYAAPFAKKK). The validated peptide substrate for Btk kinase was derived from its tyrosine auto-phosphorylation site (CKKVVALYDYMPMN) (21, 22). Similarly, we synthesized peptides derived from the singular tyrosine phosphorylation sites on Crk (CGGPEPGPYAQPSVNTPLPN) (23), CrkL (CGIPEPAHAYAQPQTTTPLPA) (24), and Stat5a (CAKAVDGYVKPQIKQVVKKK) (25, 26). Internal standards were generated from synthetic Abltide and phospho-Abltide (CEAI-pY-AAPFAKKK). To ensure accurate relative concentrations between Abltide and phospho-Abltide for 15%, 25%, 30%, 45%, and 50% molar mixtures, purified synthetic peptides were analyzed separately by absorbance of the peptide backbone at 214 nm with analytical C18 RP-HPLC (Waters 6000S HPLC system, Milford, MA). Integrated peak areas were plotted versus injection volumes per peptide and the ratio of the slopes was used as the calibration factor for relative peptide concentration. Pure Abltide and phospho-Abltide were used for 0% and 100% phospho-standards.
Covalent substrate immobilization
Luminex (Austen, TX) generously provided Luminex beads with free carboxyl groups in bead regions 27, 34, 42, 45, 56, 61, 65, and 73. Beads were modified with primary amines using standard methods (27). Up to 300 μL of carboxylated beads, supplied at 1.25 × 10⁷ beads/mL, were added to a filtered microcentrifuge tube, washed with water by centrifugation at 100g, and re-suspended in 100 mM NaH2PO4, pH 6.2. 50 μL of 50 mg/mL NHS in water and 50 μL of 50 mg/mL EDC in water were added and the beads were incubated at room temperature for 20 m with gentle shaking. Beads were washed three times with 100 mM MES, pH 5.0, and re-suspended in 100 μM N-(3-Aminopropyl)methacrylamide (Polysciences, Warrington, PA) in the same buffer. The primary coupling reaction was mixed for 2 h at room temperature. Beads were washed three times with 100 mM NH4HCO3, pH 8.0, and re-suspended in 100 μM peptide in the same buffer. The secondary coupling reaction was mixed for 1 h at room temperature and allowed to incubate 12-18 h at 4 °C. Modified beads were counted using a hemacytometer and stored at 4 °C for up to a year in PBS, pH 7.4, supplemented with HALT phosphatase inhibitor (Pierce, Rockford, IL) as necessary.
Kinase assays
Modified Luminex beads were distributed to 96-well filter plates using a Precision Microplate Pipetting System (BioTek, Winooski, VT). 96-well filter plates, containing approximately 1000 peptide-modified beads per type per well, were vacuum-washed three times with 10 mM Tris-HCl, pH 7.4 with 50 mM MgCl2. A 50 μL reaction mixture, containing kinase buffer (50 mM Tris-HCl, pH 7.5, 10 mM MgCl2, 1 mM EGTA, 0.01% Brij-35, 2 mM DTT, and 1× Complete protease inhibitor (Roche Diagnostics, Manheim, Germany)), 10 μM ATP (unless otherwise specified), and variable concentrations of purified kinase or cell lysates, was incubated with beads for up to 60 m. Lysates prepared in-plate from approximately one million cells per well were diluted five-fold for activity assays. Lysates prepared from large populations of cells in conical tubes were diluted up to fifty-fold. Recombinant human Abl kinase (EC 2.7.10.2) was purchased from Millipore (Billerca, MA). Kinase reactions were terminated by the addition of 250 mM EDTA, pH 8.0. Three 5 m washes with 2% SDS and 5 successive washes with water were used to remove non-specific adsorption and detergent. 1 h incubation with 1% BSA in TBS with 0.1% Tween-20 (TBST) was used to block non-specific binding of labeling antibodies. Phosphorylated substrate was either labeled sequentially with a 1:1000 dilution of biotinylated 4G10 and a 1:1000 dilution of phycoerythrin-coupled streptavidin (both Millipore), or in a single step by the addition of a 1:10 dilution of phycoerythrin-conjugated PY20 (BD Phosflow, San Jose, CA) in TBST. Beads were given a final wash with TBST and re-suspended in the Luminex system running buffer prior to analysis. Data were acquired with a minimum target of 100 bead counts per region per well using the BioPlex 200 system from BioRad (Hercules, CA), calibrated separately at both high (15993) and low (3515) targets to determine the maximum range of detector linearity per plate.
Statistical analysis
Several parameters were recorded for each bead region analyzed: the number of beads per region in the queried sample, the median, the mean, and the standard deviation of bound phycoerythrin per bead region. Data were reviewed using widely accepted methods of statistical inference (28). The following is the standard calculation procedure for the confidence interval and the standard error (29). Tables of t-values used in the calculation of the confidence interval were verified against published data from standard sources (28, 30).
| Wherein: | |
| X | = the mean fluorescence intensity per bead region per well |
| tα/2 | = 2-tailed t distribution, for a specified level of confidence (α) |
| n-1 | = degrees of freedom (df), sampled bead count per region per well minus one |
| σ | = standard deviation of the fluorescence intensity per bead region per well |
| n | = sample size, the number of beads sampled per bead region per well |
Because of variations in sample sizes, it was necessary to calculate confidence intervals based on specific t-values for each bead region in each well of a 96-well plate. The sampled number of beads per region per well was often less than 200, resulting in t-values that were substantially different from the normal distribution. Therefore, separate t-values were derived based on the sample size (n) for each bead region in each well, using published extended values for the t-distribution with six significant digits for df from 40 to 200 within one well (30) and 4 significant digits for df from 500 to 10,000 over an entire plate (31).
Non-Linear Regression
Well-specific standard curves were constructed from the observed mean fluorescence intensity of known ratios of synthetically phosphorylated Abltide. Prism v4.0a (GraphPad Software, Inc., La Jolla, CA, USA) was used to calculate the goodness of fit to non-linear models, where the criterion for selection was the minimum absolute sum of squares. For comparison the correlation coefficient, R2, was also noted.
Western Immunoblotting
The PathScan Bcr-Abl Activity Assay kit for multiplexed Western blot analysis was purchased from Cell Signaling Technologies (Beverly, MA). 60 μg of total protein from imatinib and dasatinib-inhibited lysates were separated on a 4-12% Bis-Tris NuPAGE gel with MOPS SDS running buffer (Invitrogen, Carlsbad, CA), transferred to nitrocellulose membranes (BioRad, Hercules, CA), and reversibly stained with Memcode (Pierce) to ensure approximately equal protein loading per lane. Membranes were blocked with 5% skim milk in TBST for 1 h and probed with the primary antibody cocktail at a 1:500 dilution in 3% skim milk in TBST for 48 h at 4 °C, and secondary antibody at a 1:500 in 3% skim milk in TBST for 1 h at room temperature. Quantity One software v4.6.6 (Bio-Rad) was used to quantitate the relative density around each protein band in digitally rendered film exposures.
Results
Luminex beads allow for population-based statistical analysis of peptide substrate phosphorylation
Constitutively active Bcr-Abl provides the dominant oncogenic stimulus in CML and promotes cellular transformation through a network of protein interactions that include Crk, CrkL, Stat5a, Btk, and various kinases in the Src family (Figure 1A). Abltide is routinely used to measure the characteristic Bcr-Abl activity profile of CML. Abltide is an optimized peptide substrate for Abl and its oncogenic relative Bcr-Abl that has shown little reactivity with structurally similar kinases such as Src (19). We synthesized Abltide for immobilization on Luminex beads. To provide accessibility to immobilized Abltide at the bead surface, a biologically passivating N-(3-Aminopropyl)methacrylamide linker was introduced using EDC/NHS cross-linking to carboxyl-coated Luminex beads. Abltide was covalently attached to resulting acryl groups by Michael addition of the sulfhydryl at the amino-terminal cysteine (17). Following phosphorylation, Abltide was sequentially labeled with a biotinylated anti-phosphotyrosine antibody and phycoerythrin-conjugated streptavidin.
Figure 1.

A, a simplified network of intracellular Bcr-Abl kinase signaling, showing only direct interactions between the kinase Bcr-Abl, adapter proteins Crk and CrkL, the transcription factor Stat5, the kinase Btk, and select members of the Src family of kinases, c-Src, Hck, Lyn, Yes, Fyn, and Csk. These proteins have been shown to play a role in the initiation, progression, or maintenance of CML though either up-regulation, over-expression, or by interaction with the inhibitors imatinib and dasatinib. The functional network was constructed using the MetaCore™ (GeneGo, St. Joseph, MI) database of reported interactions manually curated from the literature. Blue arrows represent protein binding or substrate phosphorylation that leads to activation, while red arrows represent interactions that lead to inhibition. A black line represents interactions that have been activating or inhibiting under different conditions. B, experimental scheme. To monitor tyrosine kinase activity in a signaling network, we covalently immobilized peptide substrates on Luminex beads via an acrylamide linker. Beads bearing different peptide substrates were combined in a single well and reacted with cell lysates. A set of four synthetically phosphorylated internal standards were added to each well in a 96-well array following the termination of kinase reactions and prior to labeling with fluorescent antibodies against phospho-tyrosine. Non-linear regression from well-specific internal standard curves was used to calculate the percentage of substrate phosphorylation. This allowed for accurate comparisons between wells in an array and between arrays.
We incubated serial dilutions of purified recombinant Abl with immobilized Abltide to profile the relationship between enzyme activity and fluorescent signal accumulation (Supplementary Figure 1). We estimated a maximum loading capacity of 8.3 femtomoles of peptide substrate per 1000 beads given approximately 5 million carboxyl groups per bead. Assuming conditions of relative enzyme excess, traditional Michaelis-Menten analysis was inapplicable (32). The change in fluorescence with increasing enzyme was best modeled by a sigmoidal curve, emphasizing a dose-response association. A range of random factors could have caused deviations from the sigmoidal fit, and the median fluorescence intensity did not provide access to measurement confidence. Without a clear understanding of the significance of data distributions within and between wells (Supplementary Figure 2), it was not possible to construct a detailed model to relate the measured signal to the amount of active enzyme.
Consequently, we developed well-specific internal standard curves for the accurate quantitation of experimental peptide phosphorylation and established a statistical analysis that was based on bead populations. Two confidence intervals were calculated to the 0.01 level. One confidence interval described the set of sampled beads in each well to assess the accuracy with which the measured fluorescence intensity of the queried sample represented the total population of beads in the well. The second confidence interval described variations attributed to biologically identical conditions in triplicate wells. The most basic kinase assay used one experimental peptide substrate and one internal standard curve per well. We expanded this format to include multiple peptide substrates per well for the analysis of pathway activation in a signaling network (Figure 1B).
Generation of internal standards
To monitor systemic variations across a plate, we designed a set of synthetic peptide standards that could be combined in a single well to form an internal standard curve. Standards were produced by mixing synthetic Abltide and synthetic phospho-Abltide in known molar ratios. Fluorescence measurements for 0% and 100% substrate phosphorylation were generated from pure Abltide and synthetic phospho-Abltide. Data for 15%, 25%, 30%, 45% and 50% were produced by corresponding molar ratios of phospho-Abltide to Abltide. Standard beads were distributed to each well of a 96-well plate and labeled with fluorescent anti-phosphotyrosine antibody conjugated in one of two ways: either directly, using the phycoerythrin-labeled PY20 (PY20-PE) clone (Figure 2A), or sequentially, using the biotinylated 4G10 clone followed by phycoerythrin-labeled streptavidin (streptavidin-PE) (Figure 2B). Fluorescence readout was not linear with increasing phosphorylation and varied significantly from well to well over an entire 96-well plate. The choice of PY20 or 4G10 to label phosphorylated tyrosines did not affect the shape of internal standard curves, which were best fit by a Boltzmann sigmoidal model. Best-fit curves were not affected by the maximum degree of standard phosphorylation; curves reached saturation whether 45% or 100% was used as the maximum standard value. We attributed the biphasic shape of the functional relationship between fluorescence intensity and the percentage of peptide phosphorylation to saturation dynamics of divalent antibodies in close proximity. Well-to-well differences in slope were attributed to uncontrollable variability between homogeneous mixtures, emphasizing the effect of small differences in concentration and mixing efficiencies. To confirm the direct relationship between the steepness of the internal standard curve and the concentration of antibody used to label phosphorylated peptides, we applied serial dilutions of PY20-PE and biotinylated 4G10 to an identical set of standards (Figures 2C, 2D). Internal standard curves provided a reasonable basis for deriving the extent of experimental phosphorylation within a specified risk of error. While the development of an internal standard curve for quantitation is unique, the use of internal positive and negative controls in multiplexed Luminex assays has already been shown to improve assay reliability (33, 34). As applied here, internal standard curves provide the basis for reaction-specific quantitation while controlling for detector bias toward fluorescent labels.
Figure 2.
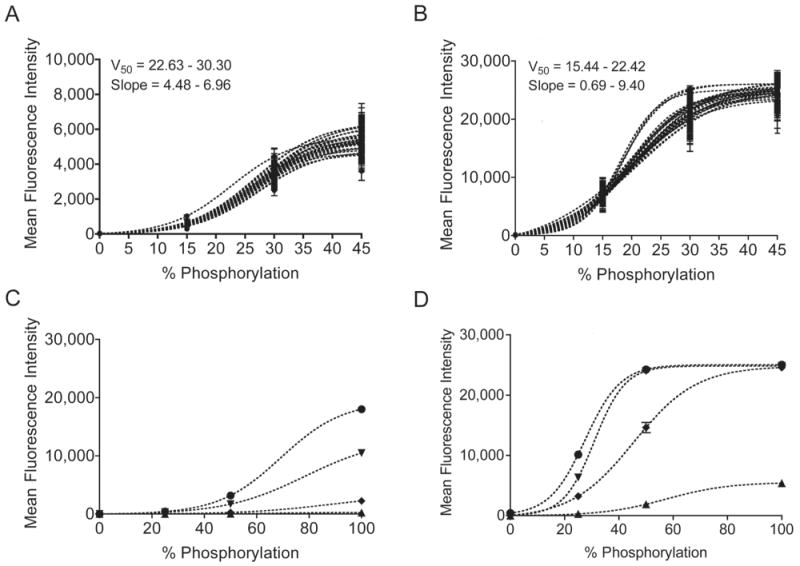
Internal standard curves were constructed from four synthetic peptide standards in each well of a 96-well plate. The mean fluorescence intensity from four standards with varying degrees of immobilized synthetically phosphorylated Abltide is best modeled by a Boltzmann sigmoidal curve. Identical sets of standards labeled with either PY20-PE (A) or biotinylated 4G10 and streptavidin-PE (B) displayed large differences in the maximum fluorescence intensity. Within a single 96-well plate, well-specific standard curves displayed differences in slope and in the percentage of phosphorylation resulting in half maximal fluorescence (V50), as calculated from the average of 100-300 measurements per standard per well. Serial dilutions of fluorescent anti-phosphotyrosine antibodies were used to confirm the effect of concentration on maximal fluorescence and slope. C, PY20-PE at the following concentrations in decreasing order: 150, 15, 1.5, 0.15 ng/mL. D, 4G10-biotin at the following concentrations in decreasing order: 1000, 100, 10, 1 ng/mL. Error bars for all mean fluorescence measurements indicate 99% confidence intervals.
Abltide phosphorylation using cell lysates
After establishing the relevance of measured fluorescence intensity to kinase activity, we evaluated assay performance by measuring Abltide phosphorylation in K-562 cell lysates. Serially diluted K-562 lysates were added to beads with immobilized Abltide to assess the optimum amount of lysates necessary for a quantitative characterization of system kinetics (Figure 3A). The best-fit curve was hyperbolic, highlighting the degree of enzyme excess common to assays using immobilized substrate. Thus, very small amounts of cell lysates were required to generate a signal within the linear and most sensitive detection range. Using diluted K-562 lysates, with only 20 μg of total protein per reaction, we monitored the phosphorylation of immobilized Abltide in discrete time points for up to 60 minutes (Figure 3B). The progress curve follows a hyperbolic trend, emphasizing rate reduction with substrate depletion after fifteen minutes. Although dependent on intrinsic Bcr-Abl activity, our assay demonstrated the greatest sensitivity for short reaction times. Future applications may provide comprehensive analysis in less than 30 minutes.
Figure 3.
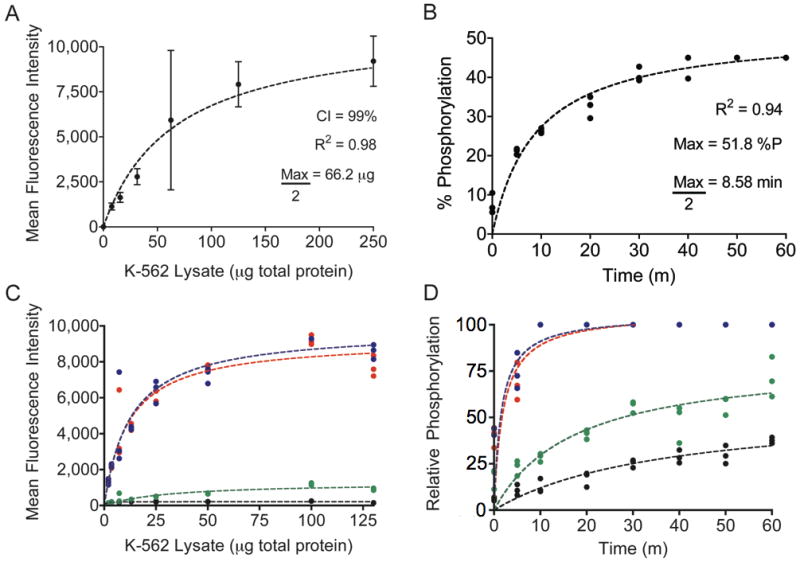
A, Abltide phosphorylation by K-562 cell lysates. Using mean fluorescence intensities and 99% confidence intervals from sampled beads, a series of only eight wells was sufficient to derive the central tendency of saturating kinase activity. B, reaction kinetics were monitored using 20 μg of total protein in K-562 lysates, less than half of the concentration necessary to obtain maximal Abltide phosphorylation. C, competitive substrate preference was determined by presenting four substrates immobilized on distinct Luminex beads: Abltide, immobilized via an amino-terminal cysteine (black) and via a carboxyl-terminal cysteine (green), and Abltide in tandem with p40, arranged with Abltide proximal (blue) or distal (red) to the immobilization site. Substrates that included p40 were phosphorylated to a greater extent using less cell lysates than required for Abltide alone (half-maximal phosphorylation with 11.6 μg (red) and 12.81 μg (blue) of total protein). Meanwhile Abltide reached a saturating fluorescence intensity of only 200 a.u. when presented in the company of substrates that included p40, compared to the 10,000 a.u. obtained when presented alone (A). D, Abltide was phosphorylated to a greater extent in a shorter amount of time when presented in tandem with p40 (blue and red), reaching half maximal phosphorylation in under two minutes. By comparison, Abltide (green, black) reached half maximal phosphorylation in over twice the time required when presented alone. In all cases, biological triplicates were best fit by hyperbolic curves.
Substrate optimization
To investigate methods that further increase assay sensitivity, we modified the original Abltide substrate. Previous work using immobilized Abltide to measure Bcr-Abl activity in cell lysates demonstrated that altered orientations resulted in increased signal intensities (35). It was also shown that inclusion of p40, the high-affinity peptide ligand for the Abl kinase SH3 domain, led to more efficient phosphorylation of Abltide (17, 36). To test the influence of peptide orientation on assay sensitivity we synthesized Abltide with a carboxyl-terminal cysteine. Abltide was also synthesized in tandem with p40, either proximal or distal to the immobilization site. To determine substrate preference, we combined these four substrates in the same reaction with K-562 lysates (Figure 3C, 3D). Relative substrate phosphorylation was expressed as a percentage between 0 and 100, following transformation of raw fluorescence intensity using internal standard curves. The results provided relative comparisons against synthetic Abltide and phospho-Abltide standards. Abltide immobilized via a carboxyl-terminal cysteine was phosphorylated to a greater extent than Abltide immobilized via an amino-terminal cysteine. Structural modeling suggested that immobilization of Abltide in the opposite orientation may orient the substrate tyrosine for improved accessibility to kinases in solution (Supplementary Figure 3). The inclusion of p40 in tandem with Abltide significantly reduced the amount of lysates necessary to obtain a saturating signal (Figure 3C). Similarly, substrates that included p40 were phosphorylated more rapidly than Abltide alone (Figure 3D). Mass spectrometry and fluorescent anti-phosphotyrosine antibody labeling confirmed that signal increases were not the result of phosphorylation at an additional tyrosine in p40 (17, 36). Results from these competition assays suggested that p40 recruits Bcr-Abl to the bead surface by interaction with the SH3 domain. These results demonstrated that modular peptide recognition motifs could be combined and rearranged to optimize assay sensitivity.
Inhibitor screening in cells and cell lysates
To demonstrate the potential role in high-throughput pharmaceutical screening of kinase inhibitors, we monitored the potency of several clinically relevant inhibitors in K-562 cell lysates and cultured cells. Five ATP-competitive inhibitors were tested in a 96-well plate format: imatinib (STI571) (37), dasatinib (BMS-354825) (38), DV2-273 (17), PD166326 (17, 39) and PD173955 (17, 39). To monitor inhibition in cell lysates, lysates were prepared in a single batch and distributed into 96-well plates containing Abltide-modified Luminex beads and various concentrations of each inhibitor. To emphasize small differences between effective inhibitor concentrations, we used cell lysates that fell within the most sensitive detection range and inhibitor concentrations that flanked the expected value required for half-maximal inhibition (IC50). On the other hand, inhibition in cultured K-562 cells was performed in 96-well filter plates, where cells were dosed, lysed, and harvested in-plate. Although details of the approach are described and validated elsewhere (18), the inhibition of kinases in cultured cells involved the distribution of confluent cells in sterile 96-well filter plates and incubation with inhibitors for one hour. Cells were washed by centrifugation, lysed in-plate, and lysates collected by a second 96-well plate during centrifugation at 4 °C. Collected lysates were transferred to a third 96-well filter plate containing Abltide-conjugated beads for the kinase activity assay. In all cases, IC50 values were calculated from the best-fit curve through biological triplicates.
Several factors resulting from differences in treatment conditions and the preparation of lysates limit the direct juxtaposition of IC50 values obtained from the treatment of cells versus cell lysates. These differences include lysis efficiency, competitive ATP concentrations and the presence of phosphatase inhibitors at the time of inhibition. For example, considering the high concentration of intracellular ATP, we expected IC50 values to be larger for assays using lysates derived from cells treated with inhibitors. Conversely, by encouraging kinase activity, the presence of phosphatase inhibitors during lysate inhibition may have reduced the likelihood that small-molecule inhibitors were able to stabilize kinase inactive states. Therefore, expected IC50 values might instead be smaller for assays using lysates derived from cells treated with kinase inhibitors.
Despite numerous factors that were not consistent between the two types of experiments and that undoubtedly influenced inhibitor potency, several interesting features were highlighted by qualitative comparisons. For example, the advantage of using internal standard curves over non-standardized activity assays is highlighted in Figures 4A and 4B. Imatinib was used to inhibit Bcr-Abl in lysates and in cells. Abltide phosphorylation was monitored with unique antibodies in two separate experiments; inhibited lysates were labeled with biotinylated 4G10 and streptavidin-PE, while lysates from inhibited cells were labeled with PY20-PE (Figure 4A). Internal standard curves automatically corrected for differences in mean fluorescence intensities between separate experiments. Inhibition curves overlaped when translated from arbitrary fluorescence intensity units to the accurate percentage of Abltide phosphorylation (Figure 4B). This was used to highlight qualitative differences between the results from each technique. The maximum activity of Bcr-Abl in lysates prepared in-plate appeared to be equal to lysates prepared in conical tubes, suggesting equivalent lysis efficiencies. High concentrations of imatinib appeared to lose potency in cells, with residual Abltide phosphorylation near 10% at 100 μM inhibitor. This observation may be the consequence of off-target effects at high concentrations limiting inhibitor bioavailability or transport in cells (40).
Figure 4.
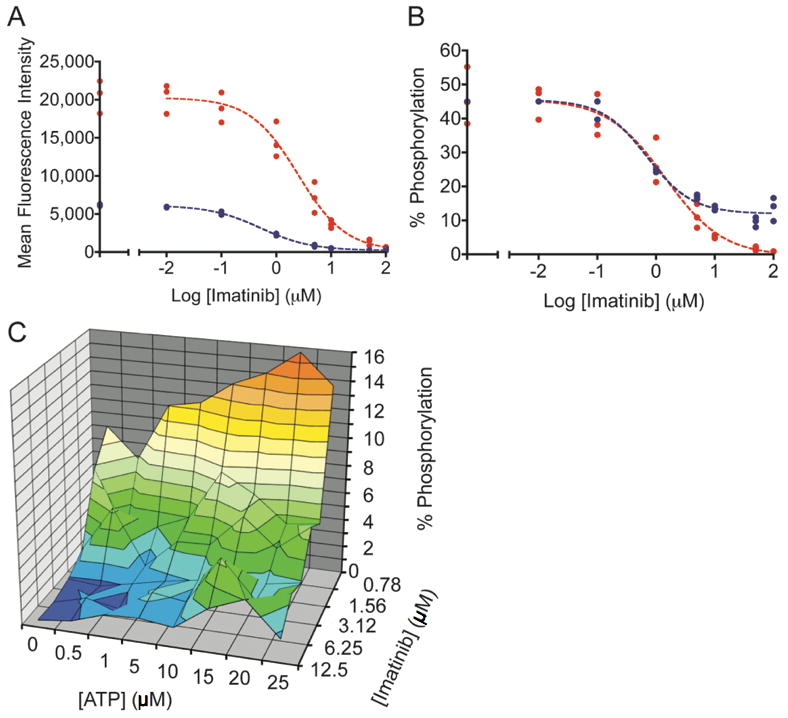
Imatinib was incubated with K-562 cells or cell lysates. The sigmoidal decrease in Abltide phosphorylation as a result of intracellular kinase inhibition was monitored in cell lysates using PY20-PE or biotinylated 4G10 and streptavidin-PE. A, a three-fold difference between maximum mean fluorescence intensities in separate assays obscures direct comparisons. In blue, PY20-PE was used to label phosphorylated Abltide following the inhibition of lysates with imatinib (IC50= 0.52 μM). In red, biotinylated 4G10 and streptavidin-PE were used to label phosphorylated Abltide following incubation with lysates derived from K-562 cells treated with imatinib in culture (IC50= 2.48 μM). B, well-specific internal standard curves automatically correct for differences in raw fluorescence intensity between assays and are used to calculate the percentage of Abltide phosphorylation in each well. The blue curve represents the phosphorylation of Abltide by lysates treated with imatinib (IC50= 0.70 μM). The red curve represents the phosphorylation of Abltide by lysates derived from cells treated with imatinib in culture (IC50= 1.40 μM). Differences between IC50 values in A and B are the result of data transformations by non-linear regression from well-specific internal standard curves. IC50 values are not directly comparable between separate experiments because inhibition was performed under different conditions in each case. C, multidimensional analysis of Abltide phosphorylation reveals competitive dependence for ATP and imatinib in K-562 lysates. Serial dilutions of ATP and imatinib were organized along perpendicular axes of one half of a 96-well plate and incubated with K-562 lysates, which were prepared at high concentrations and diluted 50-fold to reduce the influence of endogenous ATP. Apparent IC50 values increase with increasing concentrations of ATP, as shown by the heat map that highlights 1% increments of substrate phosphorylation from red (15-16% Abltide phosphorylation) to dark blue (0-1% Abltide phosphorylation).
To expand upon the influence of ATP during inhibition, we arranged an experimental format that enabled a multi-component analysis of the relative efficiency of imatinib in K-562 lysates. We simplified the calculation of ATP-relative inhibitor efficiency from a series of independent experiments by measuring the percentage of Abltide phosphorylation at a variety of ATP and imatinib concentrations (Figure 4C). Competitive with respect to ATP but not with respect to peptide, the concentration of imatinib required for complete inhibition of Bcr-Abl increased with increasing ATP.
To establish the limits of detection given small amounts of a potent inhibitor, we tested the second-generation inhibitor dasatinib and experimental pyridopyrimidine inhibitors PD166326, PD173955, and DV2-273 in cell lysates and cultured cells. Compared to imatinib these inhibitors demonstrated higher potency in lysates in agreement with previously published values (Figures 5A) (39, 41, 42). Compared to their activity in lysates, PD166326 and dasatinib demonstrated a significant increase in potency in cells (Figure 5B). These results were surprising although this increase in potency was observed in previous studies (18). Several factors may explain our results. Lysates from cells inhibited with PD166326 and dasatinib exhibited 10% lower maximal activity than lysates from cells treated with PD173955 and DV2-273 and compared to lysates treated directly with inhibitors. This lower initial activity may have reflected either incomplete lysis or a smaller population of cells per well, resulting in less Bcr-Abl per well and smaller apparent IC50 values. The steepness of the inhibition curves between 0.01 and 0.1 nM suggested a narrow range of sensitivity that was incompletely sampled, resulting in quantitative ambiguity within that defined range. By comparison, lysates from cells treated with PD173955 and DV2-273 displayed a well-sampled inhibition curve with an apparent 10-fold decrease in IC50 values compared to the inhibition of lysates. This drastic increase in apparent potency was not observed in cells treated with imatinib, although imatinib has a longer half-life in vivo and a smaller dissociation constant for Abl kinase in vitro (43, 44). This suggests that inhibition in cells under these conditions was affected by the small number of cells per well during treatment, intracellular accumulation of inhibitors, kinase active state to promote inhibitor binding, or was accomplished through multi-target effects (Supplementary Figure 4). Despite large differences in IC50 values between assays that were prepared under separate conditions, the ranking of relative inhibitor potencies remained consistent between assays using cells and lysates. This confirms the practical value of accurate comparisons using internal standard curves.
Figure 5.

Inhibition by dasatinib (orange), PD166326 (red), PD173955 (blue), and DV2-273 (green) was monitored in K-562 lysates. Sigmoidal inhibition curves were fit through biological triplicates. A, lysates prepared in bulk were treated with serial dilutions of inhibitors. Inhibition was monitored using Abltide, immobilized via its amino-terminus. Under these conditions, apparent IC50 values range from 75.7 nM (PD173955), 10.1 nM (DV2-273), 5.6 nM (dasatinib), to 3.4 nM (PD166326). B, populations of around 1 million confluent, serum-starved cells were distributed to each well of a sterile 96-well filter plate and treated with serial dilutions of inhibitors. Cells were lysed in-plate and lysates were used to phosphorylate Abltide. Under these conditions, apparent IC50 values range from 2.8 nM (PD173955), 1.7 nM (DV2-273), 0.03 nM (dasatinib), to 0.02 nM (PD166326). C, lysates prepared in bulk were treated with serial dilutions of inhibitors and monitored using Abltide in tandem with p40, arranged with Abltide distal to the immobilization site. Data were translated from raw fluorescence intensity to relative phosphorylation using internal standard curves constructed from synthetically phosphorylated Abltide. Under these conditions, apparent IC50 values range from 40.6 nM (DV2-273), 15.3 nM (PD166326), to 9.8 nM (dasatinib). Inhibition by PD173955 was not quantifiable.
To investigate the effects of assay sensitivity on apparent inhibitor potency, we tested PD166326, PD173955, dasatinib, and DV2-273 in lysates using the substrate Abltide in tandem with p40. Curves displayed steeper downward slopes compared to lysates tested using Abltide alone, reflecting increased sensitivity to changes in Bcr-Abl activity. Quantitation from internal standard curves allowed direct comparison against Abltide standards and the transformed data revealed differences in the responsiveness of the substrate to changes in kinase activity (Figure 5C). In tandem with p40, Abltide displayed residual phosphorylation at high inhibitor concentrations, suggesting increased affinity for Bcr-Abl. PD166326 and DV2-273 exhibit IC50 values that are 10-fold and 4-fold greater than assays using Abltide alone, while inhibition by PD173955 could not be quantitated because small changes in fluorescence intensity did not translate to a within the scale established by synthetic internal standards. It has not been determined whether the inhibition of Bcr-Abl is affected by interactions between the Abl SH3 domain with its immobilized ligand, p40. Nevertheless, this data suggest that the optimized substrate is a sensitive indicator of small differences in inhibitor concentrations.
Inhibitor screening with a multiplexed platform
To enable a more comprehensive analysis of Bcr-Abl inhibition in K-562 cell lysates, we expanded our basic method to include peptides that were previously used to report kinase activities in parallel pathways. Distinct beads bearing Abltide, Srctide, and a peptide derived from the tyrosine auto-phosphorylation site of Btk were combined in a single well to monitor the effects of imatinib and dasatinib in lysates. Substrate phosphorylation relative to internal Abltide standards was self-normalized on a scale of 0 – 100 based on peptide-specific minima and maxima to highlight relative differences between inhibition curves for each peptide substrate (Figures 6A). Prior to normalization, raw mean fluorescence intensities from the phosphorylation of Srctide and the peptide substrate derived from Btk were almost two orders of magnitude smaller than that observed for Abltide. This suggested that Bcr-Abl is a dominant kinase activity in K-562 lysates and demonstrated relative selectivity for Abltide under these conditions. A ten-fold window of selectivity distinguished the inhibition of Abltide phosphorylation by imatinib from the inhibition of phosphorylation at Srctide and the peptide substrate derived from Btk. Srctide and the peptide derived from Btk are routinely used to monitor the activities of kinases in the Src family and Btk, respectively. However, the narrowness of this selectivity window contrasts with published kinase-specific profiles for imatinib (45-47). The data suggested that we were not monitoring kinase-specific activity and inhibition with this multiplexed platform. Instead, we may have been detecting the combined effects of kinase activity and inhibition within a family or network, where multiple activities and protein interactions contribute to inhibitor response. Profiling substrate response with the multi-target inhibitor dasatinib revealed characteristic inhibition patterns and reflected previously published observations (48). Srctide was the most sensitive indicator of inhibition by dasatinib, as demonstrated by a steep inhibition curve. The peptide derived from Btk displayed the lowest detection limit for inhibition by dasatinib, with an IC50 value that was ten-fold lower than Abltide.
Figure 6.

Monitoring inhibition with imatinib and dasatinib using multiplexed substrates phosphorylated by K-562 cell lysates. Data acquired using Luminex beads were translated from raw fluorescence intensity to relative phosphorylation using internal standard curves. Transformed data were self-normalized according to the maxima and minima of each substrate. A, Abltide (red), Srctide (blue), and a peptide derived from the auto-phosphorylation site of Btk (green) were immobilized on Luminex beads and phosphorylated simultaneously by K-562 cell lysates. All reactions were performed in triplicate. Solid curves connecting round data points represent lysate inhibition by dasatinib (nM range), whereas dotted curves connecting square data points represent inhibition by imatinib (μM range). Apparent IC50 values for treated lysates are as follows: Abltide = 0.7 μM (imatinib), 2.2 nM (dasatinib); Srctide = 5.6 μM (imatinib), 1.1 nM (dasatinib); Btk autophosphorylation site = 0.8 μM (imatinib), 0.3 nM (dasatinb). B, The phosphorylation of Abltide (red) and peptides derived from native downstream substrates Crk (orange), CrkL (violet), and Stat5a (cyan) following inhibition with dasatinib (solid line) and imatinib (dotted line). Apparent IC50 values for treated lysates are as follows: Abltide = 0.8 μM (imatinib), 9 nM (dasatinib); Crk = 0.3 μM (imatinib), 5.8 nM (dasatinib); CrkL = 0.6 μM (imatinib), 6.5 nM (dasatinb); Stat5a = 0.6 μM (imatinib), 6.2 nM (dasatinb). C, Results were compared to multiplexed Western blots displaying the activation states of Bcr-Abl and Abl kinases, as well as the phosphorylation states of CrkL and Stat5, after lysate inhibition with imatinib and dasatinib. Digital image processing of marker densities was performed on a range of exposures of the same film. Only one exposure is displayed to demonstrate the significant range of output intensities per protein per gel. As a result of low dynamic range and working from a single set of data points from Western blots, sigmoidal inhibitory curves fit only the markers for phosphorylated Bcr-Abl and Abl. Therefore, only IC50 values for phospho-Bcr-Abl (imatinib 0.07 μM; dasatinib 17.3 nM) and phospho-Abl (imatinib 0.16 μM; dasatinib 11.3 nM) could be compared.
To monitor downstream phosphorylation resulting from Bcr-Abl activity, the assay was expanded to include peptides derived from Crk (23, 49-51), CrkL (24, 49, 52), and Stat5a (25, 26, 53). These peptides were immobilized on distinct Luminex beads and combined in a single well with Abltide-conjugated beads. The raw fluorescence intensity from the phosphorylation of Abltide was two orders of magnitude larger than that for substrates based on native phosphorylation sites. Following normalization, the data demonstrate that the phosphorylation of native substrates corresponds closely with the phosphorylation of Abltide (Figure 6B).
To compare our results to a commercially available Bcr-Abl activity assay, we tested a portion of the same samples using a multiplexed Western format (Figure 6C). The PathScan Bcr/Abl Activity Assay uses a cocktail of five horseradish peroxidase-linked antibodies to determine the phosphorylation state of Abl, Bcr-Abl, and two of its downstream effectors, Stat5 and CrkL (54). An antibody against the translation initiation factor eIF4e was included as an internal control to normalize against variable total protein loading for the purpose of relative quantitation. With a range of output intensities for different proteins, the PathScan multiplexed platform is limited by component antibody binding affinities, non-linear luminescent output, and the dynamic range obtainable from multiple film exposures. The difference in calculated IC50s between our bead-based assay and Western blot may be attributed in part to measurements of kinase activity versus activation state. Juxtaposed against inherent inaccuracies in relative quantitation by Western blot, the statistical confidence intervals with high sampling frequencies obtained from our bead-based activity assay provide an analytically robust platform for accurate comparisons.
Discussion
We developed a quantitative and multiplexed assay that is dependent on enzyme activity for signal accumulation to measure the sensitivity and specificity of clinically relevant kinase inhibitors. We established internal standard curves that correct for well-to-well variability and intrinsic non-linearity in labeling and detection. This enabled accurate measurements and facilitated comparisons between samples. Our analysis characterized the relationship between detector output and substrate phosphorylation and included quantitative confidence intervals based on the number of unique measurements within and between wells in a 96-well array as required for the t-distribution.
The Luminex platform of fluorescent polymeric microspheres was selected as the foundation for this method because it allows population-based statistical analysis of phosphorylation events with semi-soluble kinetics. Using a dedicated flow cytometer, the Luminex system can track up to 100 specific reactions per well while processing multiple conditions in 96-well plates. This is accomplished by a pair of lasers, one to excite internal red fluorescence for bead count and identification and the second to excite green fluorescence at the bead surface to measure analyte levels. Luminex bead arrays have been used to monitor the phosphorylation of multiple endogenous kinase substrates in cell lysates by immobilizing a different capture antibody on each bead color and detecting phosphorylation with a second phospho-specific antibody (55, 56). More direct queries of kinase activity are readily obtained by immobilizing substrates on beads, and routine applications using biotinylated peptide substrates on streptavidin-coated Luminex beads are straightforward (57).
Peptides used in the assay presented here have been validated by previous work and were selected based on their association with Bcr-Abl, either directly through activity-based phosphorylation or indirectly according to reported off-target effects of Bcr-Abl inhibitors. Previous work has shown that Bcr-Abl activity can be measured in cell lysates using the optimized synthetic peptide substrate Abltide immobilized on beads (52) or in acrylamide hydrogels (17). Native substrates, such as Crk and CrkL, as well as native downstream effectors such as Stat5a, have regularly been used to monitor Bcr-Abl activity in cell lysates (49, 54, 58). Expanding upon these methods, we covalently tethered Abltide and peptide substrates derived from Crk, CrkL and Stat5a on Luminex beads to monitor Bcr-Abl activity and inhibition in a multiplexed assay. Phosphorylation is detected in a single step by substrate recognition with a fluorescent anti-phosphotyrosine antibody. Similarly, the optimized synthetic substrate Srctide and a peptide substrate derived from the auto-phosphorylation site of Btk were used to profile differential inhibitor sensitivities. Although previously optimized and validated for efficiency and selectivity, peptide substrates may not report the activity of a single kinase. Nevertheless, differences in the response to inhibitors provide useful outlines of pathway activation.
A major challenge in monitoring the response to inhibitor-based therapies is the use of standardized methods that demonstrate minimal variation in assay values from run to run and maintain a common frame of reference from sample to sample (59). Most screening techniques rely on external standards and lack separate calibration for individual wells in an array. In general, quantitation is limited to rank order sorting with selective editing of outlier data points and the use of non-dimensional figures of merit (60). Given the challenges associated with standardizing reagents, the relative quantitation of changes between samples and between different laboratories is especially difficult. This is particularly notable for high-throughput screens developed in microtitre plates, where the organization of samples within plates and small variations between plates can lead to strong sample bias (61). To date, basic quantitation in kinase assays requires external standards for a combination of background subtraction resulting from non-specific interactions in complex samples and the calculation of proportions relative to a baseline (62).
Widely used in analytical chromatography, Western blots, quantitative PCR, and quantitative mass spectrometry, internal controls are especially useful for analyses in which the quantity and quality of sample varies from run to run for reasons that are difficult to control. An additional concern in multiplexed assays is the normalization of output contributions by various components of the reaction. For example, while multiplexed peptides are readily detected by mass spectrometry, the difference in ionization potential between phosphorylated and un-phosphorylated forms results in over-representation of one species over another (63). Here we report the use of reaction-specific internal standard curves to provide quantitative controls for well-to-well variability in labeling and detection. Fluorescence readout from bound anti-phosphotyrosine antibodies is converted to the percentage of substrate phosphorylation by non-linear regression from internal standard curves. Statistical analysis of sampled bead populations in combination with well-specific quantitation provides a sensitive platform for accurate measurements with high confidence.
This method may be helpful for defining sub-classifications of kinase activities that determine patient prognosis and for selecting appropriate therapies. In keeping with current experimental approaches that are aimed at describing large systems through the detailed analysis of component inter-relationships, this method is expandable for the quantitative analysis of network activity in a single experiment. This approach may prove particularly useful to accurately and sensitively monitor patient response to individualized cocktails of kinase inhibitors that modulate the activity of several key pathways.
Supplementary Material
Acknowledgments
This work was funded in part by NIH grants CA103235, HG003864, and GM074691. J.E.S. was supported by an American Heart Association Midwest Affiliate predoctoral fellowship. S.J.K. was a Leukemia and Lymphoma Society Scholar. We thank D.R. Veach and B. Clarkson for providing PD166326, PD173955, and DV2-273, A.J. Minn for the use of his Bioplex 200, Luminex Inc. for providing bead array reagents, and W.J. Rhee and M. Mand for the synthesis of peptide substrates. We also thank M. Mand for assistance in the preparation of lysates in-plate.
References
- 1.Tefferi A, Vardiman JW. Classification and diagnosis of myeloproliferative neoplasms: the 2008 World Health Organization criteria and point-of-care diagnostic algorithms. Leukemia. 2008;22:14–22. doi: 10.1038/sj.leu.2404955. [DOI] [PubMed] [Google Scholar]
- 2.Gorre ME, Mohammed M, Ellwood K, et al. Clinical resistance to STI-571 cancer therapy caused by BCR-ABL gene mutation or amplification. Science. 2001;293:876–80. doi: 10.1126/science.1062538. [DOI] [PubMed] [Google Scholar]
- 3.Azam M, Latek RR, Daley GQ. Mechanisms of autoinhibition and STI-571/imatinib resistance revealed by mutagenesis of BCR-ABL. Cell. 2003;112:831–43. doi: 10.1016/s0092-8674(03)00190-9. [DOI] [PubMed] [Google Scholar]
- 4.Donato NJ, Wu JY, Stapley J, et al. BCR-ABL independence and LYN kinase overexpression in chronic myelogenous leukemia cells selected for resistance to STI571. Blood. 2003;101:690–8. doi: 10.1182/blood.V101.2.690. [DOI] [PubMed] [Google Scholar]
- 5.Faderl S, Talpaz M, Estrov Z, O'Brien S, Kurzrock R, Kantarjian HM. The biology of chronic myeloid leukemia. N Engl J Med. 1999;341:164–72. doi: 10.1056/NEJM199907153410306. [DOI] [PubMed] [Google Scholar]
- 6.Sebolt-Leopold JS, English JM. Mechanisms of drug inhibition of signalling molecules. Nature. 2006;441:457–62. doi: 10.1038/nature04874. [DOI] [PubMed] [Google Scholar]
- 7.Dancey J, Sausville EA. Issues and progress with protein kinase inhibitors for cancer treatment. Nat Rev Drug Discov. 2003;2:296–313. doi: 10.1038/nrd1066. [DOI] [PubMed] [Google Scholar]
- 8.Radich JP, Dai H, Mao M, et al. Gene expression changes associated with progression and response in chronic myeloid leukemia. Proc Natl Acad Sci U S A. 2006;103:2794–9. doi: 10.1073/pnas.0510423103. [DOI] [PMC free article] [PubMed] [Google Scholar]
- 9.White D, Saunders V, Lyons AB, et al. In vitro sensitivity to imatinib-induced inhibition of ABL kinase activity is predictive of molecular response in patients with de novo CML. Blood. 2005;106:2520–6. doi: 10.1182/blood-2005-03-1103. [DOI] [PubMed] [Google Scholar]
- 10.Reimer U, Reineke U, Schneider-Mergener J. Peptide arrays: from macro to micro. Curr Opin Biotechnol. 2002;13:315–20. doi: 10.1016/s0958-1669(02)00339-7. [DOI] [PubMed] [Google Scholar]
- 11.Houseman BT, Huh JH, Kron SJ, Mrksich M. Peptide chips for the quantitative evaluation of protein kinase activity. Nat Biotechnol. 2002;20:270–4. doi: 10.1038/nbt0302-270. [DOI] [PubMed] [Google Scholar]
- 12.Janes KA, Albeck JG, Peng LX, Sorger PK, Lauffenburger DA, Yaffe MB. A high-throughput quantitative multiplex kinase assay for monitoring information flow in signaling networks: application to sepsis-apoptosis. Mol Cell Proteomics. 2003;2:463–73. doi: 10.1074/mcp.M300045-MCP200. [DOI] [PubMed] [Google Scholar]
- 13.Diks SH, Kok K, O'Toole T, et al. Kinome profiling for studying lipopolysaccharide signal transduction in human peripheral blood mononuclear cells. J Biol Chem. 2004;279:49206–13. doi: 10.1074/jbc.M405028200. [DOI] [PubMed] [Google Scholar]
- 14.Shults MD, Kozlov IA, Nelson N, et al. A multiplexed protein kinase assay. Chembiochem. 2007;8:933–42. doi: 10.1002/cbic.200600522. [DOI] [PubMed] [Google Scholar]
- 15.Kubota K, Anjum R, Yu Y, et al. Sensitive multiplexed analysis of kinase activities and activity-based kinase identification. Nat Biotechnol. 2009;27:933–40. doi: 10.1038/nbt.1566. [DOI] [PMC free article] [PubMed] [Google Scholar]
- 16.Versele M, Talloen W, Rockx C, et al. Response prediction to a multitargeted kinase inhibitor in cancer cell lines and xenograft tumors using high-content tyrosine peptide arrays with a kinetic readout. Mol Cancer Ther. 2009;8:1846–55. doi: 10.1158/1535-7163.MCT-08-1029. [DOI] [PubMed] [Google Scholar]
- 17.Wu D, Mand MR, Veach DR, Parker LL, Clarkson B, Kron SJ. A solid-phase Bcr-Abl kinase assay in 96-well hydrogel plates. Anal Biochem. 2008;375:18–26. doi: 10.1016/j.ab.2007.12.023. [DOI] [PMC free article] [PubMed] [Google Scholar]
- 18.Mand MR, Wu D, Veach DR, Kron SJ. Cell treatment and lysis in 96 well filter-bottom plates for screening Bcr-Abl activity and inhibition in whole cell extracts. Journal of Biomolecular Screening. 2010 doi: 10.1177/1087057110363307. In press. [DOI] [PMC free article] [PubMed] [Google Scholar]
- 19.Songyang Z, Carraway KL, 3rd, Eck MJ, et al. Catalytic specificity of protein-tyrosine kinases is critical for selective signalling. Nature. 1995;373:536–9. doi: 10.1038/373536a0. [DOI] [PubMed] [Google Scholar]
- 20.Pisabarro MT, Serrano L. Rational design of specific high-affinity peptide ligands for the Abl-SH3 domain. Biochemistry. 1996;35:10634–40. doi: 10.1021/bi960203t. [DOI] [PubMed] [Google Scholar]
- 21.Bence K, Ma W, Kozasa T, Huang XY. Direct stimulation of Bruton's tyrosine kinase by G(q)-protein alpha-subunit. Nature. 1997;389:296–9. doi: 10.1038/38520. [DOI] [PubMed] [Google Scholar]
- 22.Yamadori T, Baba Y, Matsushita M, et al. Bruton's tyrosine kinase activity is negatively regulated by Sab, the Btk-SH3 domain-binding protein. Proc Natl Acad Sci U S A. 1999;96:6341–6. doi: 10.1073/pnas.96.11.6341. [DOI] [PMC free article] [PubMed] [Google Scholar]
- 23.Donaldson LW, Gish G, Pawson T, Kay LE, Forman-Kay JD. Structure of a regulatory complex involving the Abl SH3 domain, the Crk SH2 domain, and a Crk-derived phosphopeptide. Proc Natl Acad Sci U S A. 2002;99:14053–8. doi: 10.1073/pnas.212518799. [DOI] [PMC free article] [PubMed] [Google Scholar]
- 24.de Jong R, ten Hoeve J, Heisterkamp N, Groffen J. Tyrosine 207 in CRKL is the BCR/ABL phosphorylation site. Oncogene. 1997;14:507–13. doi: 10.1038/sj.onc.1200885. [DOI] [PubMed] [Google Scholar]
- 25.Gouilleux F, Wakao H, Mundt M, Groner B. Prolactin induces phosphorylation of Tyr694 of Stat5 (MGF), a prerequisite for DNA binding and induction of transcription. EMBO J. 1994;13:4361–9. doi: 10.1002/j.1460-2075.1994.tb06756.x. [DOI] [PMC free article] [PubMed] [Google Scholar]
- 26.Okutani Y, Kitanaka A, Tanaka T, et al. Src directly tyrosine-phosphorylates STAT5 on its activation site and is involved in erythropoietin-induced signaling pathway. Oncogene. 2001;20:6643–50. doi: 10.1038/sj.onc.1204807. [DOI] [PubMed] [Google Scholar]
- 27.Giavedoni LD. Simultaneous detection of multiple cytokines and chemokines from nonhuman primates using luminex technology. J Immunol Methods. 2005;301:89–101. doi: 10.1016/j.jim.2005.03.015. [DOI] [PubMed] [Google Scholar]
- 28.Snedecor GW, Cochran WG. Statistical methods. 8. Ames: Iowa State University Press; 1989. [Google Scholar]
- 29.Huntsberger DV, Billingsley P. Elements of statistical inference. 6. Boston: Allyn and Bacon; 1987. [Google Scholar]
- 30.Owen DB. The power of student's t-test. J Amer Stat Assoc. 1965;60:320–33. [Google Scholar]
- 31.Federighi ET. Extended tables of the percentage points of student's t-distribution. J Amer Stat Assoc. 1959;68:683–91. [Google Scholar]
- 32.Gutierrez OA, Chavez M, Lissi E. A theoretical approach to some analytical properties of heterogeneous enzymatic assays. Anal Chem. 2004;76:2664–8. doi: 10.1021/ac049885d. [DOI] [PubMed] [Google Scholar]
- 33.Martins TB. Development of internal controls for the Luminex instrument as part of a multiplex seven-analyte viral respiratory antibody profile. Clin Diagn Lab Immunol. 2002;9:41–5. doi: 10.1128/CDLI.9.1.41-45.2002. [DOI] [PMC free article] [PubMed] [Google Scholar]
- 34.Hanley B. Variance in multiplex suspension array assays: intraplex method improves reliability. Theor Biol Med Model. 2007;4:32. doi: 10.1186/1742-4682-4-32. [DOI] [PMC free article] [PubMed] [Google Scholar]
- 35.Wu D, Sylvester JE, Parker LL, Zhou G, Kron SJ. Peptide reporters of kinase activity in whole cell lysates. Peptide Science. 2010 doi: 10.1002/bip.21401. In press. [DOI] [PMC free article] [PubMed] [Google Scholar]
- 36.Parker LL, Brueggemeier SB, Rhee WJ, et al. Photocleavable peptide hydrogel arrays for MALDI-TOF analysis of kinase activity. Analyst. 2006;131:1097–104. doi: 10.1039/b607180e. [DOI] [PubMed] [Google Scholar]
- 37.Druker BJ, Tamura S, Buchdunger E, et al. Effects of a selective inhibitor of the Abl tyrosine kinase on the growth of Bcr-Abl positive cells. Nat Med. 1996;2:561–6. doi: 10.1038/nm0596-561. [DOI] [PubMed] [Google Scholar]
- 38.Lombardo LJ, Lee FY, Chen P, et al. Discovery of N-(2-chloro-6-methyl- phenyl)-2-(6-(4-(2-hydroxyethyl)- piperazin-1-yl)-2-methylpyrimidin-4- ylamino)thiazole-5-carboxamide (BMS-354825), a dual Src/Abl kinase inhibitor with potent antitumor activity in preclinical assays. J Med Chem. 2004;47:6658–61. doi: 10.1021/jm049486a. [DOI] [PubMed] [Google Scholar]
- 39.Wisniewski D, Lambek CL, Liu C, et al. Characterization of potent inhibitors of the Bcr-Abl and the c-kit receptor tyrosine kinases. Cancer Res. 2002;62:4244–55. [PubMed] [Google Scholar]
- 40.Thomas J, Wang L, Clark RE, Pirmohamed M. Active transport of imatinib into and out of cells: implications for drug resistance. Blood. 2004;104:3739–45. doi: 10.1182/blood-2003-12-4276. [DOI] [PubMed] [Google Scholar]
- 41.von Bubnoff N, Veach DR, Miller WT, et al. Inhibition of wild-type and mutant Bcr-Abl by pyridopyrimidine-type small molecule kinase inhibitors. Cancer Res. 2003;63:6395–404. [PubMed] [Google Scholar]
- 42.Tipping AJ, Baluch S, Barnes DJ, et al. Efficacy of dual-specific Bcr-Abl and Src-family kinase inhibitors in cells sensitive and resistant to imatinib mesylate. Leukemia. 2004;18:1352–6. doi: 10.1038/sj.leu.2403416. [DOI] [PubMed] [Google Scholar]
- 43.Shah NP, Kasap C, Weier C, et al. Transient potent BCR-ABL inhibition is sufficient to commit chronic myeloid leukemia cells irreversibly to apoptosis. Cancer Cell. 2008;14:485–93. doi: 10.1016/j.ccr.2008.11.001. [DOI] [PubMed] [Google Scholar]
- 44.Seeliger MA, Nagar B, Frank F, Cao X, Henderson MN, Kuriyan J. c-Src binds to the cancer drug imatinib with an inactive Abl/c-Kit conformation and a distributed thermodynamic penalty. Structure. 2007;15:299–311. doi: 10.1016/j.str.2007.01.015. [DOI] [PubMed] [Google Scholar]
- 45.Bantscheff M, Eberhard D, Abraham Y, et al. Quantitative chemical proteomics reveals mechanisms of action of clinical ABL kinase inhibitors. Nature Biotechnol. 2007;25:1035–44. doi: 10.1038/nbt1328. [DOI] [PubMed] [Google Scholar]
- 46.Fabian MA, Biggs WH, 3rd, Treiber DK, et al. A small molecule-kinase interaction map for clinical kinase inhibitors. Nat Biotechnol. 2005;23:329–36. doi: 10.1038/nbt1068. [DOI] [PubMed] [Google Scholar]
- 47.Karaman MW, Herrgard S, Treiber DK, et al. A quantitative analysis of kinase inhibitor selectivity. Nature Biotechnol. 2008;26:127–32. doi: 10.1038/nbt1358. [DOI] [PubMed] [Google Scholar]
- 48.Hantschel O, Rix U, Superti-Furga G. Target spectrum of the BCR-ABL inhibitors imatinib, nilotinib and dasatinib. Leuk Lymphoma. 2008;49:615–9. doi: 10.1080/10428190801896103. [DOI] [PubMed] [Google Scholar]
- 49.Feller SM, Posern G, Voss J, et al. Physiological signals and oncogenesis mediated through Crk family adapter proteins. J Cell Physiol. 1998;177:535–52. doi: 10.1002/(SICI)1097-4652(199812)177:4<535::AID-JCP5>3.0.CO;2-E. [DOI] [PubMed] [Google Scholar]
- 50.Amoui M, Miller WT. The substrate specificity of the catalytic domain of Abl plays an important role in directing phosphorylation of the adaptor protein Crk. Cell Signal. 2000;12:637–43. doi: 10.1016/s0898-6568(00)00107-8. [DOI] [PubMed] [Google Scholar]
- 51.Kain KH, Gooch S, Klemke RL. Cytoplasmic c-Abl provides a molecular ‘Rheostat’ controlling carcinoma cell survival and invasion. Oncogene. 2003;22:6071–80. doi: 10.1038/sj.onc.1206930. [DOI] [PubMed] [Google Scholar]
- 52.Wu D, Nair-Gill E, Sher DA, et al. Assaying Bcr-Abl kinase activity and inhibition in whole cell extracts by phosphorylation of substrates immobilized on agarose beads. Anal Biochem. 2005;347:67–76. doi: 10.1016/j.ab.2005.09.001. [DOI] [PMC free article] [PubMed] [Google Scholar]
- 53.Saharinen P, Vihinen M, Silvennoinen O. Autoinhibition of Jak2 tyrosine kinase is dependent on specific regions in its pseudokinase domain. Mol Biol Cell. 2003;14:1448–59. doi: 10.1091/mbc.E02-06-0342. [DOI] [PMC free article] [PubMed] [Google Scholar]
- 54.O'Hare T, Pollock R, Stoffregen EP, et al. Inhibition of wild-type and mutant Bcr-Abl by AP23464, a potent ATP-based oncogenic protein kinase inhibitor: implications for CML. Blood. 2004;104:2532–9. doi: 10.1182/blood-2004-05-1851. [DOI] [PubMed] [Google Scholar]
- 55.Rauh-Adelmann C, Moskow JM, Graham JR, et al. Quantitative measurement of epidermal growth factor receptor-mitogen-activated protein kinase signal transduction using a nine-plex, peptide-based immunoassay. Anal Biochem. 2008;375:255–64. doi: 10.1016/j.ab.2007.12.038. [DOI] [PubMed] [Google Scholar]
- 56.Du J, Bernasconi P, Clauser KR, et al. Bead-based profiling of tyrosine kinase phosphorylation identifies SRC as a potential target for glioblastoma therapy. Nat Biotechnol. 2009;27:77–83. doi: 10.1038/nbt.1513. [DOI] [PMC free article] [PubMed] [Google Scholar]
- 57.Bernsteel DJ, Roman DL, Neubig RR. In vitro protein kinase activity measurement by flow cytometry. Anal Biochem. 2008;383:180–5. doi: 10.1016/j.ab.2008.08.026. [DOI] [PubMed] [Google Scholar]
- 58.Jilani I, Kantarjian H, Gorre M, et al. Phosphorylation levels of BCR-ABL, CrkL, AKT and STAT5 in imatinib-resistant chronic myeloid leukemia cells implicate alternative pathway usage as a survival strategy. Leuk Res. 2008;32:643–9. doi: 10.1016/j.leukres.2007.08.009. [DOI] [PubMed] [Google Scholar]
- 59.Hughes TP, Branford S. Monitoring disease response to tyrosine kinase inhibitor therapy in CML. Hematology Am Soc Hematol Educ Program. 2009:477–87. doi: 10.1182/asheducation-2009.1.477. [DOI] [PubMed] [Google Scholar]
- 60.Zhang JH, Chung TD, Oldenburg KR. A Simple Statistical Parameter for Use in Evaluation and Validation of High Throughput Screening Assays. J Biomol Screen. 1999;4:67–73. doi: 10.1177/108705719900400206. [DOI] [PubMed] [Google Scholar]
- 61.Koren A, Tirosh I, Barkai N. Autocorrelation analysis reveals widespread spatial biases in microarray experiments. BMC Genomics. 2007;8:164. doi: 10.1186/1471-2164-8-164. [DOI] [PMC free article] [PubMed] [Google Scholar]
- 62.Xiaoming H, Syuhei S, Takayuki Y, et al. A quantitative peptide array for evaluation of protein kinase activity. Anal Biochem. 2008;372:106–15. doi: 10.1016/j.ab.2007.09.026. [DOI] [PubMed] [Google Scholar]
- 63.Busman M, Schey KL, Knapp DR. Identification of the phosphorylation sites in phosphopeptides by positive and negative mode electrospray ionization-tandem mass spectrometry. J Amer Soc Mass Spectrometry. 1996;7:243–9. doi: 10.1016/1044-0305(95)00675-3. [DOI] [PubMed] [Google Scholar]
Associated Data
This section collects any data citations, data availability statements, or supplementary materials included in this article.