Abstract
Although the receiver operating characteristic (ROC) method is the acknowledged gold-standard for imaging system assessment, it ignores localisation information and differentiation between multiple abnormalities per case. As the free-response ROC (FROC) method uses localisation information and more closely resembles the clinical reporting process, it is being increasingly used. A number of methods have been proposed to analyse the data that result from an FROC study: jackknife alternative FROC (JAFROC) and a variant termed JAFROC1, initial detection and candidate analysis (IDCA) and ROC analysis via the reduction of the multiple ratings on a case to a single rating. The focus of this paper was to compare JAFROC1, IDCA and the ROC analysis methods using a clinical FROC human data set. All methods agreed on the ordering of the modalities and all yielded statistically significant differences of the figures-of-merit, i.e. p < 0.05. Both IDCA and JAFROC1 yielded much smaller p-values than ROC. The results are consistent with a recent simulation-based validation study comparing these and other methods. In conclusion, IDCA or JAFROC1 analysis of FROC human data may be superior at detecting modality differences than ROC analysis.
INTRODUCTION
Observer performance studies are used for comparison of diagnostic accuracy of imaging systems. Receiver operating characteristic (ROC) analysis is the most common tool for quantitative evaluation of observer performance and imaging systems. It applies to binary tasks, in which the observer assigns each case to one of two classes, normal or abnormal(1). Since most clinical tasks involve localisation of disease, efforts are underway to develop generalisations of the ROC method that include the localisation factor(2–7). The free-response operating characteristic (FROC) paradigm applies to situations in which each image contains either no lesion or any number of lesions and the observer's task is to search, detect and locate each lesion that is present. The unit of FROC data is a mark-rating pair, where a mark refers to the physical location of a suspicious region and the rating is a number representing the confidence level that the marked region is actually a lesion. Ideally, the analysis of FROC data should use all data available, taking into account dependencies between ratings observed on the same image; in this way, the highest statistical power can be achieved. A recent jackknife alternative FROC (JAFROC) method and a variant termed JAFROC1 have become available to analyse FROC data that do not make independent assumptions and have been validated with simulators that have included strong correlations between the ratings(8, 9).
Another approach to analyse location-specific data has been proposed, namely the initial detection and candidate analysis (IDCA) method(6). Of course, ROC analysis of FROC data is also possible (inferred ROC analysis).
Since patients benefit from better assessment methodology, which allows more precise and objective equipment selection, investigation about the different analytical methods is important. A simulation study comparing JAFROC1, IDCA and ROC showed that the statistical powers were ordered as: JAFROC1 > IDCA > ROC for human observers(10). However, these results have not been confirmed by clinical FROC studies. For this reason, the goal of this work was to compare JAFROC1, IDCA and ROC methods on a clinical data set of FROC data.
METHODS
Data set
Human observer FROC data from a previous study(11) was used. The observer's task had been to localise simulated clusters of microcalcifications in 200 cranio-caudal digital mammograms, half of which were normal. All images were processed two times using the commercially available image processing algorithms OPView v2 (Modality 1) and OPView v1 (Modality 2) (Siemens, Erlangen, Germany). Three breast imaging radiologists located regions suspicious for the simulated clusters and rated them using a five-point rating scale.
Statistical analysis
The investigated methods for the statistical analysis are the JAFROC1 method, the IDCA method and the ROC method. The difference between these methods is the definition of the figure-of-merit (FoM) used to quantify image quality (described in next subparagraphs). All methods (JAFROC1, IDCA and ROC) analyse the ratings using the Dorfman–Berbaum–Metz (DBM) approach(12), originally developed for multi-reader, multi-case ROC analysis. This technique involves an analysis of variance (ANOVA) of a transformation of the observed data, computed by the Quenouille-Tukey(13, 14) version of the jackknife. Jackknifing is a re-sampling technique used in statistical inference to estimate the standard error in a statistic of interest (the FoM in this case, for example, the area under the ROC curve for ROC analysis). The basic idea behind the jackknife estimator lies in systematically re-computing the statistic estimate leaving out one observation unit (each image in this case) at a time from the sample set. In the Quenouille-Tukey method, an estimated statistic that is obtained in this way is called a ‘pseudovalue’. The jackknife method is applied to the data of each reader separately, originating a matrix for all readers and one modality. The jackknife estimate of the statistic is calculated for each modality separately by the mean of the pseudovalues, and the standard error by the standard error of the mean of the pseudovalues. The reason why a method developed for ROC analysis can be applied to FROC data is that the DBM–ANOVA model applies to any FoM, e.g. the area under the ROC curve, sensitivity at a fixed specificity etc., and JAFROC1 or IDCA can be regarded as simply providing another FoM which also accounts for localisation information. Since each image is characterised by a single pseudovalue to which all mark-rating pairs of the considered case contribute, the analysis makes no independent assumptions(10).
Jackknife alternative FROC1 analysis
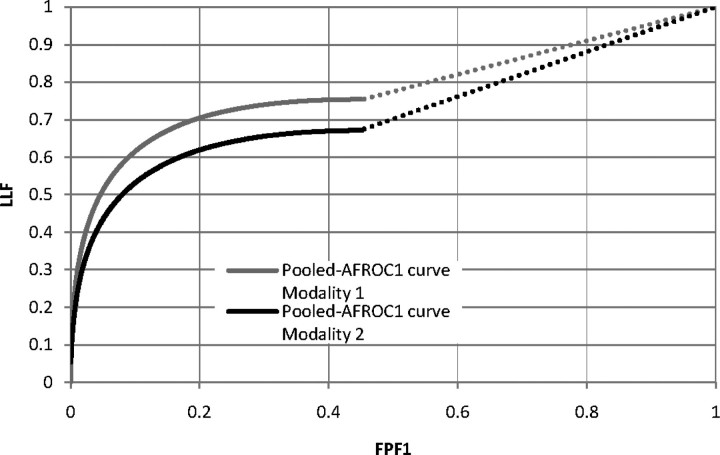
The JAFROC1 FoM is the area under the alternative free-response receiver operating characteristic (AFROC1) curve(2, 15). The AFROC1 curve is defined as the plot of lesion localisation fraction (LLF) along the y-axis versus the false-positive (FP) fraction (FPF1) along the x-axis. The LLF is defined as the fraction of true-positive (TP) decisions with correct localisation; the FPF1 is defined as the fraction of FP decisions. To calculate the FPF1 from FROC data, the highest rated FP event on each image (normal and abnormal) is used as the equivalent single ‘ROC’ rating for that image, and all other FP responses on that image are neglected. This plot is constrained to lie within the unit square. Note that as in ROC abnormal images cannot yield FPs, FPF1 can only be defined in the free-response context since it is computed over both normal and abnormal images.
Initial detection and candidate analysis
The IDCA method was developed for analysing computer-aided detection data(6, 16, 17). In this study, it was applied to human observer data to calculate an FoM.
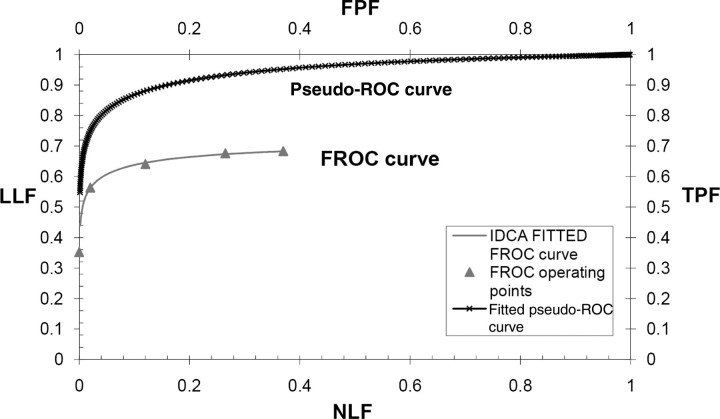
The IDCA FoM used in this work is the area under the FROC curve to the left of a specified value non-lesion localisation fraction (NLF) = γ(AUFCγ). The FROC curve is defined as the plot of LLF along the y-axis versus the mean number of FPs per image (NLF) along the x-axis. The value γ was chosen as the highest NLF for the most conservative reader (the one with the lowest number of FPs), divided by 1.2 (this value was determined empirically to ensure that none of the jackknifes yielded a highest NLF value smaller than the chosen γ value). The IDCA method is based on fitting the ratings of lesions and non-lesions localisation to a pseudo-ROC curve, by considering each score as arising from an image that can be normal or abnormal, depending on the score being a TP or an FP. The pseudo-ROC curve is then scaled to obtain the fitted FROC curve. The mapping operation to scale the curve consists of a point-by-point multiplication of the (x,y) coordinates of each point of the pseudo-ROC curve by the (x,y) coordinates of the observed end-point of the FROC curve (Figure 1). The end-point of the FROC curve corresponds to all marks rated above the lowest threshold (equal to 1); as it includes all FPs for the reader on all normal images, it corresponds to the highest value of NLF. In this study, the pseudo-ROC curve was fitted using the binormal model algorithm ROCFIT(18).
Figure 1.
Example of the IDCA approach to fit FROC operating points. IDCA regards the TPs and FPs counts as arising from normal and abnormal ‘cases’ in a pseudo-ROC study. The counts are analysed by conventional ROC curve-fitting software yielding the fitted upper curve (bold). The FROC curve, shown in the lower part of the graph, is obtained by a mapping operation, consisting of a point-by-point multiplication of the pseudo-ROC curve with a scaling factor.
ROC analysis
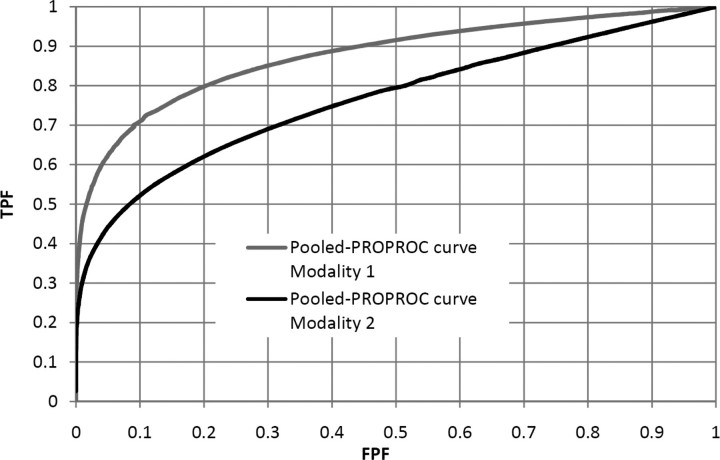
For ROC analysis, the overall image rating was assumed to be the rating of the highest rated mark on the image, which could be associated with an actually positive or actually negative finding. As FoM, the area under the ROC curve defined by these ratings was calculated using PROPROC(19). The ROC curve is defined as the plot TP fraction (TPF) versus FPF.
RESULTS
Figure 1 shows that IDCA yields an excellent fit for human observer data also. Table 1 shows the F-statistics, with numerator and denominator degrees of freedom, and the p-values calculated, respectively, for JAFROC1, IDCA and ROC methods. Figures 2 and 3 represent the AFROC and PROPROC curves, respectively, averaged over the readers. The AFROC end point is connected to (1,1) with a dotted line, as the FoM used for JAFROC1 analysis is the area under the complete curve.
Table 1.
F-statistics and p-values calculated for each statistical analysis.
| Statistical analysis | F-statistics, degree of freedom (numerator/denominator) | p-value |
|---|---|---|
| JAFROC1 | 16.60 (1/12.1) | 0.0011 |
| IDCA | 19.339 (1/15.4) | 0.0004 |
| ROC | 11.04 (1/5) | 0.0198 |
Figure 2.
This figure illustrates the pooled AFROC1 curves (JAFROC1 analysis) for Modalities 1 and 2, for the average reader.
Figure 3.
This figure illustrates the pooled PROPROC curves (ROC analysis) for Modalities 1 and 2, for the average reader.
DISCUSSION
We have applied three methods to analyse human observer FROC data. Figures 2 and 3 show that, for both pooled AFROC1 and PROPROC curves, performance is significantly higher for Modality 1. The FoM for all methods agreed on the ordering of the modalities and all yielded statistically significant differences, i.e. p < 0.05. While IDCA gave the smallest p-value (0.0004), JAFROC1 also gave a very small p-value (0.001), and the difference is easily explainable by sampling variability. In the upper tail of the F-distribution, a small change in F can cause a large relative change in p. The true power can only be determined using simulation methods; a simulation study in which FROC data for one reader and two modalities were generated using a search model(7) showed that JAFROC1 yielded substantially greater power than IDCA.
One expects IDCA and JAFROC1 to have higher statistical power than ROC. ROC analysis accepts only one score per case, while both IDCA and JAFROC1 take all marks into account. Also, in ROC analysis, where no localisation information is required, the rating on an abnormal image could be due to a non-lesion (NL) that is more suspicious than the lesion. This possibility leads to more noise in the measurement, as sometimes the lesion has the highest rating and sometimes an NL has the highest rating. The higher noise in the ROC measurement explains why even though the ROC curves are more clearly separated than the AFROC1 curves, the p-value is smaller for JAFROC1.
As the IDCA method uses more data than JAFROC1 (and obviously ROC), namely all marks on normal and abnormal images, one would expect that it achieves more statistical power than JAFROC1, which uses all marks for lesion-localisation but only the highest rated NL localisation on all images, normal and abnormal. On the other side, JAFROC1 assigns a rating to each and every normal image, even when the image contains no marks (in this case a default rating of −2000 is assigned; this rating contributes to the FoM). Likewise, unmarked lesions are assigned the default rating and the information that they went undetected is used: the fact that they are less suspicious than any marked lesion tends to decrease the FoM. This is not true for the IDCA method where only the marked regions are used for statistical analysis and the area AUFCγ under the FROC curve is relatively insensitive to the distribution of the marks between the cases.
CONCLUSION
In conclusion, IDCA or JAFROC1 analysis of FROC clinical data suggests superiority to ROC analysis.
FUNDING
D.P.C. was supported in part by grants from the Department of Health and Human Services, National Institutes of Health, R01-EB005243 and R01-EB008688. This work was in part supported also by the Mevic project. Mevic is an IBBT-project in cooperation with the following companies and organizations: Barco, Hologic, Philips, University Hospital Leuven, University of Gent MEDISIP/IPI, Free University of Brussels ETRO. IBBT is an independent multi-disciplinary research institute founded by the Flemish government to stimulate ICT innovation.
ACKNOWLEDGEMENTS
The authors are grateful to Hong-Jun Yoon for implementation of the JAFROC and IDCA software and also thank Jurgen Jacobs for the software used for collecting FROC data in the observer performance experiment. Thanks are due to Valerie Celis, Filip Claus and Chantal Van Ongeval for serving as observers.
REFERENCES
- 1.Metz C. E. Receiver operating characteristic analysis: a tool for the quantitative evaluation of observer performance and imaging systems. J. Am. Coll. Radiol. 2006;3:413–422. doi: 10.1016/j.jacr.2006.02.021. [DOI] [PubMed] [Google Scholar]
- 2.Chakraborty D. P., Winter L. H. Free-response methodology: alternate analysis and a new observer—performance experiment. Radiology. 1990;174:873–881. doi: 10.1148/radiology.174.3.2305073. [DOI] [PubMed] [Google Scholar]
- 3.Chakraborty D. P. Statistical power in observer—performance studies: comparison of the receiver operating characteristic and free-response methods in tasks involving localization. Acad. Radiol. 2002;9:147–156. doi: 10.1016/s1076-6332(03)80164-2. [DOI] [PubMed] [Google Scholar]
- 4.Chakraborty D. P., Berbaum K. S. Observer studies involving detection and localization: modeling, analysis, and validation. Med. Phys. 2004;31:2313–2330. doi: 10.1118/1.1769352. [DOI] [PubMed] [Google Scholar]
- 5.Swensson R. G. Unified measurement of observer performance in detecting and localizing target objects on images. Med. Phys. 1996;23:1709–1725. doi: 10.1118/1.597758. [DOI] [PubMed] [Google Scholar]
- 6.Edwards D. C., Kupinski M. A., Metz C. E., Nishikawa R. M. Maximum likelihood fitting of FROC curves under an initial-detection-and-candidate-analysis model. Med. Phys. 2002;29:2861–2870. doi: 10.1118/1.1524631. [DOI] [PubMed] [Google Scholar]
- 7.Chakraborty D. P. A search model and figure of merit for observer data acquired according to the free-response paradigm. Phys. Med. Biol. 2006;51:3449–3462. doi: 10.1088/0031-9155/51/14/012. [DOI] [PMC free article] [PubMed] [Google Scholar]
- 8.Chakraborty D. P. Analysis of location specific observer performance data: validated extensions of the jackknife free-response (JAFROC) method. Acad. Radiol. 2006;13:1187–1193. doi: 10.1016/j.acra.2006.06.016. [DOI] [PubMed] [Google Scholar]
- 9.Chakraborty D. P., Yoon H. J., Mello-Thoms C. Spatial localization accuracy of radiologists in free-response studies: inferring perceptual FROC curves from mark-rating data. Acad. Radiol. 2007;14:4–18. doi: 10.1016/j.acra.2006.10.015. [DOI] [PMC free article] [PubMed] [Google Scholar]
- 10.Chakraborty D. P. Validation and statistical power comparison of methods for analyzing free-response observer performance studies. Acad. Radiol. 2008;15:1554–1566. doi: 10.1016/j.acra.2008.07.018. [DOI] [PMC free article] [PubMed] [Google Scholar]
- 11.Zanca F., Jacobs J., Van Ongeval C., Claus F., Celis V., Geniets C., Provost V., Pauwels H., Marchal G., Bosmans H. Evaluation of clinical image processing algorithms used in digital mammography. Med. Phys. 2008;36:765–775. doi: 10.1118/1.3077121. [DOI] [PubMed] [Google Scholar]
- 12.Dorfman D. D., Berbaum K. S., Metz C. E. Receiver operating characteristic rating analysis. Generalization to the population of readers and patients with the jackknife method. Invest. Radiol. 1992;27:723–731. [PubMed] [Google Scholar]
- 13.Quenouille M. H. Note on the elimination of insignificant variates in discriminatory analysis. Ann. Eugen. 1949;14:305–308. doi: 10.1111/j.1469-1809.1947.tb02408.x. [DOI] [PubMed] [Google Scholar]
- 14.Tukey J. W. Bias and confidence in not-quite large samples. Ann. Math. Stat. 1958;29:614. [Google Scholar]
- 15.Chakraborty D. P. Maximum likelihood analysis of free-response receiver operating characteristic (FROC) data. Med. Phys. 1989;16:561–568. doi: 10.1118/1.596358. [DOI] [PubMed] [Google Scholar]
- 16.Yoon H. J., Zheng B., Sahiner B., Chakraborty D. P. Evaluating computer-aided detection algorithms. Med. Phys. 2007;34:2024–2038. doi: 10.1118/1.2736289. [DOI] [PMC free article] [PubMed] [Google Scholar]
- 17.Chakraborty D. P., Yoon H. J . Investigation of methods for analyzing location specific observer performance data. Proc. SPIE. 2008;6917 69170C.1–69170C.12. [Google Scholar]
- 18.Metz C. E., Herman B. A., Shen J. H. Maximum likelihood estimation of receiver operating characteristic (ROC) curves from continuously-distributed data. Stat. Med. 1998;17:1033–1053. doi: 10.1002/(sici)1097-0258(19980515)17:9<1033::aid-sim784>3.0.co;2-z. [DOI] [PubMed] [Google Scholar]
- 19.Dorfman D. D., Berbaum K. S., Metz C. E., Lenth R. V., Hanley J. A., Abu Dagga H. Proper receiver operating characteristic analysis: the bigamma model. Acad. Radiol. 1997;4:138–149. doi: 10.1016/s1076-6332(97)80013-x. [DOI] [PubMed] [Google Scholar]


