Abstract
Since the early 1990's the Developmental Therapeutics Program (DTP) of the National Cancer Institute (NCI) has utilized a panel of 60 human tumor cell lines representing 9 tissue types to screen for potential new anti-cancer agents. To date, about 100,000 compounds and 50,000 natural product extracts have been screened. Early in this program it was discovered that the pattern of growth inhibition in these cell lines was similar for compounds of similar mechanism. The development of the COMPARE algorithm provided a means by which investigators, starting with a compound of interest, could identify other compounds whose pattern of growth inhibition was similar. With extensive molecular characterization of these cell lines, COMPARE and other user-defined algorithms have been used to link patterns of molecular expression and drug sensitivity. We describe here results of screening current FDA-approved anti-cancer agents in the NCI60 screen, with an emphasis on those agents that target signal transduction. We have analyzed results from agents with mechanisms of action presumed to be similar; we have also performed hierarchical clustering of all of these agents. The addition of data from recently approved anti-cancer agents will increase the utility of the NCI60 databases to the cancer research community. These data are freely accessible to the public on the DTP web site (http://dtp.cancer.gov/). The FDA-approved anti-cancer agents are themselves available from the NCI as a plated set of compounds for research use.
Keywords: NCI60, Drug Screen, Developmental Therapeutics
Introduction
The Developmental Therapeutics Program of the NCI has as its mission the discovery and development of novel anticancer agents. The program started more than 50 years ago as the Cancer Chemotherapy National Service Center and has had a significant role in the development of many agents that are now part of standard cancer care. Notable examples include paclitaxel (Taxol7) (1) and bortezomib (Velcade7) (2). One of the tools that DTP employs in the early stage of drug discovery and development is the NCI60 cell line screen. It utilizes a panel of 60 human tumor cell lines, chosen both for their ability to perform consistently under the conditions of the assay, and to represent a variety of tumor types (3). In use since the early 1990's, nearly 100,000 compounds and 50,000 natural product extracts have been examined for therapeutic activity in this assay. About half of the compounds are covered by confidentiality agreements. Data for the remaining compounds are freely available through the DTP web site (http://dtp.cancer.gov/) for independent analysis by any investigator.
In addition to the large body of compound sensitivity data, this panel of cell lines has been extensively characterized at the molecular level by numerous groups throughout the world (4). The resulting data are publicly available through the DTP web site (http://dtp.cancer.gov/mtargets/mt_index.html). RNA expression analysis, derived from 6 microarray measurements on 4 different platforms, provides data on >100,000 features for each cell line (5). Karyotype analysis of the cells has revealed numerous alterations in chromosome number and organization (6). Single nucleotide polymorphisms (SNPs) were determined on high density arrays, which also provide estimates of DNA copy number for 120,000 sites (7). Additional molecular characterization includes microRNA expression (8, 9), DNA mutation (10), protein analysis (11), DNA methylation (12), functional target analysis (13), and metabolomic analysis.
Both the compound sensitivity database and the molecular characterization data provide a rich context for the interpretation of novel compounds and targets in the NCI60. The COMPARE algorithm (14) is provided on the website to enable investigators to search for compounds or molecular targets with similar patterns of sensitivity or expression in the cell line screen. Because the data can be readily downloaded from the website, researchers may apply their own algorithms for data analysis. The addition of these FDA-approved anticancer agents to the dataset increases the utility of these databases to the cancer research community.
Materials and Methods
Compounds
All compounds were obtained from the NCI DTP Repository (Rockville, MD). Plated sets of approved oncology drugs are also available to researchers upon request at: http://dtp.cancer.gov/branches/dscb/oncology_drugset_explanation.html All proprietary agents were purchased commercially. When necessary, the active ingredient was extracted from formulated material, and purified. All compounds were assayed to confirm potency and purity, and these data are available at the website above.
NCI60 Anticancer Drug Screen
The screening methodology is described in detail at http://dtp.nci.nih.gov/branches/btb/ivclsp.html. Briefly, cells are seeded in 96 well plates at an appropriate density and incubated for 1 day. After 1 day, some of the plates are processed to determine a time zero density. To the remaining plates, compounds are added over a 5-log M concentration range. Plates are incubated a further 2 days, then fixed and stained with sulphorhodamine B. Growth inhibition is calculated relative to cells without drug treatment and the time zero control. The use of a time zero control allows the determination of cell kill as well as net growth inhibition.
If a particular endpoint falls outside of the testing range for a given cell line, the database assigns a value equal to either the highest or lowest concentration tested. For a potent compound, such that growth inhibition in a given cell line is greater than 50% at all concentrations, the GI50 would be imputed to be the lowest concentration tested. For a relatively inactive compound, such that a given cell line was inhibited less than 50% at all concentrations, the GI50 is assigned as the highest concentration tested.
The cell lines used in the screen have been extensively molecularly characterized, including high density SNP genotyping. More recently genotyping has been performed with the AmpFlSTR Identifiler PCR Amplification kit (Applied Biosystems, Foster City, CA), with results consistent with published results from others (15).
Statistical analyses
Analyses were performed using JMP7 statistical software (SAS Institute Inc, Cary, NC). Pairwise Pearson correlation coefficients were calculated using the multivariate platform. Hierarchical clustering was performed using the Ward method.
Results
The majority of the FDA-approved anticancer drugs were tested in the NCI60 screen at least 2 times. If the initial assay was performed over a non-optimal concentration range, additional assays were performed in concentration ranges that better captured the performance of the compound. From the dose-response curves, 3 endpoints were calculated, as illustrated in Figure 1, using dose-response data for dasatinib in the melanoma cell line panel: GI50 is the concentration of a compound that causes 50% growth inhibition, relative to the no drug control; TGI is the concentration that yields no net growth over the course of the assay (total growth inhibition). The LC50 endpoint calculates the concentration that kills 50% of the cells that were present at the time of drug addition.
Figure 1. Dose-response graphs for dasatinib assayed in the melanoma panel, demonstrating endpoint calculations.
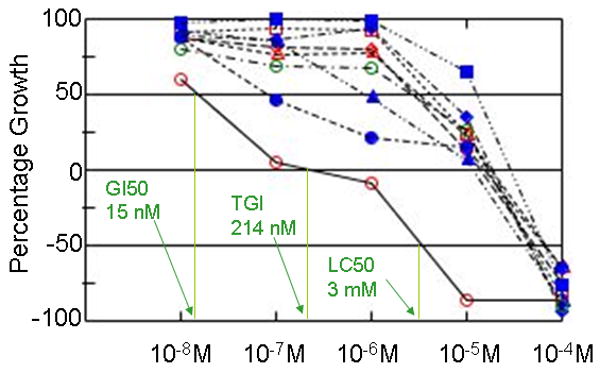
Dasatinib (NSC 732517) was tested at 5 concentrations (1 log dilutions from 10-4M to 10-8M). Growth percent of 100 corresponds to growth seen in untreated cells. Growth percent of 0 indicates no net growth over the course of the assay (i.e. equal to the number of cells at time zero). Growth percent of -100 results when all cells are killed. Three endpoints are routinely calculated: 1) GI50, the log M concentration yielding a growth percent of 50 (i.e. 50% growth inhibition), 2) TGI, the log M concentration yielding a growth percent of 0, or Total Growth Inhibition, and 3) LC50, the log M concentration yielding a growth percent of -50, or lethality in 50% of the starting cells. These endpoints are illustrated for cell line LOX-IMVI (red open circle). Other cell lines displayed are Malme-3M (red open diamond), M14 (red open triangle), MDA-MB-435 (red open square), SK-MEL-2 (solid blue circle), SK-MEL-28 (solid blue diamond), SK-MEL-5 (solid blue triangle), UACC-257 (solid blue square) and UACC-62 (open green circle).
Table 1 presents the mean sensitivity for each compound across all cell lines. When multiple concentration ranges were examined, the data were manually inspected to determine the optimal range to use. This process was performed separately for each of the 3 endpoints, since the optimal concentration range for determining GI50 may differ from that for determining LC50. If many cell lines were outside the testing range for a given endpoint, the value in Table 1 is estimated as > or < than the extremes of the concentration range.
Table 1. US FDA approved anticancer agents - Activity in the NCI60 panel.
Mean drug sensitivity across all cell lines.
Mean GI50, TGI and LC50 values across all cell lines in the NCI60 were calculated as described in the text. Data are presented as the concentration in μM producing 50% growth inhibition (GI50), total growth inhibition (TGI) and 50% lethality (LC50). These values were determined using the optimal concentration range(s) for each endpoint.
| Potency in mM | ||||
|---|---|---|---|---|
| Name | NSC # | Mean GI50 | Mean TGI | Mean LC50 |
| Signaling agents | ||||
| Bortezomib | 681239 | 0.00051 | 0.0063 | 3.6 |
| Dasatinib | 732517 | 0.33 | 8.9 | 51 |
| Erlotinib | 718781 | 5.5 | 59 | >90 |
| Everolimus | 733504 | 0.095 | 14 | 56 |
| Gefitinib | 715055 | 3.2 | 19 | 49 |
| Imatinib | 743414 | 15 | 43 | 81 |
| Lapatinib | 745750 | 2.9 | 20 | 61 |
| Nilotinib | 747599 | 2.9 | 13 | 49 |
| Sorafenib | 747971 | 1.9 | 6 | 30 |
| Sunitinib | 750690 | 2.2 | 9.6 | 31 |
| Temsirolimus | 683864 | 0.038 | 51 | >100 |
| DNA damaging agents | ||||
| Actinomycin D | 3053 | 0.0014 | 0.058 | 0.52 |
| BCNU (Carmustine) | 409962 | 65 | 170 | 330 |
| Bendamustine | 138783 | 60 | >100 | >100 |
| Bleomycin | 125066 | 1.3 | 12 | 23 |
| Busulfan | 750 | 210 | 970 | >1000 |
| Carboplatin | 241240 | 100 | >220 | >240 |
| CCNU (Lomustine) | 79037 | 36 | 120 | 310 |
| Chlorambucil | 3088 | 52 | 260 | 580 |
| Cisplatin | 119875 | 1.4 | 32 | >420 |
| Cyclophosphamide | 26271 | 210 | >250 | >250 |
| Dacarbazine | 45388 | 55 | >800 | >1000 |
| Hexamethylmelamine | 13875 | 140 | >150 | >150 |
| Ifosfamide | 109724 | 320 | >440 | >475 |
| Melphalan | 8806 | 27 | 110 | 210 |
| Methoxsalen | 45923 | 96 | >100 | >100 |
| Mitomycin C | 26980 | 0.71 | 6.6 | 18 |
| Mithramycin | 24559 | 0.013 | 0.65 | 200 |
| Nitrogen mustard | 762 | 2.8 | 19 | 100 |
| Oxaliplatin | 266046 | 2.8 | 52 | >90 |
| Pipobroman | 25154 | 64 | 210 | 370 |
| Procarbazine | 77213 | 440 | >470 | >500 |
| Quinacrine | 14229 | 1.7 | 5.2 | 19 |
| Streptozotocin | 85998 | 570 | >650 | >700 |
| Temozolomide | 362856 | 97 | >100 | >100 |
| ThioTEPA | 6396 | 70 | 400 | 770 |
| Triethylenemelamine | 9706 | 8.7 | 33 | 75 |
| Uracil mustard | 34462 | 24 | 160 | >410 |
| Tubulin-directed agents | ||||
| Docetaxel | 628503 | 0.014 | 12 | >85 |
| Ixabepilone | 747973 | <0.00001 | <0.00001 | <0.00001 |
| Paclitaxel | 125973 | 0.025 | 3.9 | 75 |
| Vinblastine | 49842 | 0.00001 | 0.28 | 32 |
| Vincristine | 67574 | 0.0045 | 13 | 250 |
| Vinorelbine | 608210 | 0.018 | 4.2 | 52 |
| Anthracyclines/Topoisomerase poisons | ||||
| Daunorubicin | 82151 | 0.068 | 1.1 | 10 |
| Doxorubicin | 123127 | 0.097 | 2.1 | 13 |
| Epirubicin | 256942 | 0.2 | 2.7 | 27 |
| Etoposide | 141540 | 6.6 | 50 | 420 |
| Idarubicin | 256439 | 0.038 | 0.25 | 3.8 |
| Irinotecan | 616348 | 14 | 58 | >100 |
| Mitoxantrone | 301739 | 0.059 | 0.88 | 7.8 |
| Teniposide | 122819 | 0.41 | 4.6 | 20 |
| Topotecan | 609699 | 0.031 | 2.5 | 43 |
| Valrubicin | 246131 | 0.49 | 6 | 41 |
| Antimetabolites/Nucleosides | ||||
| 5-azacytidine | 102816 | 0.95 | 8.7 | 350 |
| 5-fluorouracil | 19893 | 18 | 1600 | >2400 |
| 6-Mercaptopurine | 755 | 7.4 | 540 | >740 |
| Allopurinol | 1390 | 430 | 4200 | >5000 |
| Calcium leucovorin | 3590 | 93 | >100 | >100 |
| Capcitebine | 712807 | 80 | >10000 | >10000 |
| Cladribine | 105014 | 5.1 | 55 | >100 |
| Clofarabine | 606869 | 0.42 | 25 | 86 |
| Cytarabine | 63878 | 8.2 | 340 | >500 |
| Decitabine | 127716 | 37 | 260 | 350 |
| Floxuridine | 27640 | 0.39 | 755 | >2400 |
| Fludarabine | 312887 | 43 | 410 | >1100 |
| Gemcitabine | 613327 | 0.24 | 18 | 78 |
| Hydroxyurea | 32065 | 560 | >2000 | >2400 |
| Methotrexate | 740 | 0.3 | 210 | >250 |
| Nelarabine | 686673 | 2700 | >5000 | >5000 |
| Pemetrexed | 698037 | 11 | >100 | >100 |
| Pentostatin | 218321 | 440 | >480 | >500 |
| Thioguanine | 752 | 1.3 | 47 | 210 |
| Hormonal agents | ||||
| Anastrozole | 719344 | 2500 | >9000 | >10000 |
| Delta-1-testololactone | 23759 | 420 | >500 | >500 |
| Dimethyltestosterone | 88536 | 27 | >80 | >100 |
| Dromostanolone propionate | 12198 | 29 | 86 | >100 |
| Estramustine | 702294 | 42 | 85 | >100 |
| Ethinyl estradiol | 10973 | 25 | 78 | >100 |
| Exemestane | 713563 | 25 | 68 | >100 |
| Fulvestrant | 719276 | 62 | >100 | >100 |
| Letrozole | 719345 | 3400 | >5000 | >5000 |
| Megestrol acetate | 71423 | 64 | >100 | >100 |
| Mitotane | 38721 | 14 | 37 | 73 |
| Naldrolone | 23162 | 18 | 45 | 83 |
| Raloxifene | 747974 | 8.1 | 28 | 71 |
| Tamoxifen | 180973 | 4.6 | 18 | 23 |
| Toremifene | 613680 | 13 | 29 | 59 |
| Other | ||||
| Amifostine | 296961 | 540 | >700 | >750 |
| Aminolevulinic acid | 18509 | >100 | >100 | >100 |
| Arsenic trioxide | 706363 | 4.5 | >10 | >13 |
| Celecoxib | 719627 | 17 | 34 | 63 |
| Dexrazoxane | 169780 | 160 | 970 | >2000 |
| Imiquimod | 369100 | 43 | >100 | >100 |
| Lenalidomide | 747972 | >100 | >100 | >100 |
| Levamisole | 177023 | >100 | >100 | >100 |
| Mesna | 113891 | 98 | >100 | >100 |
| Nefinavir | 747167 | 5.2 | 20 | 68 |
| Nelfinavir mesylate | 722664 | 3.9 | 16 | 63 |
| Romidepsin | 630176 | 0.00025 | 0.0081 | 0.038 |
| Thalidomide | 66847 | >100 | >100 | >100 |
| Tretinoin (ATRA) | 122758 | 51 | 78 | >100 |
| Vorinostat | 701852 | 0.94 | 17 | 70 |
| Zoledronic acid | 721517 | 64 | >100 | >100 |
The GI50 values for each approved drug were used to calculate Pearson correlation coefficients between all of the other drugs. When multiple experiments were available for a drug in a given concentration range, the values for that drug were averaged to obtain a mean for each cell line. If multiple concentration ranges were tested, the dose response curves were visually inspected to determine which range provided the most reliable GI50 values, and those were used for the correlation analysis. If multiple concentration ranges appeared to be acceptable, all were used separately for the correlations. The resulting “matrix COMPARE” correlations were then hierarchically clustered, and the results shown graphically in Figure 2. Drugs were color coded according to mechanism of action. Most agents cluster with other drugs of similar presumed mechanism.
Figure 2. Clustering of correlations of NCI60 GI50 patterns for all drugs.
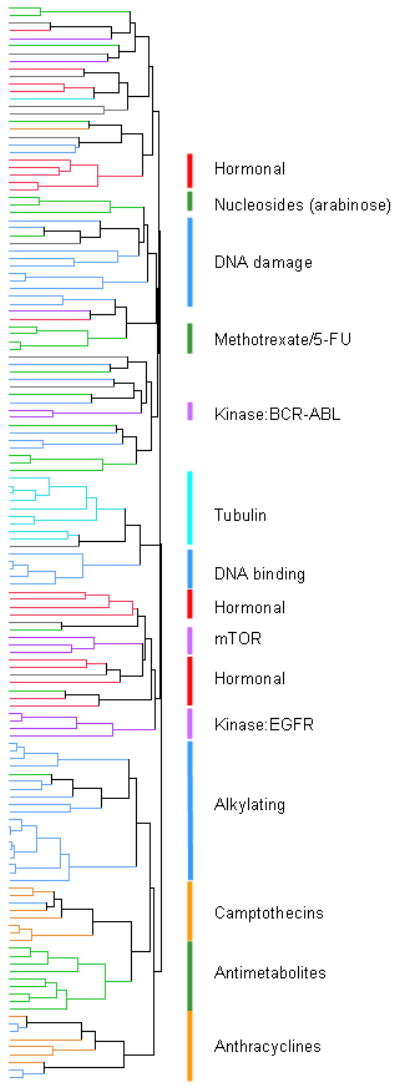
Pearson correlation coefficients comparing the GI50 patterns of each drug to all other drugs were hierarchically clustered. The agents are color-coded according to mechanistic category: Purple for signaling agents, blue for alkylating and other DNA damaging agents, turquoise for tubulin binders, orange for topoisomerase poisons, green for antimetabolites and nucleosides, red for hormonal agents and grey for all others. The correlation underlying this clustering can be found in Supplemental Table 1, presented in the same sort order as this figure.
Eleven drugs that affect signal transduction were tested in the NCI60 screen. The mean potency of these compounds was quite variable. The most potent were bortezomib (mean GI50 of 0.51 nM) and temsirolimus (mean GI50 of 38 nM). The mean potency of the kinase inhibitors ranged from 0.3 mM (dasatinib) to 15 mM (imatinib). However, because of their high target specificity, kinase inhibitors may inhibit the growth of a only a small number of cell lines. Imatinib is the most extreme example, as shown in Figure 3. While the mean GI50 is 15 mM, the only cell line in the panel bearing the BCR-ABL translocation (K-562) is roughly 1000-fold more sensitive (GI50 of 0.02 mM).
Figure 3. Dose response graphs for all cell lines in the NCI60 panel exposed to imatinib (NSC 743414).
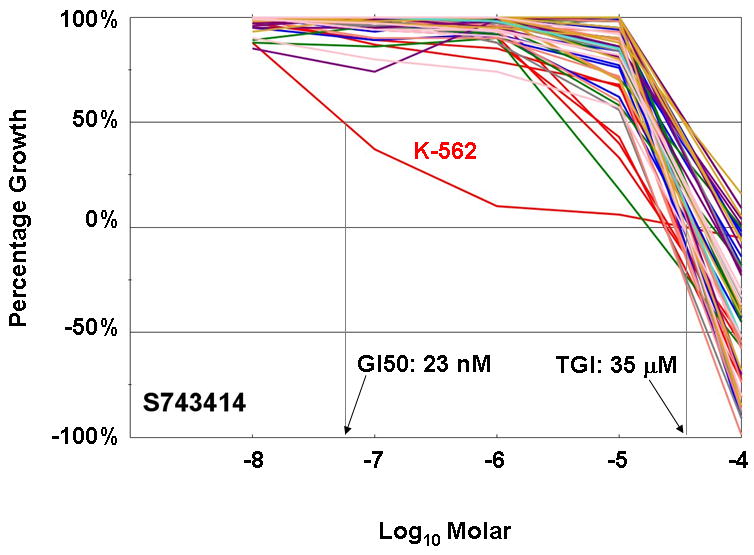
Imatinib was tested at 5 concentrations (1 log dilutions from 10-4M to 10-8M). Note that only one of the cell lines, K-562, which harbors a BCR-Abl gene fusion, has significant sensitivity to this BCR-Abl/KIT/PDGFR inhibitor. The GI50 and TGI concentrations for K-562 are indicated. Imatinib did not cause sufficient lethality in this cell line to calculate LC50. The graph is color-coded by tissue of origin: Red for leukemia, blue for lung cancer, green for colon cancer, grey for CNS cancer, coral for melanoma, purple for ovarian cancer, gold for renal cancer, turquoise for prostate cancer and pink for breast cancer cell lines.
Bortezomib was tested in the NCI60 screen during its early development, along with other, related anti-proteasomal drug candidates. These agents had a unique signature in the NCI60 screen - they were what may be referred to as “COMPARE negative”, that is their pattern of growth inhibition did not resemble other previously tested classes of compounds. In addition, the potency of the series of proteasome inhibitory compounds in the NCI60 panel was proportional to activity against purified proteasomes (16). One of the more sensitive cell lines in the panel was the multiple myeloma line RPMI-8226; bortezomib is now a standard of care for the treatment of myeloma. Figure 4 displays the NCI60 data for bortezomib in 2 different formats: as a waterfall plot of each TGI data (Figure 4a), and as a dose-response plot of all cell lines (Figure 4b). These graphs demonstrate that bortezomib has a particular growth inhibition signature, with some cell lines being exquisitely sensitive, and some that are relatively resistant.
Figure 4. NCI60 graphs for bortezomib (NSC 681239).
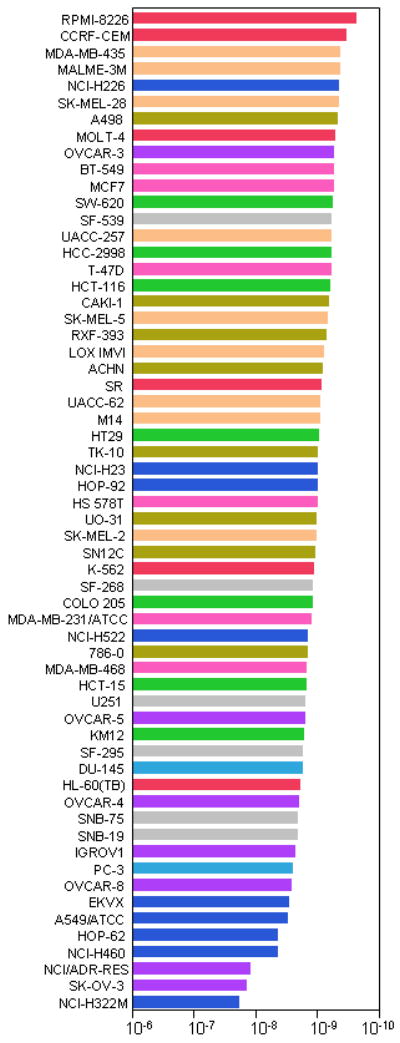
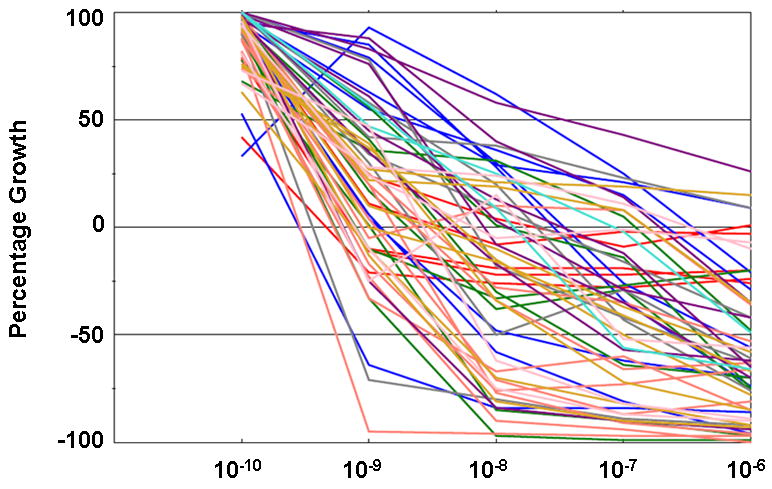
The data for bortezomib tested at 5 concentrations (1 log dilutions from 10-6M to 10-10M) are presented in two different formats. Figure 4a: GI50 molar values presented as a “waterfall” plot, with the most sensitive cell lines for each endpoint at the top of the graph. Figure 4b: Dose-response curves for all cell lines overlaid on the same plot. Cell lines are color-coded as for Figure 3.
Dasatinib also demonstrated a fairly unique pattern of NCI60 activity (Figure 1). Interestingly, this pattern did not have a significant correlation (PCC = 0.15) with that of imatinib, which targets BCR-ABL, c-KIT and PDGFR. Dasatinib inhibits these as well as inhibiting Src family kinases. Imatinib is highly specific for the BCR-ABL cell line K-562, as shown in Figure 3; none of the NCI60 cell lines harbors a KIT mutation. While dasatinib is also highly active against K-562, it is also active against many other cell lines in the panel, as shown in Figure 1. Among the most sensitive cell lines were those expressing higher levels of both PDGFRA and PDGFRB (data not shown). The CNS line U251, which expresses PDGFRA, but not PDGFRB, was relatively insensitive to dasatinib.
A matrix COMPARE analysis was performed for the signaling agents, as described above, and the resulting Pearson correlation coefficients clustered. The results are shown in Figure 5. All 3 drugs that target EGFR cluster together, including lapatinib, an agent that also targets ERBB2.
Figure 5. Clustering of correlations of NCI60 GI50 patterns for the signaling drugs.
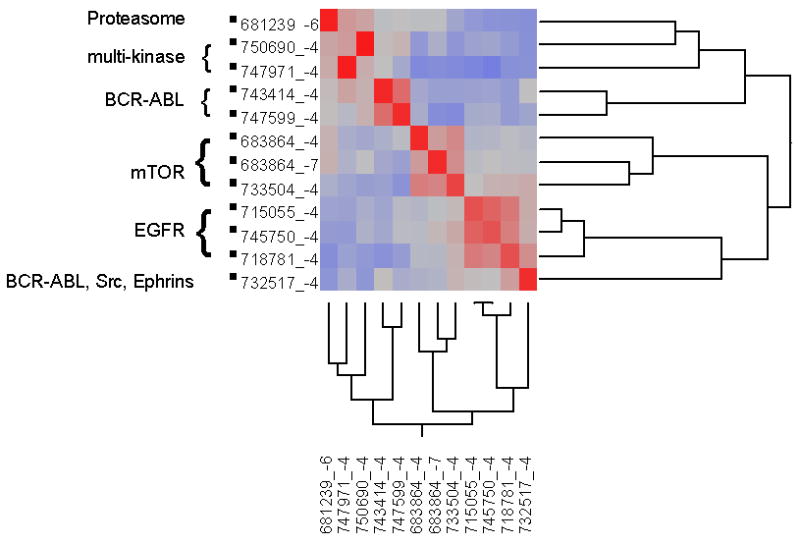
PCCs for the agents targeting signal transduction were hierarchically clustered in two symmetric dimensions. A heat map of the PCCs is shown, with higher correlations in red and lower PCCs in blue.
Mean graphs are shown in Figure 6 for gefitinib and lapatinib. The graphs are visually similar, and COMPARE analysis confirms this, with a high correlation (PCC of 0.88) between these agents. Several cell lines are particularly sensitive to these 2 agents (Lung EKVX, Lung NCI-H322M, Ovarian IGROV1, Ovarian SK-OV-3, Renal ACHN, Renal TK-10, Breast MDA-MB-468) - all of these lines are KRAS wild-type (17), in agreement with clinical findings that KRAS mutant tumors are unresponsive to these drugs (18).
Figure 6. Mean graph plots of GI50 values for Gefitinib (NSC 715055) and Lapatinib (NSC 745750).
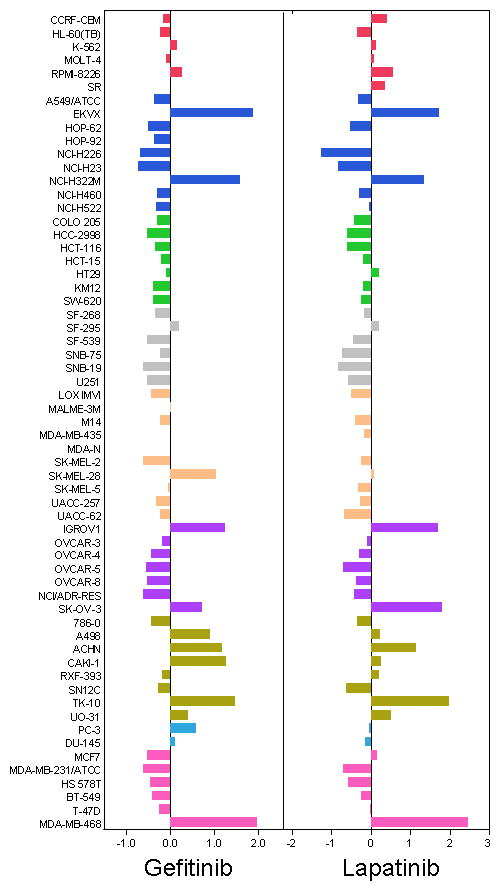
GI50 values for each cell line were calculated from dose-response curves. The mean GI50 for each compound across all 60 cell lines was calculated. The difference from the between the GI50 for a particular cell line and the mean GI50 is plotted here. Cell lines that were more sensitive are displayed as bars that project to the right of the mean. Cell lines that were less sensitive are displayed with bars projected to the left. Cell lines are color-coded as for Figure 3. Mean graphs for two compounds with similar mechanisms are shown. Both gefitinib and lapatinib inhibit the tyrosine kinase EGFR, and lapatinib also inhibits the related kinase ERBB2. The 2 compounds give similar mean graph patterns. The degree of similarity was quantitated using the COMPARE algorithm, which gave a Pearson correlation coefficient of 0.88, confirming that these patterns are very similar. The most responsive cell lines to these agents are all wild-type for KRAS, in line with what has been observed in the clinic.
Imatinib and nilotinib, which inhibit the BCR-ABL kinase, as well as KIT and PDGFR cluster with one another, while dasatinib, which targets Src family kinases as well, does not cluster with these 2 BCR-ABL inhibitors. The mTOR inhibitors temsirolimus and everolimus cluster with one another, and are distinct from the other signaling agents.
Epigenetic regulation of gene expression has been implicated in the regulation of many cancer-related genes. This has inspired the development of multiple agents that inhibit of histone deacetylases (HDACs), and two are currently approved oncology drugs. Vorinostat is a broad HDAC inhibitor, and blocks the action of class I, II and IV HDACs, while romidepsin has a narrower profile, inhibiting class I HDACs (reviewed in (19)). The GI50 patterns for vorinostat and romidepsin are not similar.
Previous publications have reviewed the NCI60 results from traditional cytotoxics, such as tubulin-directed agents, alkylating agents and topoisomerase poisons. These data have been used to identify new compounds with similar patterns of growth inhibition to agents of known mechanism. Starting with the topoisomerase I poison camptothecin, Kohlhagen et al. utilized COMPARE to identify a novel structural class, the indenoisoquinolines, as topoisomerase poisons (20). After testing many analogs, two indenoisoquinolines have started clinical trials (21).
Two recently approved anti-cancer agents can be classified as traditional cytotoxics. Ixabepilone, a tubulin-stabilizing drug, does not show high correlations with other tubulin-interacting agents at GI50 (Supplementary Table 1); however this may be due to the fact that the compound has much greater potency in the screen. Pemetrexed, an antifolate, has a similar pattern of growth inhibition to other antimetabolites, including floxuridine.
We found a number of agents to be inactive in the NCI60 screen at the concentrations tested. These include thalidomide, lenalidomide, aminolevulinic acid and levamisole. It is likely that the efficacy of at least some of these drugs depends on their effect on the immune system or components of the extracellular milieu of tumors (22), which would not be detectable in a cell line screen such as the NCI60.
Discussion
As a service to the cancer research community, we undertook to screen the majority of US FDA-approved anti-cancer drugs in the NCI60, a panel of 60 human tumor cell lines, and to make these data publicly available. The NCI60 has been used for the past 2 decades to screen chemicals and natural product extracts for the ability to inhibit the growth of, or to kill, cancer cells. Nearly 100,000 pure compounds and 50,000 natural product extracts have been tested, with data publicly available for pure compounds that are not covered by a confidentiality agreement, through the NCI-DTP web site (http://dtp.cancer.gov/).
While an early design hypothesis of the NCI60 screen was to identify compounds with disease specificity (i.e. compounds that might target colon cancer cells), it soon became clear that mechanistic insight into the action of novel compounds could be obtained by studying the patterns of which cells responded to an agent and which were more resistant. For example, compounds that bind to tubulin have similar growth inhibition patterns regardless of which site on tubulin they bind, or whether they stabilize or destabilize microtubules. Paull et al. formalized this observation with the COMPARE algorithm (14). Dose-response curves for each cell line are converted into “endpoint” patterns, which represent a snapshot of the activity of the agent. Three endpoints are routinely calculated – GI50, i.e. the concentration at which growth is 50% of the no-drug control, TGI, total growth inhibition, the concentration where the number of cells is equal to those at time zero, when drug is added, and LC50, the concentration at which the number of viable cells is 50% of those present at time zero. These endpoint patterns thus comprise a pattern that the COMPARE algorithm utilizes to calculate a Pearson Correlation Coefficient (PCC), a measure of how similar the patterns are. A correlation of 1.0 identifies a perfect match, a PCC of -1.0 denotes a perfect mirror image, while PCC of 0 means there is no correlation between the two patterns. Such correlations do indeed allow one to group many of the approved drugs according to mechanism of action, as demonstrated in Figures 2 and 5.
All of the NCI60 datasets described herein are publicly available. The raw data for percent growth, the parametric analyses for GI50, TGI and LC50 datasets, as well as the microarray and other molecular target characterization data are available to download, should users wish to undertake their own analyses. A variety of visualization tools are currently available on the DTP website. Both compound sensitivity and Molecular Target data can be searched, and resulting data displayed as a Mean Graph. The COMPARE algorithm can be accessed to search for NCI60 patterns similar to any starting “seed”. One can choose a compound of interest and query the database for compounds with similar patterns of activity, or for Molecular Targets whose pattern of expression correlates with sensitivity to an agent of interest. For instance, one can begin with a novel compound that has been tested in the screen, and run COMPARE to see if it has a similar sensitivity pattern to any agents of known mechanism, thus generating hypotheses as to the mechanism of action of the novel compound that can be tested in the laboratory.
When reviewing the results of a COMPARE analysis, there are a number of factors to consider in evaluating “hits”. First, how many experiments were performed with the compound? Compounds with good activity and/or interesting patterns of cell line growth inhibition are generally tested at least twice. Sometimes compounds are tested in multiple concentration ranges; the values used for COMPARE are averaged for each cell line across all tests at a given concentration range, as indicated by the log of the highest concentration tested (LHICONC). Different concentration ranges may give different patterns of growth inhibition and different COMPARE results, if one of the ranges is not optimal for the calculated endpoint (e.g. bortezomib at the high concentrations of 10-4M and 10-6M).
In addition to providing the NCI60 cell line data described here, the FDA-approved agents used for these studies are available from DTP as a plated set of compounds, for use in cancer research. The agents are provided on 96-well plates as 20 microliters of a 10mM solution in 100% DMSO. As new anti-cancer agents are approved by the US FDA, DTP will add them to this set. Instructions for obtaining the Approved Oncology Drug Set, as well as ancillary information on these compounds can be found at http://dtp.cancer.gov/branches/dscb/oncology_drugset_explanation.html.
Supplementary Material
PCC values for each pairwise correlation between each drug and all other drugs, used in the clustering that generated Figure 2. The data are sorted to be in the same order as the clusters. The identifiers are a concatenation of the NSC number (NCI's identifier) and the log M of the highest concentration in the assay. Thus 102816_-2.6 identifies NSC 102816 tested at 5 1-log M dilutions from 10-2.6M to 10-6.6M.
The GI50 values used in these analyses is presented in same order as for Table 1. As described in the text, if the GI50 is not within the tested range, it is assigned a value equal to the highest or lowest concentration tested. These imputed values are highlighted in the table, with those cases where the cell line gave more than 50% growth inhibition at all 5 doses in pink, and those cases where the cell line gave less than 50% growth inhibition at all 5 doses shown in blue.
Acknowledgments
The authors wish to thank the members of the Developmental Therapeutics Program for providing the agents used in these studies and for making them available to cancer researchers via the Approved Oncology Drugs plated set.
Financial support: This work was suppored by federal funds from the National Cancer Institute, National Institutes of Health.
Abbreviations list
- NCI
National Cancer Institute
- NCI60
NCI's panel of 60 human tumor cell lines
- DTP
Developmental Therapeutics Program
- FDA
Food and Drug Administration
- RNA
Ribonucleic acid
- SNP
Single nucleotide polymorphism
- DNA
Deoxyribonucleic acid
- GI50
Drug concentration yielding 50% growth inhibition
- TGI
Drug concentration yielding 100% growth inhibition
- LC50
Drug concentration yielding 50% lethality
- PCR
Polymerase chain reaction
- HDAC
Histone deacetylase
- PCC
Pearson correlation coefficient
- LHICONC
log10 M of the highest concentration
- DMSO
dimethylsulfoxide
Footnotes
Conflicts of interest: None.
Contributor Information
Susan L. Holbeck, Email: holbecks@mail.nih.gov, National Cancer Institute, Division of Cancer Treatment and Diagnosis, Developmental Therapeutics Program, Information Technology Branch, 6130 Executive Blvd., Room 8014, Bethesda, MD 20892. Telephone: 301-435-9178; Fax: 301-480-4808.
Jerry M. Collins, Email: collinsje@mail.nih.gov, National Cancer Institute, Division of Cancer Treatment and Diagnosis, Developmental Therapeutics Program, 6130 Executive Blvd. Room 8018, Bethesda, MD 20892. Telephone: 301-496-8720; Fax: 301-402-0831.
James H. Doroshow, Email: doroshoj@mail.nih.gov, National Cancer Institute, Division of Cancer Treatment and Diagnosis, 31 Center Drive, Room 3A44, Bethesda, MD 20892. Telephone: 301-496-4291; Fax: 301-496-0826.
References
- 1.Cragg GM. Paclitaxel (Taxol): a success story with valuable lessons for natural product drug discovery and development. Med Res Rev. 1998 Sep;18(5):315–31. doi: 10.1002/(sici)1098-1128(199809)18:5<315::aid-med3>3.0.co;2-w. [DOI] [PubMed] [Google Scholar]
- 2.Holbeck SL, Sausville EA. The Proteasome and the COMPARE Algorithm. In: Adams J, editor. Proteasome Inhibitors in Cancer Therapy. Humana Press; 2004. [Google Scholar]
- 3.Scudiero DA, Shoemaker RH, Paull KD, et al. Evaluation of a soluble tetrazolium/formazan assay for cell growth and drug sensitivity in culture using human and other tumor cell lines. Cancer Res. 1988 Sep 1;48(17):4827–33. [PubMed] [Google Scholar]
- 4.Holbeck SL. Update on NCI in vitro drug screen utilities. Eur J Cancer. 2004 Apr;40(6):785–93. doi: 10.1016/j.ejca.2003.11.022. [DOI] [PubMed] [Google Scholar]
- 5.Sausville EA, Holbeck SL. Transcription profiling of gene expression in drug discovery and development: the NCI experience. Eur J Cancer. 2004 Nov;40(17):2544–9. doi: 10.1016/j.ejca.2004.08.006. [DOI] [PubMed] [Google Scholar]
- 6.Roschke AV, Tonon G, Gehlhaus KS, et al. Karyotypic complexity of the NCI-60 drug-screening panel. Cancer Res. 2003 Dec 15;63(24):8634–47. [PubMed] [Google Scholar]
- 7.Garraway LA, Widlund HR, Rubin MA, et al. Integrative genomic analyses identify MITF as a lineage survival oncogene amplified in malignant melanoma. Nature. 2005 Jul 7;436(7047):117–22. doi: 10.1038/nature03664. [DOI] [PubMed] [Google Scholar]
- 8.Gaur A, Jewell DA, Liang Y, et al. Characterization of microRNA expression levels and their biological correlates in human cancer cell lines. Cancer Res. 2007 Mar 15;67(6):2456–68. doi: 10.1158/0008-5472.CAN-06-2698. [DOI] [PubMed] [Google Scholar]
- 9.Blower PE, Verducci JS, Lin S, et al. MicroRNA expression profiles for the NCI-60 cancer cell panel. Mol Cancer Ther. 2007 May;6(5):1483–91. doi: 10.1158/1535-7163.MCT-07-0009. [DOI] [PubMed] [Google Scholar]
- 10.Ikediobi ON, Davies H, Bignell G, et al. Mutation analysis of 24 known cancer genes in the NCI-60 cell line set. Mol Cancer Ther. 2006 Nov;5(11):2606–12. doi: 10.1158/1535-7163.MCT-06-0433. [DOI] [PMC free article] [PubMed] [Google Scholar]
- 11.Nishizuka S, Charboneau L, Young L, et al. Proteomic profiling of the NCI-60 cancer cell lines using new high-density reverse-phase lysate microarrays. Proc Natl Acad Sci U S A. 2003 Nov 25;100(24):14229–34. doi: 10.1073/pnas.2331323100. [DOI] [PMC free article] [PubMed] [Google Scholar]
- 12.Ehrich M, Turner J, Gibbs P, et al. Cytosine methylation profiling of cancer cell lines. Proc Natl Acad Sci U S A. 2008 Mar 25;105(12):4844–9. doi: 10.1073/pnas.0712251105. [DOI] [PMC free article] [PubMed] [Google Scholar]
- 13.Lee JS, Paull K, Alvarez M, et al. Rhodamine efflux patterns predict P-glycoprotein substrates in the National Cancer Institute drug screen. Mol Pharmacol. 1994 Oct;46(4):627–38. [PubMed] [Google Scholar]
- 14.Paull KD, Shoemaker RH, Hodes L, et al. Display and analysis of patterns of differential activity of drugs against human tumor cell lines: development of mean graph and COMPARE algorithm. J Natl Cancer Inst. 1989 Jul 19;81(14):1088–92. doi: 10.1093/jnci/81.14.1088. [DOI] [PubMed] [Google Scholar]
- 15.Lorenzi PL, Reinhold WC, Varma S, et al. DNA fingerprinting of the NCI-60 cell line panel. Mol Cancer Ther. 2009 Apr;8(4):713–24. doi: 10.1158/1535-7163.MCT-08-0921. [DOI] [PMC free article] [PubMed] [Google Scholar]
- 16.Adams J, Palombella VJ, Sausville EA, et al. Proteasome inhibitors: a novel class of potent and effective antitumor agents. Cancer Res. 1999 Jun 1;59(11):2615–22. [PubMed] [Google Scholar]
- 17.Koo HM, Monks A, Mikheev A, et al. Enhanced sensitivity to 1-beta-D-arabinofuranosylcytosine and topoisomerase II inhibitors in tumor cell lines harboring activated ras oncogenes. Cancer Res. 1996 Nov 15;56(22):5211–6. [PubMed] [Google Scholar]
- 18.Baynes RD, Gansert J. KRAS mutational status as a predictor of epidermal growth factor receptor inhibitor efficacy in colorectal cancer. Am J Ther. 2009 Nov-Dec;16(6):554–61. doi: 10.1097/MJT.0b013e318199fa17. [DOI] [PubMed] [Google Scholar]
- 19.Lane AA, Chabner BA. Histone deacetylase inhibitors in cancer therapy. J Clin Oncol. 2009 Nov 10;27(32):5459–68. doi: 10.1200/JCO.2009.22.1291. [DOI] [PubMed] [Google Scholar]
- 20.Kohlhagen G, Paull KD, Cushman M, Nagafuji P, Pommier Y. Protein-linked DNA strand breaks induced by NSC 314622, a novel noncamptothecin topoisomerase I poison. Mol Pharmacol. 1998 Jul;54(1):50–8. doi: 10.1124/mol.54.1.50. [DOI] [PubMed] [Google Scholar]
- 21.Pommier Y, Cushman M. The indenoisoquinoline noncamptothecin topoisomerase I inhibitors: update and perspectives. Mol Cancer Ther. 2009 Apr 21;8:1008–14. doi: 10.1158/1535-7163.MCT-08-0706. [DOI] [PMC free article] [PubMed] [Google Scholar]
- 22.Kotla V, Goel S, Nischal S, et al. Mechanism of action of lenalidomide in hematological malignancies. J Hematol Oncol. 2009;2:36. doi: 10.1186/1756-8722-2-36. [DOI] [PMC free article] [PubMed] [Google Scholar]
Associated Data
This section collects any data citations, data availability statements, or supplementary materials included in this article.
Supplementary Materials
PCC values for each pairwise correlation between each drug and all other drugs, used in the clustering that generated Figure 2. The data are sorted to be in the same order as the clusters. The identifiers are a concatenation of the NSC number (NCI's identifier) and the log M of the highest concentration in the assay. Thus 102816_-2.6 identifies NSC 102816 tested at 5 1-log M dilutions from 10-2.6M to 10-6.6M.
The GI50 values used in these analyses is presented in same order as for Table 1. As described in the text, if the GI50 is not within the tested range, it is assigned a value equal to the highest or lowest concentration tested. These imputed values are highlighted in the table, with those cases where the cell line gave more than 50% growth inhibition at all 5 doses in pink, and those cases where the cell line gave less than 50% growth inhibition at all 5 doses shown in blue.


