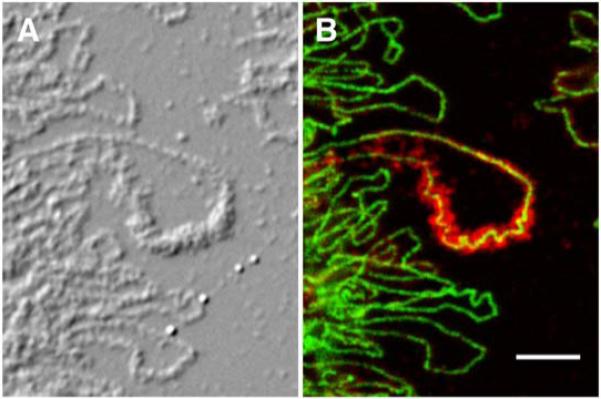
Figure 4.

LBC preparations reveal details of chromosome structure at the molecular level. A. Differential interference contrast image of LBCs from the newt N. viridescens. B. The same region showing immunostaining with an antibody against RNA polymerase II (green) and cleavage stimulation factor 77 (red). Note that the green polymerase stain is limited to a diffraction-limited line in each lateral loop, especially well shown in the large loop in the center of the image. This line delineates the actively transcribing RNA polymerase molecules associated with the DNA axis of the loop. The red stain shows the nascent transcripts that coat the DNA axis. Modified from [32] with permission from Molecular Biology of the Cell. Bar = 5 μm.
