

Abstract
The tumor suppressor p53 is often referred to as ‘the guardian of the genome’ due to its central role in the cellular response to oncogenic stress and prevention of tumor development. Mutations of p53 in acute myeloid leukemia are rare but resistance to chemotherapy has been reported due to deregulation of the p53 signaling and differentiation pathways. It is known that the interaction of the vitamin D metabolite (1,25D) with its functional vitamin D receptor (VDR) leads to differentiation, G1 arrest, and increased cell survival in p53-null AML cells. However, there are no reports on the effect of 1,25D in leukemia cells expressing wild-type p53. Here, we examine vitamin D signaling in acute myeloid leukemia (AML) cells, MOLM-13 and OCI-AML3 expressing wild-type p53 in the presence and absence of the MDM2 antagonist nutlin-3. We find that 1,25D alone induces monocytic differentiation in these cell lines similar to that seen in p53-null AML cells, suggesting that the presence of wild-type p53 is compatible with activation of vitamin D signaling. Combination of nutlin-3 with 1,25D accelerated programmed cell death, likely due to enhanced nutlin-induced upregulation of the pro-apoptotic PIG-6 protein and downregulation of anti-apoptotic BCL-2, MDMX, hKSR2 and p-ERK1/2.
Keywords: 1,25D; apoptosis; p53; nutlin-3a; BCL-2; PIG-6
INTRODUCTION
Acute Myeloid Leukemia (AML) is a hematological disease characterized by the failure of hematopoietic stem cells to differentiate (1). As a result, there is accumulation of immature blasts incapable of performing their physiological roles. A large number of genetic aberrations have been linked to AML, such as altered transcription factors that regulate myeloid maturation and mutation of receptor tyrosine kinases (2), constitutively active anti-apoptotic proteins belonging to the Bcl-2 and IAP families (3) and Rb protein (4). For example, a prognostically important form of mutation is the in-frame internal tandem duplication (ITD) of the FLT3 receptor tyrosine kinase (5). These and other mutations ultimately lead to deregulation of the cell cycle and/or the apoptotic machinery.
The tumor suppressor p53 is a key regulator of the G1/S and G2/M cell cycle checkpoints and it is frequently disabled in neoplastic cells through mutation or deletion (6). In proliferating cells, p53 is negatively regulated by MDM2, a specific E3 ubiquitin ligase, which targets p53 for ubiquitin-dependent degradation. MDM2 binds to the amino terminus of p53 and inhibits its transcriptional activity. MDM2 is a transcription target of p53 and thus p53 and MDM2 form an autoregulatory feedback loop regulating the cellular levels of both proteins (7). MDM2 also functions as an E3 ubiquitin ligase for MDMX, a close analog of MDM2 that binds to the same region in the N-terminus of p53, but MDMX does not function as an ubiquitin ligase for p53 (8). Therefore, MDM2 not only regulate p53 activity but also controls the stability of MDMX.
Nutlin-3a, a small-molecule inhibitor of the p53-MDM2 interaction, developed at Roche, binds to the p53 pocket of MDM2 with high selectivity, effectively stabilizes p53 and induces cell cycle arrest and apoptosis in cancer cells with wild-type p53 (9, 10). Nutlin-induced p53 elevates the cellular level of its transcriptional target MDM2. It has been reported that stress-induced phosphorylation of p53 prevents the binding of MDM2 to p53. We have shown that despite the lack of phosphorylation on key N-terminal serines of p53, nutlin-3a effectively induces cell cycle arrest and apoptosis in cancer cells (11). In addition to its transcriptional activity, p53 can translocate to mitochondria and modulate the activity of BH3-containing pro-apoptotic proteins such as Bax by transcriptionally-independent mechanisms (12).
1,25-dihydroxyvitamin D3 (1,25D), the biologically active form of vitamin D has profound effects on calcium homeostasis, bone metabolism (13), monocytic differentiation (14, 15), and cell cycle traverse in several human leukemic cell lines (16, 17). When 1,25D enters a cell, it binds to and activates its high-affinity vitamin D receptor (VDR). This leads to heterodimerization with the retinoid X receptors (RXR α, β, γ), and the complexes then bind to vitamin D response elements (VDREs) located in the promoters of vitamin D-responsive genes (18). It has been observed that 1,25D-induced monocytic differentiation in HL60 cells occurs in two overlapping phases. In the first 24–48 hours (early differentiation), the MAPK/ERK pathway is activated for expression of genes involved in cell proliferation. Beyond 48 hours (late differentiation), the MAPK/ERK pathway activity is low (due to increase in p35/NCK5A expression) but KSR/Raf-1/p90RSK signaling is increased (19–21). Kinase Suppressor of Ras1 (KSR1), a protein scaffold that augments interaction of Ras with Raf, MEK & ERK, may amplify this pathway and phosphorylate down-stream targets such as C/EBPβ (22–24). Human KSR2 (hKSR2), an evolutionary conserved member of the KSR family is also upregulated by 1,25D and promotes cell survival and optimal monocytic differentiation (25).
The p53 and vitamin D pathways share some common molecular mediators and biological functions which may interact when activated. Maruyama et al., (26) have found p53 binding sites in the promoter of VDR, suggesting that p53 may affect the vitamin D pathway. Since activation of p53 and vitamin D pathways lead to growth arrest and affect cell survival of AML cells, we hypothesized that agents activating both signaling pathways may synergize in their activity. This prompted us to investigate the combination effect of an MDM2 antagonist and 1,25D. Here, we show that 1,25D accelerates the onset of p53-dependent apoptosis induced by nutlin-3a in MOLM-13 and OCI-AML3 cells. Our results suggest that the modulation of some p53 targets, such as enhanced upregulation of PIG-6 and downregulation of BCL-2, MDMX, hKSR2 and p-ERK1/2 proteins are the likely contributors to the enhanced apoptotic effect of the MDM2 antagonist.
MATERIALS AND METHODS
Chemicals and Antibodies
Nutlin-3a and its inactive enantiomer, nutlin-3b were synthesized at Hoffmann-La Roche, Nutley. NJ. Compounds were dissolved in DMSO and kept as frozen aliquots. Anti-CD14, My4-RD-1-PE (Phycoerythrin) and anti-CD11b, MO1- Fluorescein isothiocynate (FITC) antibodies were obtained from Coulter Corp. (Brea, CA). Antibodies used for Western blotting were as follows: β-actin (A5316), MDMX (A300-287A), PIG-6 (ab48001) and KSR-1 (ab52196) antibodies were purchased from Sigma, Bethyl Laboratories, Calbiochem, BD Biosciences and Abcam, respectively. Phospho MEK1/2 (ser217/221; 9121), phospho MEK1/2 (thr286; 9127), MEK1/2 (9122) and phospho ERK1/2 (thr202/Tyr204; 4377) were purchased from Cell Signaling Inc., MA. BCL-2 (sc-7382), ERK1/2 (sc-94), MDM2 (sc-965), p53 (sc-263), PARP (sc-7150), VDR (C-20, sc-1008), were purchased from Santa Cruz Biotechnology Inc., CA. Human KSR2 (H00283455-A01) antibody was purchased from Abnova Corporation/ Novus Biologicals. Taiwan. Secondary antibodies, anti-goat IgG-HRP (sc-2020), anti-rabbit IgG-HRP (sc-2301) and anti-mouse IgG-HRP (sc-2302) were also purchased from Santa Cruz Biotechnology Inc.
Cell Culture and Treatments
MOLM-13 cell line was purchased from DSMZ (Braunschweig, Germany) and the OCI-AML3 cell line was a kind gift from Dr. Mark Minden, Princess Margaret Hospital (Ontario, Canada). Both cell lines were cultured in RPMI-1640 medium supplemented with 10% heat-inactivated fetal bovine serum (FBS). Both cell lines harbor ITD mutations in FLT-3 tyrosine kinase receptors. OCI-AML3 also has mutations in JAK2 and nucleophosmin (DSMZ cell database). HL60 and THP-1 cells, purchased from the American Type Culture Collection (ATCC, VA) were cultured in Iscove’s and RPMI-1640 medium supplemented with 20% and 10% heat-inactivated FBS respectively. Cells were cultured in fresh tissue culture media at a cell density of 1×10⁶ cells per 10 ml media in 25 cm2 flasks and treated immediately with compounds or the equivalent volume of ethanol or DMSO as vehicle control. Cell lines were mycoplasma-free and cultured in a humidified environment with 5% carbon dioxide. For combination experiments, cells were exposed to 1,25D for a total of 48 h and nutlin-3a was added during the last 5–24 h.
Western Blotting
Cells were harvested and washed twice with ice-cold phosphate-buffered saline (PBS). Cell pellets were solubilized with RIPA lysis buffer [20 mM Tris-Hydrogen Chloride (HCl, pH 7.5), 150 mM Sodium Chloride, 1 mM ethylenediaminetetraacetic acid (EDTA), 1 mM ethylene glycol tetraacetic acid (EGTA), 1% Nonidet P-40 (NP-40), 1% sodium deoxycholate, 2.5 mM sodium pyrophosphate, 1 mM β-glycerophosphate, 1 mM sodium vanadate, 1 mM phenylmethylsulfonyl fluoride, 1 µg/ml leupeptin, and 1 µg/ml aprotinin] followed by centrifugation at 16,000×g for 20 min. The protein concentrations of the extracts were determined by using the Bio-Rad protein assay kit and then incubated in (3:1) 4× sodium dodecyl sulfate (SDS) sample buffer [150 mM Tris-Hydrogen Chloride (Tris-HCl, pH 6.8), 30% glycerol, 3% SDS, 1.5 mM bromophenol blue dye, and 500 mM dithiothreitol]. Proteins (15 or 30 µg per lane) in cell extracts were separated on 4–20% SDS-polyacrylamide gel electrophoresis and then transferred to polyvinylidene Fluoride (PVDF) membranes (Amersham). Membranes were blocked with 5% milk in Tris Buffered Saline/0.1% Tween 20 for 1 h, incubated overnight with primary antibodies, and then blotted with a horseradish peroxidase–linked secondary antibody for 1 h. The protein bands were visualized using a chemiluminescence assay system (GE Healthcare) and the absorbance of each band was quantitated using MultiGuage™ (Fuji, USA).
Determination of Differentiation Markers
Approximately 1×10⁶ cells were washed twice with cold PBS and incubated with 0.5 µg MO1-FITC and 0.5 µg MY4-RD1- PE antibodies at room temperature for 45 minutes to analyze the surface expression of CD11b and CD14 respectively. As an isotype control, cells were incubated with FITC and PE- conjugated mouse IgG1 antibodies. Cells were washed twice with ice-cold PBS. Stained cells were then resuspended in 0.5 ml PBS and analyzed by a Fluorescence Activated Cell Sorting (FACS) Calibur flow cytometer (Becton Dickenson, USA). Two-parameter analysis was performed using CellQuest software. For assessment of monocyte specific esterase (MSE), also known as non-specific esterase, smears were made by resuspending cells in 100 µl PBS and spread onto slides. The air-dried smears were fixed in formalin-acetone mixture buffer for 30 sec, then washed with distilled water and stained for 45 min at room temperature with the following solution: 8.9 ml of 67 mM phosphate buffer (pH 7.6), 0.6 ml of hexazotized pararosaniline, 1 mg/ml alpha-naphtyl acetate, and 0.5 ml ethylene glycol monomethyl ether. The percentage of MSE-stain cells was determined by counting 100 cells in triplicate.
Cell Cycle Analysis
For analysis of cell cycle distribution, treated cells were washed twice with cold PBS, fixed with 70% cold ethanol and stored at −20°C until analysis. After thawing, cells were washed twice with cold PBS and resuspended in 0.5 ml propidium iodide/ribonuclease (PI/RNase) staining buffer (BD Biosciences), incubated for 15 minutes at 37°C. Stained cells were filtered and analyzed by a FACS Calibur flow cytometer (Becton Dickinson, NJ). Analysis was performed using CellQuest™ software. For BrdU incorporation analysis, 20 µM BrdU (Sigma) was added 1 hour before harvesting treated cells. Cells were fixed as described above, pelleted and washed with cold PBS containing 1% FBS. Samples were permeabilized with 2N HCl and 0.5% Triton ×100 for 30 minutes, and neutralized with 0.1 M sodium tetraborate (pH 8.5) at room temperature. Cells were then labeled with anti-BrdU FITC conjugated monoclonal antibody (BD Biosciences) for 1 h in the dark. Stained cells were washed once with PBS containing 0.5% Tween 20 and resuspended in 0.5 mL PI/RNase staining buffer (BD Biosciences). Stained cells were filtered and analyzed for BrdU incorporation using dual color flow cytometric DNA techniques.
Cell Viability and Apoptosis Assays
MOLM-13 and OCI-AML3 cells (1×10⁵/well) were seeded in 6-well tissue culture plates and treated immediately with drugs. For quantification of apoptosis, cells were collected by centrifugation at 1500 rpm for 10 minutes at 4°C and stained with the Guava Nexin Assay™ kit as recommended by the manufacturer. Apoptotic indices were determined using the Guava Personal Cell Analyzer (Guava Technologies, CA). Three cell populations were distinguished in this assay: Non-apoptotic cells (Annexin V negative and 7-AAD negative), early apoptotic cells (Annexin positive and 7-AAD negative) and late stage apoptotic cells (Annexin positive and 7-AAD positive). Another aliquot of cells was used for assessment of cell viability by Trypan blue exclusion. For the Caspase-Glo 3/7 Assay™, MOLM-13 cells (1×10⁴) were seeded per well in clear bottom 96-well tissue culture plates, and treated immediately with drugs at the indicated time points. Cells were lysed and processed according to the manufacturer’s protocol (Promega, #G8091). For the Fluorimetric TdT-mediated dUTP Nick-End Labeling (TUNEL) Assay™, cells (2×10⁶) were seeded in 75 cm2 flasks and treated immediately with drugs at the indicated time points. The manufacturer’s protocol (Promega, #G3250) was used for determination of TUNEL-stained cells by flow cytometry.
RNA Interference Experiments
Approximately 3×10⁶ OCI-AML3 cells were suspended in 100 µl of solution L (Amaxa™) and nucleofected with 10 nM non-targeting negative control human small interference RNA (siRNA, Dharmacon, D-001810-01-20), 10 nM human BCL-2 siRNA (Dharmacon, D-003307-04) or 10 nM human PIG-6 siRNA (Ambion silencer select, s11219), with an Amaxa™ nucleofector device. The target sequence of human Bcl-2-specific siRNA were 5’-AGAUAGUGAUGAAGUACAU; The sequences of the human PIG-6-specific siRNA were 5’-GGACAGAGGCUAUUCAACATT and 3’-UGUUGAAUAGCCUCUGUCCTA . Cells were then transferred to a 12-well plate containing 2 ml of prewarmed media for 24 h before exposure to drugs.
Quantitative Real-time PCR
Total cellular RNA was extracted from cells using RNeasy Mini kit (Qiagen) and treated with RNase-free deoxyribonuclease, following the manufacturer’s protocol. Total RNA (2 µg) was incubated with a reverse transcription mix (Applied Biosystems, Foster City, CA) containing 25 mM MgCl2, PCR Buffer II, deoxyribonucleotide triphosphate (dNTP) mixture (2.5 mM each), 50 µM random hexamers, RNAse Inhibitor and 50U/µl MultiScribe reverse transcriptase. The parameters for reverse transcription were as follows: 40 cycles of 25°C for 10 min followed by 42°C for 30 min and 98°C for 5 min. Complementary DNA (cDNA, 200–400 ng) was used for quantitative PCR with the Taqman™ 2X PCR Master Mix on an Applied Biosystems 7900 Real-Time PCR System following the manufacturer's instructions. Triplicate RT experiments were done for each gene and the relative amount of transcript was normalized to 18S rRNA. Specific primer/probe sets for BCL-2 and PIG-6 in 20X expression assays (Applied Biosystems, Hs00608023_m1 and Hs00275205_m1 respectively) were used for quantitative RT-PCR. The parameters for PCR were as follows: 40 cycles of 50°C for min, 95°C for 10 min, and 95°C for 15 sec and 60°C for 1h. The Ct value, the cycle number at which signal fluorescence surpassed fluorescence background noise, was recorded, and relative fold values were calculated based on the equation 2−ΔΔCt, where ΔΔCt = ΔCt treated − ΔCtcalibrator (vehicle or drug-treated samples). To determine p53 target expression level, cDNAs were subjected to quantitative real time polymerase chain reaction (qPCR) with Taqman™ low density array microfluidic cards. These cards contain Taqman™ gene expression assays for 90 targets and three internal controls (Supplementary Table S1).
Statistical Analysis
Each data point represents the mean and standard deviation of at least three independent experiments. The significance of differences between indicated data groups was assessed by the Student t-test.
RESULTS
1,25D induces differentiation of human AML cells expressing wild-type p53
Numerous studies have shown that 1,25D can induce differentiation of leukemia cells with p53-mutant or p53-null status (14, 15). However, there are no published reports of vitamin D effects in cancer cells expressing wild-type p53, raising the possibility that wild-type p53 status is not compatible with vitamin D-induced differentiation. Therefore, we investigated the effect of 1,25D on AML cell lines expressing wild-type p53. For these experiments, we chose human AML cell lines MOLM-13 (AML M5 subtype) and OCI-AML3 (AML M4 subtype) expressing wild-type p53, and for comparison HL60 (AML M2 subtype) and THP-1 (AML M5 subtype), p53-null cell lines. Experiments with HL60 and THP-1 cells indicated that vitamin D-induced expression of cell surface differentiation markers in these cell lines were similar. However, HL60 cells were chosen for comparative in depth studies with p53-expressing AML cells because our laboratories have documented that vitamin D derivatives have most striking effects on this cell line. In initial experiments the cells were incubated with 1, 10 or 100 nM 1,25D for 48 h and the expression of CD11b and CD14 myeloid differentiation markers was analyzed by flow cytometry. 1,25D induced the surface expression of CD11b and CD14 in a dose- and time-dependent manner on all three cell lines (Fig. 1A and B). The monocyte specific esterase (MSE) was expressed on both MOLM-13 & OCI-AML3 cells not exposed to 1,25D, whereas expression of this cytoplasmic differentiation marker was minimal in HL60 cells. Nonetheless, MSE expression increased in a dose-dependent manner in all cell lines studied (Fig. 1A). Exposure of HL60 cells to 10 nM 1,25D for 48 h caused approximately 50% of the cell population to flatten and adhere to culture vessels, and the non-adherent cells remained as single-cell suspension or aggregates of variable sizes. In contrast, only 10–20% of the total population of MOLM-13 & OCI-AML3 cells remained attached to flasks with the majority of cells remaining in single cell suspension or aggregates. The timedependent increase in expression of CD11b and CD14 on HL60 and OCI-AML3 cells displayed a similar pattern; in that approximately 80% of the cells were CD14-positive within 24 h which was sustained at 48 and 72 h. However, the population of HL60 cells expressing CD-11b was significantly (p< 0.01) greater and continued to increase with time when compared with MOLM-13 and OCI-AML3 cells (Fig. 1B). In contrast, approximately 60% of MOLM-13 cells were positively stained for CD14 at 24 and 48 h, which was slightly reduced to 50% at 72 h. Trypan blue exclusion test indicated that cells were viable throughout the duration of the treatment (Supplementary Fig. S1). Since MOLM-13 and OCI-AML3 cells were responsive to 1,25D, this indicated that expression of wild-type p53 is compatible with 1,25D-induced differentiation. Therefore, we used these cell lines to study the interaction between 1,25D and nutlin-3a, as previous studies have shown that MDM2 antagonists require wild-type p53 for activity (27).
Figure 1.
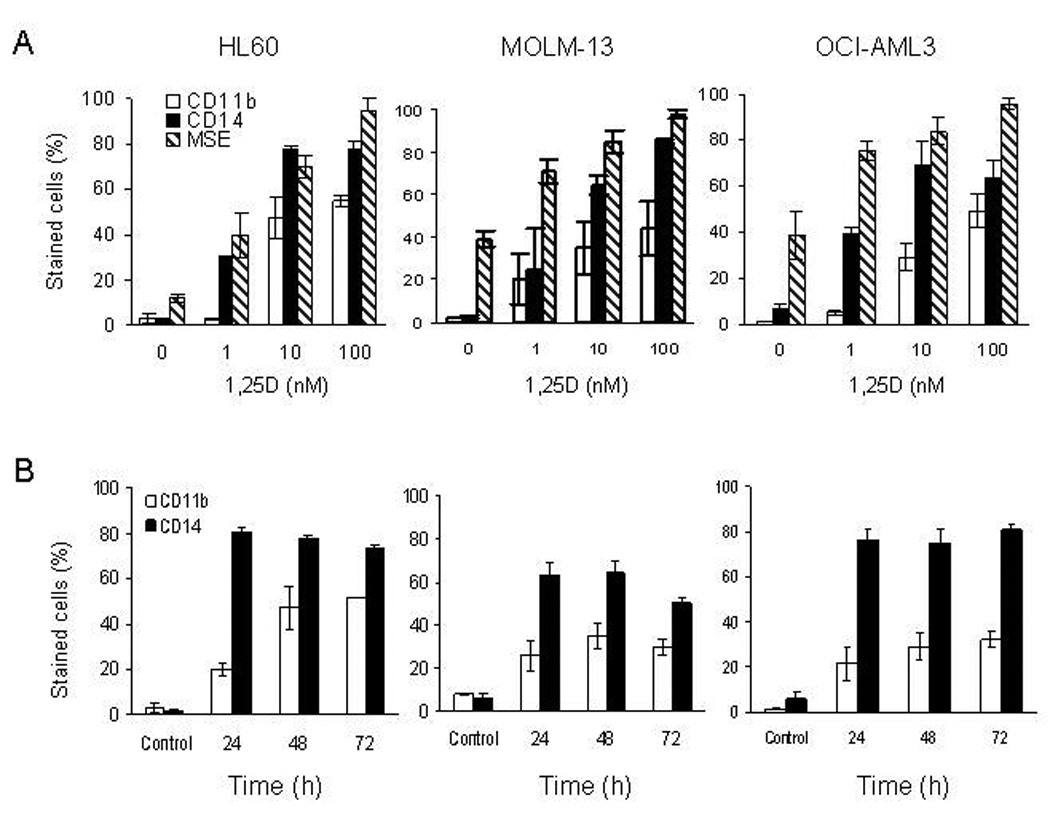
1,25D induces monocytic differentiation in p53-expressing and p53-null AML cells. A. Exponentially growing HL60, MOLM-13 and OCI-AML3 cells were exposed to 1, 10 and 100 nM 1,25D for 48 h. B. All three cell-lines were exposed to 10 nM 1,25D at the stated time. Treated cells were stained with anti-CD11b-FITC and anti-CD14-PE and assessed for surface expression by flow cytometry. Duplicate samples of treated cells were also stained for cytoplasmic monocyte specific esterase (MSE) and quantified by microscopy. The percentage of MSE-positive cells was determined by counting 100 cells in triplicate. The bars represent average values ± SD of three independent experiments, with duplicate data points.
Nutlin-3a activates p53 in MOLM-13 and OCI-AML3 cells leading to cell cycle arrest and apoptosis
Nutlin-3a is a small molecule which binds to MDM2, thereby preventing the ubiquitin-dependent degradation of p53. Accumulation of p53 enables the transcriptional activation of genes which induce cell cycle arrest and/or apoptosis. For these experiments, exponentially growing cells were exposed to 10 µM nutlin-3a for 2 to 24 h and whole cell lysates were analyzed for protein levels of p53 and its transcriptional targets, p21 and MDM2. Exposure of MOLM-13 & OCI-AML3 cells to nutlin-3a led to stabilization and accumulation of p53 in a time-dependent manner. The protein level of the p53 targets, MDM2 and p21, increased during time of treatment (Fig. 2A). In MOLM-13 cells, the drop of MDM2 and p21 protein levels beyond 8 h and that of p53 beyond 12 h is a likely consequence of degradation as cells undergo apoptosis. This was demonstrated by the activation of caspase-3, with the concomitant cleavage of PARP evident beyond 8 h in MOLM-13 cells. Assays for early apoptosis (caspase-3/7 activation) and late stage apoptosis (TUNEL assay) confirmed that nutlin-3a induces apoptosis in MOLM-13 cells (Supplementary Fig. S1B). Incorporation of BrdU revealed that nutlin-3a induced G1 and G2/M cell cycle arrest in OCI-AML3 cells (Fig. 2B). We then tested MOLM-13 and OCI-AML3 cells for apoptosis by the Annexin V assay. Exposure of exponentially proliferating cells to 10 µM nutlin-3a, but not the inactive enantiomer, nutlin-3b, for 5 to 48 h, led to an increase in Annexin V- positive cell fraction (Fig. 2C and D). However, a marked difference in response to nutlin was observed. MOLM-13 cells were more sensitive with 80% of the cell population undergoing apoptosis at 24 h. OCI-AML3 cells were relatively slow to respond to nutlin-3a with only 18% of the cell population undergoing apoptosis at 24 h but increased to 80% after 48 h. Nutlin-3b, the inactive form of nutlin-3a (10), did not cause cell death in both cell lines (Fig. 2C and D).
Figure 2.
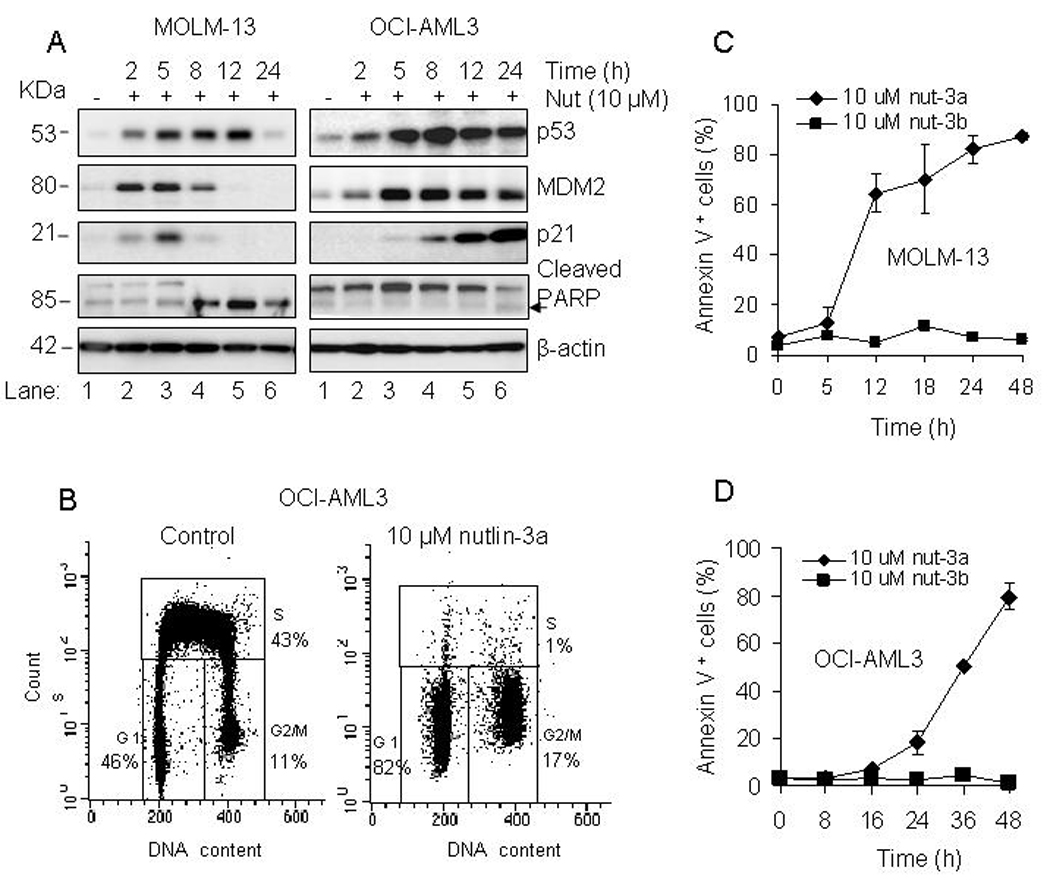
Nutlin-3a activates the p53 pathway in MOLM-13 and OCI-AML3 cells. A. MOLM-13 and OCI-AML3 cells were incubated with 10 µM nutlin-3a at the indicated time, and the relative protein levels of p53, MDM2, p21, and PARP were analyzed in whole cell lysates by Western blotting. B. OCI-AML3 cells were incubated with 10 µM nutlin-3a or vehicle (DMSO) for 24 h and labeled with 20 µM BrdU during the last hour for analysis of cell cycle distribution. C and D. MOLM-13 and OCI-AML3 were incubated with 10 µM nutlin-3a, 10 µM nutlin-3b for 5 to 48 h and the fraction of Annexin V positive - stained cells was determined with a Guava Nexin™ Kit. The bars represent average values ± SD of three independent experiments, with duplicate data points.
1,25D accelerates the onset of nutlin-induced apoptosis in AML cells
The OCI-AML3 cells showing lower sensitivity to nutlin-3a than MOLM-13 cells, were used to determine the optimal conditions for combination studies. In comparison with nutlin-3a (5 and 10 µM) or 1,25D (0.1, 1 and 10 nM) alone, the combination of both agents markedly enhanced apoptotic cell death in OCI-AML3 cells (Fig. 3A). Most prominent was the combination of 10 µM nutlin-3a with all three concentrations of 1,25D (Fig. 3A, groups 3, 6, 9 and 12), when compared with nutlin- 3a or 1,25D alone (Fig. 3A, groups 3, 4, 7, 10). Western blot analysis revealed that both concentrations of nutlin-3a upregulate p53 whereas 1,25D has no effect on p53 protein levels (Fig. 3B). Most notable was the high level of PARP cleavage in the combination of 10 nM 1,25D and 10 µM nutlin-3a (Fig. 3B). For further studies, OCI-AML3 cells were exposed to 10 nM 1,25D for 48 h and 10 µM nutlin-3a was added during the last 2 to 24 h. The apoptotic response to nutlin-3a alone was minimal at 24 h, but the addition of 1,25D increased the apoptotic fraction to approximately 40% (Fig. 3C and 4A). The most prominent morphological change observed was membrane blebbing, which is associated with cell injury and death (data not shown). Similarly, 1,25D enhanced the apoptotic effect of nutlin-3a in MOLM-13 cells. At 12 hours, 1,25D increased the percentage of apoptotic cells from approximately 50% to 70% (Fig. 3D), and at 24 hours, from 76% to 96% (Fig. 4B).
Figure 3.
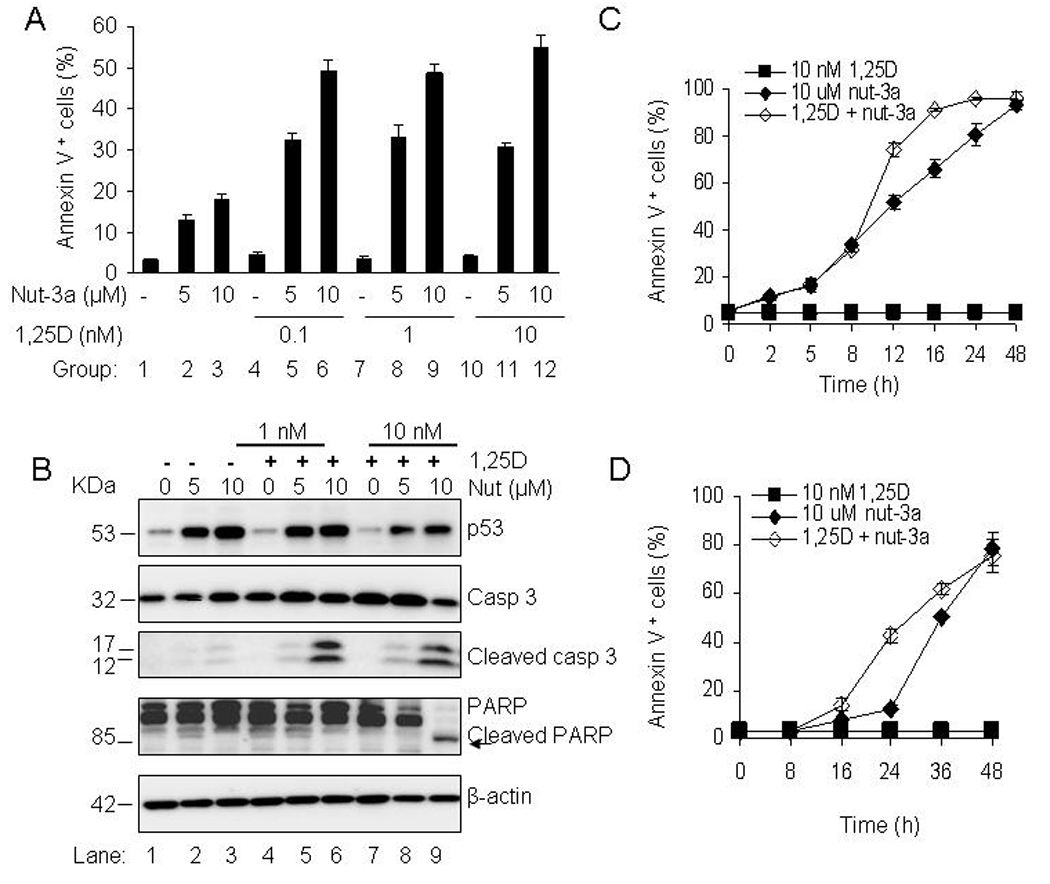
1,25D accelerates the onset of apoptosis by nutlin-3a in AML cells. A. OCI-AML3 cells were exposed to 0.1, 1 and 10 nM 1,25D for 48 h and nutlin-3a (5 and 10 µM) was added during the last 24 h. Cells were also exposed to single agents; 1,25D (0.1, 1, 10 nM) for 48 h and nutlin-3a (5, 10 µM) for 24 h. The percentage of Annexin V- positive cells was assessed with a Guava Nexin™ Kit. The bars represent average values ± SD of two independent experiments, with duplicate data points. Comparison of group 2 with groups 5, 8 and 11, and group 3 with groups 6, 9 and 12 all showed significant differences with p<0.05. P values were determined by Student t-test. B. OCI-AML3 cells were incubated with 1 and 10 nM 1,25D for 48 h and 5 µM or 10 µM nutlin-3a was added during the last 24 h. Cells were also incubated with single agents; 1,25D (1, 10 nM) for 48 h and nutlin-3a (5, 10 µM) for 24 h. The relative protein levels of p53, caspase-3 and PARP in whole cells lysates were analyzed by Western blotting, with β-actin as the loading protein. C and D. OCI-AML3 and MOLM-13 cells were incubated with 10 nM 1,25D for 48 h and 10 µM nutlin-3a was added during the last 2–48 h. Annexin V-positive cell fraction was determined with the Guava Nexin™ Kit. The bars represent average values ± SD of three independent experiments, with duplicate data points.
Figure 4.
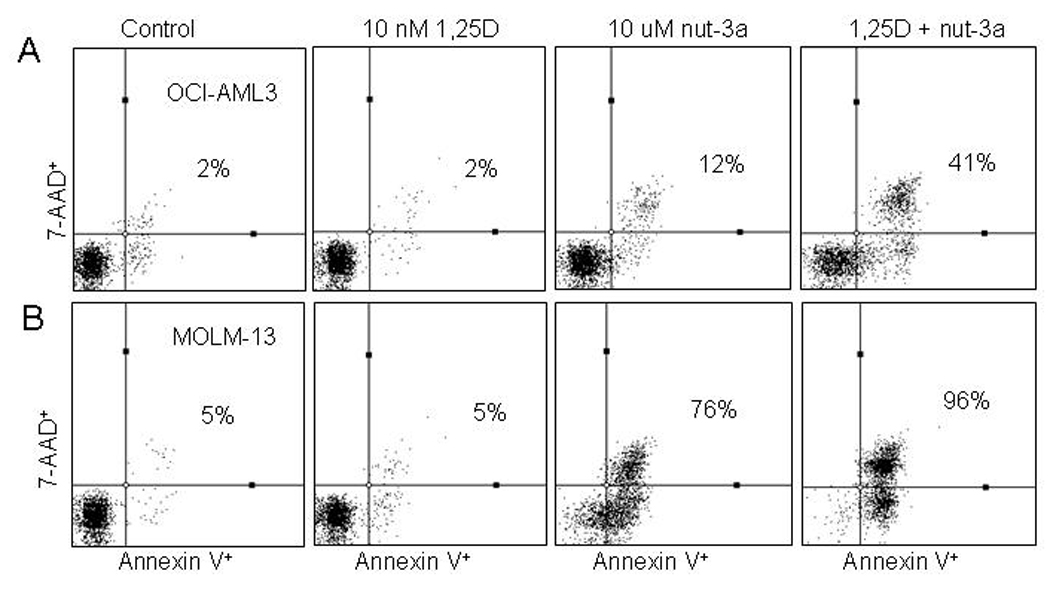
1,25D accelerates the onset of nutlin-induced apoptosis in OCI-AML3 and MOLM-13 cells. A and B. Cells were incubated with 10 nM 1,25D for 48 h followed by 10 µM nutlin-3a during the last 24 h or single agents: 10 nM 1,25D for 48 h and 10 µM nutlin-3a for 24 h. The total fraction of Annexin V- positive cells (early and late apoptotic cells) was determined using the Guava Nexin™ Kit and displayed as a dot-plot in a quadrant marker.
1,25D enhances nutlin-induced downregulation of BCL-2 and upregulation of PIG-6 in OCI-AML3 cells
In order to examine the underlying mechanisms of the earlier onset of apoptosis in 1,25D and nutlin-treated OCI-AML3 cells, we determined the expression of multiple p53-targeted genes in cells exposed to 1,25D, nutlin-3a or both. For quantification of differentially expressed genes, we used Low Density Array (LDA) PCR cards. These microfluidic cards contained primer/probe sets for 77 genes from the p53 pathway with roles in cell cycle regulation and apoptosis and 3 endogenous controls [18S ribosomal RNA, Glyceraldehyde 3-phosphate dehydrogenase (GAPDH) and β-actin]. Two independent experiments showed that 3 out of 77 genes (survivin, BCL-2 and PIG-6) changed their expression greater than 2-fold in combination-treated cells versus 1,25D or nutlin-3a alone (Supplementary Table S1). The change in the expression of survivin was not studied in depth as it is strictly dependent on cell cycle distribution and changes during cell cycle arrest (28). The other two genes were examined using individual primer/probe sets. Three independent experiments revealed that BCL-2 transcripts which were downregulated by nutlin-3a alone at 16 h were decreased further by 1,25D (Fig. 5A). Statistical analysis confirmed the significant reduction of BCL-2 by 1,25D. 1,25D alone had no effect on the transcriptional expression of BCL-2 in this cell line. Samples were also analyzed for expression of PIG-6 by quantitative RT-PCR. 1,25D alone had no effect on PIG-6 expression, but nutlin-3a treatment produced a time-dependent upregulation of PIG-6. PIG-6 was further elevated by 1,25D in nutlin-treated OCI-AML3 cells at all indicated time-points (Fig. 5B), with a significant enhancement of expression at 16 h. Further experiments, using a PIG-6 primer/probe sets confirmed this finding. Western blot analysis revealed approximately 50% reduction in BCL-2 protein in 1,25D and nutlin-3a treated samples, but 1,25D or nutlin-3a as single agents had no effect on the protein level of BCL-2. (Fig. 5C, Supplementary Table S2). Bax protein levels were unchanged in all treated groups. 1,25D alone had no effect on PIG-6 protein level, however a modest increase of PIG-6 was observed with nutlin-3a alone. The addition of 1,25D increased the protein level approximately 2-fold at an early time-point of 8 h, which was not observed at the later time-points (Fig. 5C). A possible explanation is that PIG-6 is a transcriptionally and post-transcriptionally-regulated gene; therefore the induction of gene expression presented in Fig. 5B did not correlate with its protein level (Fig. 5C). It is also possible that the commercially available antibody does not detect robust protein changes well, as shown in the Supplementary Table S3A.
Figure 5.
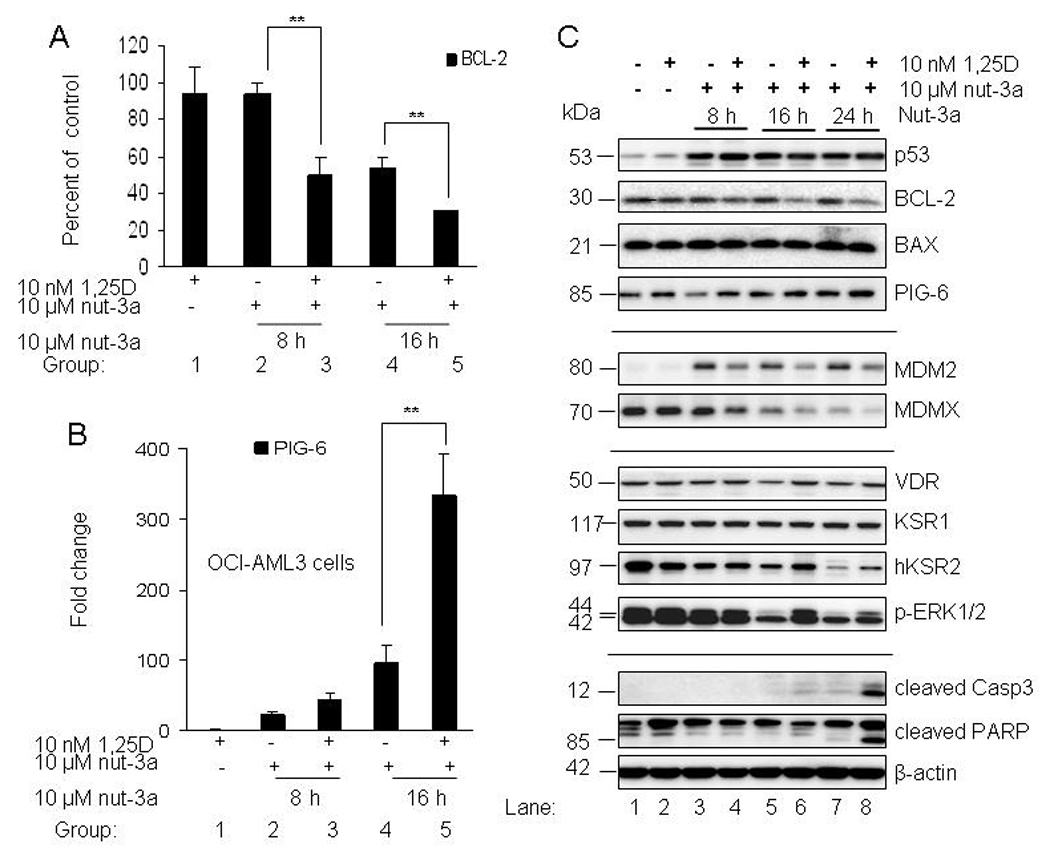
1,25D enhances the downregulation of BCL-2 and elevation of PIG-6 in OCI-AML3-cells. A. OCI-AML3 cells were incubated with 10 nM 1,25D for 48 h and 10 µM nutlin-3a was added during the last 8, 16 and 24 h. Cells were also exposed to single agents; 10 nM 1,25D for 48 h and 10 µM nutlin-3a at the indicated time points. Treated cells were lysed, total RNA isolated and converted to cDNA. Quantitative real time PCR was used to analyze transcriptional expression of BCL-2 relative to basal level, at the indicated time points. B. Transcriptional expression of PIG-6 relative to basal level, at the indicated time points was determined by quantitative PCR. The bars represent average values ± SD from three independent experiments, with PCR reactions of triplicate wells. P values were determined by Student t-test, where ** indicates p<0.05. C. For Western blotting, proteins extracted from samples were resolved in 4–20% SDS-PAGE, transferred to PVDF membranes and incubated with the indicated antibodies.
We further examined the combination of 1,25D and nutlin-3a on their respective signaling pathways (Fig. 5C). Although the protein level of p53 was not increased in the presence of 1,25D; the p53 target MDM2 accumulated in nutlin-treated samples (lanes 3, 5 and 7). The combination of 1,25D with nutlin-3a caused a subtle reduction of MDM2 protein level (lanes 4, 6 and 8). Elevated MDM2 is the likely cause of decrease in MDMX protein through enhanced proteasomal degradation (lanes 3, 5 and 7), as previously shown (29). 1,25D caused further reduction of MDMX protein at all time-points (lanes 4, 6 and 8). The mechanism behind the 1,25D-mediated reduction of MDMX will require further studies as there is accumulating evidence of a complex relationship amongst p53, MDM2 and MDMX proteins. No significant change in the VDR protein was observed. There were no change in KSR-1 protein level, but hKSR2 was reduced by nutlin-3a in a time-dependent manner (lanes 3, 5 and 7). Most notable was the reduction of phosphorylated ERK1/2 by nutlin-3a which was less reduced in the presence of 1,25D. Calculated optical densities of these key proteins are shown in Supplementary Table S2. The last panel of immunoblots shows marked activation of caspase 3 and PARP cleavage in 1,25D & nutlin-treated OCI-AML3 cells (lane 8) sensitized to apoptosis by 1,25D at 24 h.
Effect of BCL-2 and PIG-6 modulation by siRNAs on the apoptotic index of OCI-AML3 cells
We have identified several possible contributors to the accelerated nutlin response: downregulation of survival proteins BCL-2, MDMX, hKSR2, p-ERK1/2 and enhanced upregulation of pro-apoptotic PIG-6. Since the role of hKSR2 and p-ERK1/2 in 1,25D-induced differentiation was already described (30), we focused on the effect of modulating the protein levels of BCL-2 and PIG-6 during 1,25D and nutlin-induced apoptosis by RNA interference. It has been reported that p53 transcriptionally represses cell survival genes such as BCL-2, leading to induction of apoptosis (31). We knocked down BCL-2 by nucleofecting cells with 10 nM specific BCL-2 siRNAs and examined its effect on the apoptotic index of OCI-AML3. Cells were exposed to 10 nM 1,25D for 48 h and 10 µM nutlin-3a was added during the last 24 h. Samples were analyzed for BCL-2 mRNA expression and the percentage of Annexin V-positive cells. Although approximately 93% reduction of BCL-2 message level was measured by qPCR the value is likely inaccurate as cell viability was compromised by the BCL-2 knockdown even in control cells (Fig. 6A, (group 5). This was not surprising as these cells rely on BCL-2 family members for survival (based on the high basal protein level as well as published work by Kojima et al., (32). In a reduced BCL-2 background, nutlin increased apoptotic cell death (Fig. 6A, group 7). However, nutlin and 1,25D combination further increased the apoptotic index in the BCL-2 knockdown cells, suggesting that the reduction of BCL-2 protein is a likely contributor to the enhanced apoptosis. For example, at 24 h Annexin V positivity was significantly increased from 60% to 80% (Fig. 6A, groups 4 and 8).
Figure 6.
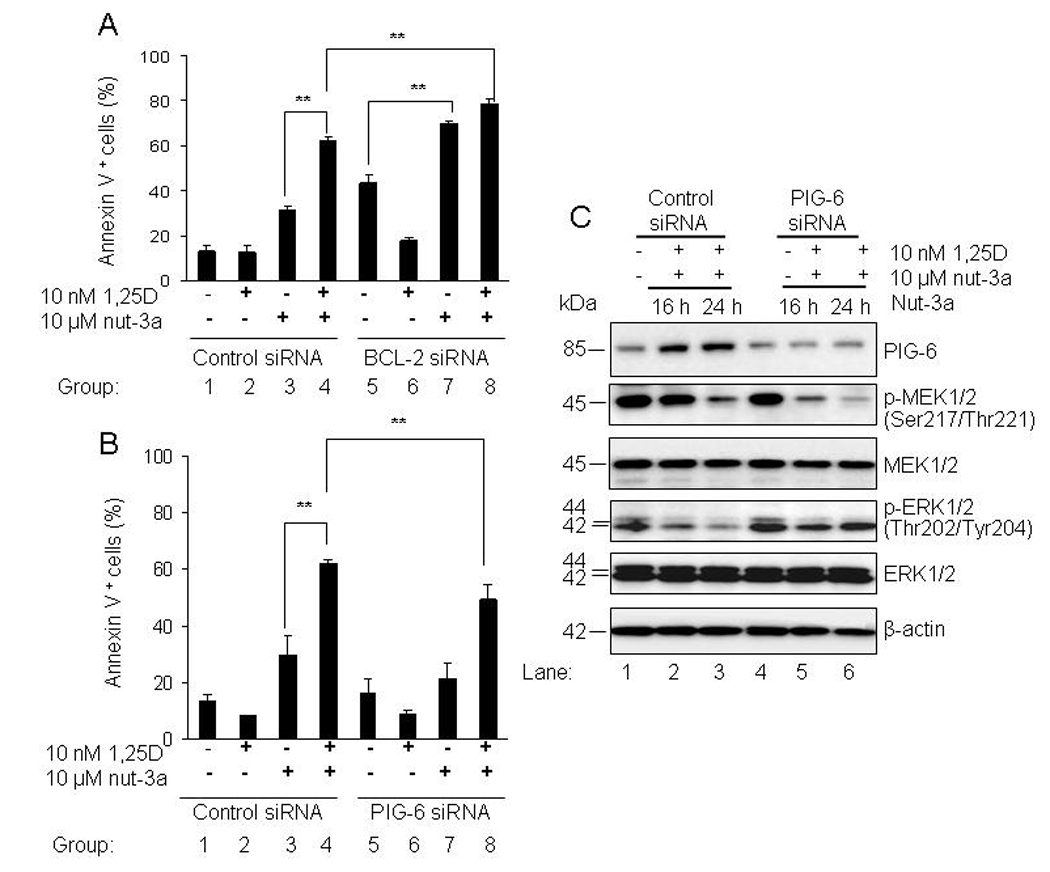
Differential effects of BCL-2 and PIG-6 siRNAs on the apoptotic index and down stream proteins in OCI-AML3 cells. A and B. For transfection studies, OCI-AML3 cells were nucleofected with 10 nM non-targeting negative control, BCL-2 or PIG-6 siRNAs for 24 h. Cells were washed once with warm medium and then exposed to 10 nM 1,25D for 48 h followed by 10 µM nutlin-3a during the last 16 and 24 h. Cells were also exposed to single agents; 10 nM 1,25D for 48 h and 10 µM nutlin-3a for 16 and/or 24 h. The percentage of total fraction of Annexin V- positive cells was determined using the Guava Nexin™ Kit. The bars represent average values ± standard deviation of three independent experiments, with duplicate data points. P values were determined by Student t-test, where ** indicates p<0.05. C. For Western blotting, proteins extracted from nucleofected samples were resolved in 4–20% SDS-PAGE, transferred to PVDF membranes and incubated with the indicated antibodies. MEK1/2, ERK1/2 and β-actin proteins were the loading controls for the immunoblot.
For PIG-6 knockdown, OCI-AML3 cells were transfected with 10 nM control non-targeting and PIG-6 siRNAs by nucleofection. We then investigated the effect of siRNA-mediated knockdown of PIG-6 on the apoptotic index and on possible downstream mediators of PIG-6. OCI-AML3 cells were exposed to 10 nM 1,25D for 48 h and 10 µM nutlin-3a was added during the last 16 and 24 h. PIG-6 siRNA was effective at reducing 1,25D and nutlin-induced expression of PIG-6 by 50% (Figure 6C and Table S3A). The reduction of PIG-6 significantly decreased the apoptotic index of cells treated with combined agents for 24 h (Fig. 6B, groups 4 and 8), suggesting that enhanced PIG-6 upregulation by 1,25D contributes to the observed apoptotic effects. The apoptotic cell fraction dropped from 60%, in the combination to 45% in the presence of the PIG-6 siRNA. It was reported by Liu, et al., (33) that upregulation of PIG-6 reduces p-MEK1/2 and p-ERK1/2 in human colon cancer cells. The representative immunoblot and calculated optical densities (Supplementary Tables S2 and 3B, 3C) revealed a reduction in the phosphorylated forms of MEK1/2 and ERK1/2 when PIG-6 is upregulated by 1,25D and nutlin-3a. In addition, siRNA-induced down regulation of PIG-6 was sufficient to restore phosphorylated ERK1/2 to its basal level but phosphorylated MEK remained downregulated.
DISCUSSION
Since in many patients the AML blasts have wild-type p53 (34), any consideration of the use of vitamin D derivatives for treatment of these patients requires a demonstration that such blasts can respond to these compounds. Thus, it is important, as shown here, that AML cells expressing wild-type p53 can be terminally differentiated by exposure to 1,25D, as previously shown for cells with mutated or deleted p53 (14, 15, 35). In the presence of 1,25D, MOLM-13 and OCI-AML3 cells expressed the classical differentiation markers similar to that of HL60 cells (14, 15, 20, 36), indicating that p53 status does not interfere with the ability of 1,25D to activate vitamin D signaling and induce differentiation. Our model cell system utilized AML cells with expression of normal endogenous levels of p53, which is selectively activated by nutlin-3a. In contrast, Chylicki et al., (37) used a model in which a temperature-inducible form of p53 was transfected into U937 cells. Since p53 is normally expressed at very low levels, their system may not accurately reflect the dynamic changes and functions of cellular p53.
MDM2 antagonists, the nutlins, are a novel class of small molecules that selectively activate the p53 pathway to induce apoptosis and may offer a new treatment modality for patients with AML (9). Here, we have studied the effect of combining the pro-apoptotic MDM2 antagonist, nutlin-3a, with the differentiating agent 1,25D in AML cells expressing wild-type p53, MOLM-13 and OCI-AML3. Addition of 1,25D to nutlin resulted in accelerated apoptotic response in both cell lines (Fig. 3C, 3D, 4A and 4B). We have identified possible contributors to this enhanced apoptotic effect: the downregulation of anti-apoptotic BCL-2, MDMX, hKSR2, p-ERK1/2, and the enhanced upregulation of PIG-6 by nutlin and 1,25D combination. BCL-2 is overexpressed in OCI-AML3 cells; siRNA-mediated knockdown of BCL-2 was sufficient to induce apoptosis in the absence of 1,25D or nutlin-3a (Fig. 6A). This led to enhanced apoptosis induced by nutlin alone or nutlin in combination with 1,25D (Fig. 6A). BCL-2 proteins localize on mitochondria and smooth endoplasmic reticulum, dimerize with BCL-W, BCL-XL, or MCL-1 to from multi-domain complexes with pro-apoptotic BAX and Bak (38). Therefore, therapeutic intervention which could lower the expression of BCL-2 would be beneficial for the patient by enhancing the action of cell death-inducing agents.
In the presence of 1,25D, the protein levels of p53 regulators MDM2 and MDMX dropped significantly (Fig. 5C). MDMX downregulation could also contribute to the overall apoptotic response. Both MDM2 and MDMX are not known as 1,25D targets but there is emerging evidence that mitogenic signaling pathways regulate cellular localization of p53. Studies by Kojima et al., (39) demonstrated that a MEK inhibitor and nutlin-3a sensitize AML cells to apoptosis due to transcriptional activation of p53 target genes in the nucleus.
Another downstream target of p53 is pro-apoptotic PIG-6, also referred to as proline dehydrogenase (PRODH) and proline oxidase-2 (POX2), that is localized on the inner mitochondrial membrane. Polyak et al., (40) used serial analysis of gene expression (SAGE) to demonstrate that PIG-6 is a p53-induced gene. At low levels, the enzyme couples the oxidation of NADPH to mitochondrial electron transport, and thus provides cells with ATP. At high levels, PIG-6 activates oxidative apoptosis by generating reactive oxygen species (ROS) such as superoxides. These oxygen radicals are known to damage cellular components such as DNA, protein, lipids. Other groups have demonstrated that overexpression of PIG-6 in a variety of cancer cell types induces apoptosis in a p53-dependent manner (41). Induction of PIG-6 has been shown to reduce phosphorylated levels of MEK1/2 and ERK1/2 during p53-induced oxidative apoptosis in solid tumor cell lines (33, 41). Therefore, reduced levels of phospho MEK1/2 and ERK1/2 in our experiments may be a consequence of PIG-6 induction (FIG. 6C) and activation of p53, but this remains to be further investigated.
Our results indicate that various cellular events may contribute to apoptosis in 1,25D and nutlin-3a- treated OCI-AML3 cells. It is well documented that the MAPK family proteins are activated during 1,25D-induced differentiation of AML cells with mutant or non-functional p53 (14, 15, 36). 1,25D also increases survival in HL-60 cells and other p53-null cells by upregulation of p21, p27, p35, p-ERK1/2 and hKSR2 (16, 17, 30, 42, 43). In addition, the MEK/ERK pathway is known to promote growth and to prevent apoptosis in hematological malignancies such as AML (44). Both MOLM-13 and OCI-AML3 cell lines constitutively express phosphorylated ERK1/2 due to the aberrant expression of mutant FLT3 (45). Western blot analysis depicted the reduction of p-MEK and p-ERK by nutlin-3a alone whereas 1,25D had no effect on the phosphorylated levels of these proteins under the conditions studied here (data not shown). Upon combination with 1,25D, the level of p-ERK1/2 remained reduced when compared with basal level (Fig. 5C and Fig. 6C). One can speculate that sustained repression of p-ERK1/2 in the presence of 1,25D could be due to induced levels of PIG-6. Human KSR2 was also further reduced by 1,25D in nutlin-3a-treated cells during apoptosis. Since hKSR2 appears to function as a survival protein, one could expect a p53 activator such as nutlin-3a to inhibit its expression. Wang et al., (30) demonstrated that siRNA knockdown of hKSR2 sensitized arabinocytosine-treated HL60 cells to undergo apoptosis.
Our data suggest that several factors contribute to the sensitization of OCI-AML3 cells to apoptosis when exposed to 1,25D and nutlin-3a. These are BCL-2, MDMX, phosphorylated ERK1/2, hKSR2 and PIG-6. One possibility is that 1,25D recruits its co-activators steroid receptor coactivator-1 (SRC-1) and vitamin D receptor interacting protein (DRIP) 205 to response elements in the p53 promoter thereby enabling p53 to be more effective at inducing cell death.
The use of 1,25D for treatment of AML is limited due to hypercalcemia, hence deltanoids devoid of this undesirable side effect are being developed. Preclinical work on cultured cells and in animals demonstrated that differentiation induced by 1,25D and its analogs can be markedly increased by combination with plant-derived antioxidants, such as carnosic acid extracted from Rosemarinus officinalis (46, 47). Ongoing studies also indicate synergistic or additive antiproliferative effect of 1,25D and chemotherapeutic agents in various solid tumors (48, 49, 50). Our study suggests that vitamin D may enhance the activity of a novel class of antitumor agents, the MDM2 antagonists.
Supplementary Material
ACKNOWLEDGEMENTS
We thank Dr. Milan Uskokovic, BioXell, Nutley, NJ, for the gift of 1,25α-dihydroxyvitamin D3. This study was partially supported by NIH grants from the National Cancer Institute (RO1-CA-44722-20) to GPS.
Grant Support: # RO1-CA-44722-20/CA/NCI NIH/United States for George P. Studzinski
Abbreviations
- 1,25D
1,25 dihydroxyvitamin D3
- BCL-2
B-cell CLL/lymphoma 2
- PIG-6
p53-induced gene-6
- XIAP
X-linked inhibitor of apoptosis
- BAX
Bcl-2–associated X
- BCL-XL
B-cell lymphoma-extra large
- MCL-1
myeloid cell leukemia sequence 1
- PARP
Poly (ADP-ribose) polymerase
- MDM2
murine double minute 2
- MDMX
murine double minute X
- MAPK
mitogen-activated protein kinase
- MEK
Mitogen-activated Protein Kinase Kinase
- ERK
extracellular signal-regulated kinase
- p90RSK
p90 ribosomal S6 kinase
- C/EBP
CCAAT-enhancer-binding protein
- Rb
retinoblastoma
- JAK2
Janus kinase 2
- Flt3
FMS-like tyrosine kinase 3
Footnotes
No potential conflicts of interest
REFERENCES
- 1.Löwenberg B, Downing JR, Burnett A. Acute Myeloid Leukemia. N Engl J Med. 1999;341:1051–1062. doi: 10.1056/NEJM199909303411407. [DOI] [PubMed] [Google Scholar]
- 2.Radomska HS, Bassères DS, Zheng R, et al. Block of C/EBP alpha function by phosphorylation in acute myeloid leukemia with FLT3 activating mutations. J Exp Med. 2006;203:371–381. doi: 10.1084/jem.20052242. [DOI] [PMC free article] [PubMed] [Google Scholar]
- 3.Tamm I, Richter S, Scholz F, et al. XIAP expression correlates with monocytic differentiation in adult de novo AML: impact on prognosis. Hematol J. 2004;5:489–495. doi: 10.1038/sj.thj.6200549. [DOI] [PubMed] [Google Scholar]
- 4.Kornblau S, Xu H, Zhang W, et al. Levels of retinoblastoma protein expression in newly diagnosed acute myelogenous leukemia. Blood. 1994;84:256–261. [PubMed] [Google Scholar]
- 5.Quentmeier H, Reinhardt J, Zaborski M, Drexler HG. FLT3 mutations in acute myeloid leukemia cell lines. Leukemia. 2003;17:120–124. doi: 10.1038/sj.leu.2402740. [DOI] [PubMed] [Google Scholar]
- 6.Smith ML, Chen IT, Zhan Q, O'Connor PM, Fornace AJ., Jr Involvement of the p53 tumor suppressor in repair of u.v.-type DNA damage. Oncogene. 1995;10:1053–1059. [PubMed] [Google Scholar]
- 7.Haupt Y, Maya R, Kazaz A, Oren M. Mdm2 promotes the rapid degradation of p53. Nature. 1997;387:296–299. doi: 10.1038/387296a0. [DOI] [PubMed] [Google Scholar]
- 8.Marine JC, Jochemsen AG. Mdmx and Mdm2: brothers in arms? Cell Cycle. 2004;3:900–904. [PubMed] [Google Scholar]
- 9.Vassilev LT. Small-molecule antagonists of p53-MDM2 binding: research tools and potential therapeutics. Cell Cycle. 2004;3:419–421. [PubMed] [Google Scholar]
- 10.Vassilev LT, Vu BT, Graves B, et al. In Vivo activation of the p53 pathway by small-molecule antagonists of MDM2. Science. 2004;303:844–848. doi: 10.1126/science.1092472. [DOI] [PubMed] [Google Scholar]
- 11.Thompson T, Tovar C, Yang H, et al. Phosphorylation of p53 on key serines is dispensable for transcriptional activation and apoptosis. J Biol Chem. 2004;279:53015–53022. doi: 10.1074/jbc.M410233200. [DOI] [PubMed] [Google Scholar]
- 12.Chipuk JE, Kuwana T, Bouchier-Hayes L, et al. Direct activation of Bax by p53 mediates mitochondrial membrane permeabilization and apoptosis. Science. 2004;303:1010–1014. doi: 10.1126/science.1092734. [DOI] [PubMed] [Google Scholar]
- 13.Norman AW, Roth J, Orci L. The vitamin D endocrine system: steroid metabolism hormone receptors, and biological response (calcium binding proteins) Endocr Rev. 1982;3:331–366. doi: 10.1210/edrv-3-4-331. [DOI] [PubMed] [Google Scholar]
- 14.Koeffler HP. Induction of differentiation of human acute myelogenous leukemia cells: therapeutic implications. Blood. 1983;62:709–721. [PubMed] [Google Scholar]
- 15.Studzinski GP, Bhandal AK, Brelvi ZS. A system for monocytic differentiation of leukemic cells HL60 by a short exposure to 1,25-dihydroxycholecalciferol. Proc Soc Exp Biol Med. 1985;179:288–295. doi: 10.3181/00379727-179-42098. [DOI] [PubMed] [Google Scholar]
- 16.Studzinski GP, Bhandal AK, Brelvi ZS. Cell cycle sensitivity of HL60 cells to the differentiation- inducing effects of 1-α,25-dihydroxyvitamin D3. Cancer Res. 1985;45:3898–3905. [PubMed] [Google Scholar]
- 17.Wang QM, Jones JB, Studzinski GP. Cyclin-dependent kinase inhibitor p27 as a mediator of the G1-S phase block induced by 1,25-dihydroxyvitamin D3 in HL60 cells. Cancer Res. 1996;56:264–267. [PubMed] [Google Scholar]
- 18.Bouillon R, Okamura WH, Norman AW. Structure-function relationships in the vitamin D endocrine system. Endocr Rev. 1995;16:200–257. doi: 10.1210/edrv-16-2-200. [DOI] [PubMed] [Google Scholar]
- 19.Wang X, Studzinski GP. Activation of extracellular signal-regulated kinases (ERKs) defines the first phase of 1,25 -dihydroxyvitamin D3-induced differentiation of HL60 cells. J Cell Biochem. 2001;80:471–482. doi: 10.1002/1097-4644(20010315)80:4<471::aid-jcb1001>3.0.co;2-j. [DOI] [PubMed] [Google Scholar]
- 20.Studzinski GP, Garay E, Patel R, Zhang J, Wang X. Vitamin D receptor signaling of monocytic differentiation in human leukemia cells: Role of MAPK pathways in transcription factor activation. Curr Top Med Chem. 2006;6:1267–1271. doi: 10.2174/156802606777864935. [DOI] [PubMed] [Google Scholar]
- 21.Wang X, Studzinski GP. Raf-1 signaling is required for the later stages of 1,25-dihydroxyvitamin D3-induced differentiation of human leukemia HL60 cells but is not mediated by the MEK/ERK module. J cell Physiol. 2006;209:253–260. doi: 10.1002/jcp.20731. [DOI] [PMC free article] [PubMed] [Google Scholar]
- 22.Michaud NR, Therrien M, Cacace A, et al. KSR stimulates Raf-1 activity in a kinaseindependent manner. Proc Natl Acad Sci USA. 1997;94:12792–12796. doi: 10.1073/pnas.94.24.12792. [DOI] [PMC free article] [PubMed] [Google Scholar]
- 23.Wang X, Studzinski GP. Kinase suppressor of RAS (KSR) amplifies the differentiation signal provided by low concentrations 1,25-dihydroxyvitamin D3. J Cell Physiol. 2004;198:333–342. doi: 10.1002/jcp.10443. [DOI] [PubMed] [Google Scholar]
- 24.Studzinski GP, Wang X, Ji Y, et al. The rationale for deltanoids in therapy for myeloid leukemia: role of KSR-MAPK-C/EBP pathway. J Steroid Biochem Mol Biol. 2005;97:47–55. doi: 10.1016/j.jsbmb.2005.06.010. [DOI] [PMC free article] [PubMed] [Google Scholar]
- 25.Wang X, Wang TT, White JH, Studzinski GP. Expression of human kinase suppressor of Ras 2 gene in HL60 leukemia cells is directly upregulated by 1, 25-Dihydroxy D and is required for optimal cell differentiation. Exp Cell Res. 2007;313:3034–3045. doi: 10.1016/j.yexcr.2007.05.021. [DOI] [PMC free article] [PubMed] [Google Scholar]
- 26.Maruyama R, Aoki F, Totota M, et al. Comparative genome analysis identifies the Vitamin D receptor gene as a direct target of p53-mediated transcriptional activation. Cancer Res. 2006;66:4574–4583. doi: 10.1158/0008-5472.CAN-05-2562. [DOI] [PubMed] [Google Scholar]
- 27.Vassilev LT. MDM2 inhibitors for cancer therapy. Trends Mol Med. 2007;13:23–31. doi: 10.1016/j.molmed.2006.11.002. [DOI] [PubMed] [Google Scholar]
- 28.Mita AC, Mita MM, Nawrocki ST, Giles FJ. Survivin: key regulator of mitosis and apoptosis and novel target for cancer therapeutics. Clin Cancer Res. 2008;14:5000–5005. doi: 10.1158/1078-0432.CCR-08-0746. [DOI] [PubMed] [Google Scholar]
- 29.Xia M, Knezevic D, Tovar C, Huang B, Heimbrook DC, Vassilev LT. Elevated MDM2 boosts the apoptotic activity of p53-MDM2 binding inhibitors by facilitating MDMX degradation. Cell Cycle. 2008;7:1604–1612. doi: 10.4161/cc.7.11.5929. [DOI] [PubMed] [Google Scholar]
- 30.Wang X, Patel R, Studzinski GP. hKSR-2, a vitamin D-regulated gene, inhibits apoptosis in arabinocytosine-treated HL60 leukemia cells. Mol Cancer Ther. 2008;7:2798–2806. doi: 10.1158/1535-7163.MCT-08-0276. [DOI] [PMC free article] [PubMed] [Google Scholar]
- 31.Miyashita T, Krajewski S, Krajewska M, et al. Tumor suppressor p53 is a regulator of bcl-2 and bax gene expression in vitro and in vivo. Oncogene. 1994;9:1799–1805. [PubMed] [Google Scholar]
- 32.Kojima K, Konopleva M, Samudio IJ, et al. MDM2 antagonists induce p53-dependent apoptosis in AML: implications for leukemia therapy. Blood. 2005;106:3150–3159. doi: 10.1182/blood-2005-02-0553. [DOI] [PMC free article] [PubMed] [Google Scholar]
- 33.Liu Y, Borchet GL, Surazynski A, Hu CA, Phang JM. Proline oxidase activates both intrinsic and extrinsic pathways for apoptosis: the role of ROS/superoxides, NFAT and MEK/ERK signaling. Oncogene. 2006;25:5640–5647. doi: 10.1038/sj.onc.1209564. [DOI] [PubMed] [Google Scholar]
- 34.Imamura J, Miyoshi I, Koeffler HP. p53 in hematologic malignancies. Blood. 1994;84:2412–2421. [PubMed] [Google Scholar]
- 35.Bhalla AK, Williams MM, Lal S, Lydyard PM. 1,25-Dihydroxyvitamin D3, but not retinoic acid, induces the differentiation of U937 cells. Clin Exp Immunol. 1989;76:274–277. [PMC free article] [PubMed] [Google Scholar]
- 36.Uphoff CC, Drexler HG. Biology of monocyte-specific esterase. Leuk Lymphoma. 2000;39:257–270. doi: 10.3109/10428190009065825. [DOI] [PubMed] [Google Scholar]
- 37.Chylicki K, Ehinger M, Svedberg H, Gullberg U. Characterization of the molecular mechanisms for p53-mediated differentiation. Cell Growth Differ. 2000;11:561–571. [PubMed] [Google Scholar]
- 38.Oltvai Z, Milliman C, Korsmeyer S. Bcl-2 heterodimerizes in vivo with a conserved homolog, Bax, that accelerates programmed cell death. Cell. 1993;4:609–619. doi: 10.1016/0092-8674(93)90509-o. [DOI] [PubMed] [Google Scholar]
- 39.Kojima K, Konopleva M, Samudio IJ, Ruvolo V, Andreeff M. Mitogen-activated protein kinase kinase inhibition enhances nuclear proapoptotic function of p53 in acute myelogenous leukemia cells. Cancer Res. 2007;67:3210–3219. doi: 10.1158/0008-5472.CAN-06-2712. [DOI] [PubMed] [Google Scholar]
- 40.Polyak K, Xia Y, Zweier JL, Kinzler KW, Vogelstein B. A model for p53-induced apoptosis. Nature. 1997;389:300–305. doi: 10.1038/38525. [DOI] [PubMed] [Google Scholar]
- 41.Donald SP, Sun XY, Hu CA, et al. Proline oxidase, encoded by p53-induced gene-6, catalyzes the generation of proline-dependent reactive oxygen species. Cancer Res. 2001;61:1810–1815. [PubMed] [Google Scholar]
- 42.Jiang H, Lin J, Su ZZ, Collart FR, Huberman E, Fisher PB. Induction of differentiation in human promyelocytic HL-60 leukemia cells activates p21, WAF1/CIP1, expression in the absence of p53. Oncogene. 1994;9:3397–3406. [PubMed] [Google Scholar]
- 43.Chen F, Wang Q, Wang X, Studzinski GP. Upregulation of Egr1 by 1,25-dihydroxyvitamin D3 contributes to increased expression of p35 activator of cyclin-dependent kinase 5 and consequent onset of the terminal phase of HL60 differentiation. Cancer Res. 2004;64:5425–5433. doi: 10.1158/0008-5472.CAN-04-0806. [DOI] [PubMed] [Google Scholar]
- 44.Milella M, Kornblau SM, Estrov Z, et al. Therapeutic targeting of the MEK/MAPK signal transduction module in acute myeloid leukemia. J Clin Invest. 2001;108:851–859. doi: 10.1172/JCI12807. [DOI] [PMC free article] [PubMed] [Google Scholar]
- 45.Matsuo Y, MacLeod RA, Uphoff CC, et al. Two acute monocytic leukemia (AML-M5a) cell lines (MOLM-13 and MOLM-14) with interclonal phenotypic heterogeneity showing MLL-AF9 fusion resulting from an occult chromosome insertion, ins (11;9) (q23; p22p23) Leukemia. 1997;11:1469–1477. doi: 10.1038/sj.leu.2400768. [DOI] [PubMed] [Google Scholar]
- 46.Danilenko M, Wang Q, Wang X, Levy J, Sharoni Y, Studzinski GP. Carnosic acid potentiates the antioxidant and pro differentiation effects of 1alpha,25-dihydroxyvitamin D3 in leukemia cells but does not promote elevation of basal levels of intracellular calcium. Cancer Res. 2003;63:1325–1332. [PubMed] [Google Scholar]
- 47.Sharabani H, Izumchenko E, Wang Q, et al. Cooperative antitumor effects of vitamin D3 derivatives and rosemary preparations in a mouse model of myeloid leukemia. Int J Cancer. 2006;118:3012–3021. doi: 10.1002/ijc.21736. [DOI] [PMC free article] [PubMed] [Google Scholar]
- 48.Hershberger PA, Yu WD, Modzelewski RA, et al. Calcitriol (1,25-dihydroxycholecalciferol) enhances paclitaxel antitumor activity in vitro and in vivo and accelerates paclitaxel-induced apoptosis. Clin Cancer Res. 2001;7:1043–1051. [PubMed] [Google Scholar]
- 49.Wietrzyk J, Milczarek M, Kutner A. The effect of combined treatment on head and neck human cancer cell lines with novel analogs of calcitriol and cytostatics. Oncol Res. 2007;16:517–525. doi: 10.3727/096504007783438330. [DOI] [PubMed] [Google Scholar]
- 50.Ma Y, Yu WD, Hershberger PA, et al. 1alpha,25-Dihydroxyvitamin D3 potentiates cisplatin antitumor activity by p73 induction in a squamous cell carcinoma model. Mol Cancer Ther. 2008;7:3047–3055. doi: 10.1158/1535-7163.MCT-08-0243. [DOI] [PMC free article] [PubMed] [Google Scholar]
Associated Data
This section collects any data citations, data availability statements, or supplementary materials included in this article.