

Abstract
Mössbauer spectroscopy was used to detect pools of Fe in mitochondria from fermenting yeast cells, including those consisting of nonheme high-spin (HS) FeII species, FeIII nanoparticles, and mononuclear HS FeIII species. At issue was whether these species were located within mitochondria or were exterior to it. None could be removed by washing mitochondria extensively with ethylene glycol tetraacetic acid or bathophenanthroline sulfonate (BPS), FeII chelators that do not appear to penetrate mitochondrial membranes. However, when mitochondrial samples were sonicated, BPS coordinated the FeII species, forming a low-spin FeII complex. This treatment also diminished both FeIII species, suggesting that all of these Fe species are encapsulated by mitochondrial membranes and are protected from chelation until membranes are disrupted. 1,10-phenanthroline (phen) is chemically similar to BPS but is membrane soluble; it coordinated nonheme HS FeII in unsonicated mitochondria. Further, the HS FeIII species and nanoparticles were not reduced by dithionite until the detergent deoxycholate was added to disrupt membranes. There was no correlation between the percentage of nonheme HS FeII species in mitochondrial samples and the level of contaminating proteins. These results collectively indicate that the observed Fe species are contained within mitochondria. Mössbauer spectra of whole cells were dominated by HS FeIII features; the remainder displayed spectral features typical of isolated mitochondria, suggesting that the Fe in fermenting yeast cells can be coarsely divided into two categories: mitochondrial Fe and (mostly) HS FeIII ions in one or more non-mitochondrial locations.
Iron serves critical roles in cell biology, generally involving catalytic and redox processes. This transition metal is found in many prosthetic groups, including hemes and iron sulfur clusters. These groups typically serve as enzyme active sites and redox centers. Dysfunction in cellular iron metabolism has been implicated in aging and in the pathogenesis of diseases involving reactive oxygen species (1). Clearly, cells need iron but they must handle it carefully to avoid being damaged by it. Deciphering how cells do this will require a better understanding of iron trafficking in cells.
Mitochondria are traffic “hubs”, used to assemble Fe/S clusters and synthesize hemes. In yeast, the FeII ions that are used as feedstock for these processes are imported into the matrix through the high-affinity inner membrane transporters Mrs3p and Mrs4p (2). The ligands coordinating these species have been hypothesized to be non-proteinaceous and of low molecular weight (3). The matrix-localized yeast frataxin homolog protein Yfh1p apparently shuttles these ions to the scaffold protein Isu1p for Fe/S assembly, and perhaps to ferrochelatase for heme biosynthesis (4).
Starting with studies by Flatmark and Tangerås (5), efforts have been made to characterize the low molecular weight mononuclear nonheme Fe species in mitochondria. By exposing the organelles to BPS, a strong chelator of mononuclear FeII ions, they estimated that ~ 25% of mitochondrial Fe is present as a chelatable or labile Fe pool.
Recent fluorescence-based studies in mitochondria from rat hepatocytes indicate a far lower concentration of chelatable Fe. Petrat et al. (6, 7) incubated cells with fluorescent indicators that accumulate in mitochondria. Fe binding causes fluorescence quenching, and so the presence of residual fluorescence in their samples indicated that the binding reaction was limited by the Fe in mitochondria rather than by the indicator. Subsequent addition of the tight-binding non-fluorescent chelator phen penetrated the mitochondria and replaced the Fe bound indicator thereby causing fluorescence recovery. The extent of recovery indicated that the concentration of chelatable Fe in rat liver mitochondria was 12 – 17 μM. The authors estimated that the chelatable Fe pool corresponded to just ~ 0.4% of the total Fe in the organelle. They attributed Tangerås’ dramatically higher estimate to adventitious Fe generated during the isolation of the organelle.
As explained by Petrat et al. (6), the fluorescence/chelator-based approach for quantifying Fe complexes in mitochondria within a cell is superior to directly measuring Fe in isolated mitochondria. This is so because cells need not be disrupted for these experiments, such that adventitious Fe is not generated. However, this approach is disruptive in another sense – it destroys the Fe complexes of interest as an inherent part of the detection process. Methods that would allow such complexes to be detected without destroying them would have a distinct advantage, as they could facilitate the eventual isolation and characterization of such complexes. Of course, any such method would be useful only if adventitious Fe could be distinguished from Fe that is functionally associated with mitochondria. In this study, we describe the use of Mössbauer spectroscopy to detect three pools of Fe in mitochondria from fermenting yeast cells, including nonheme high-spin (NHHS) FeII species, magnetically isolated (i.e non-interacting) mononuclear HS FeIII species, and FeIII nanoparticles. The major objective of this study was to establish whether these Fe-containing species are located within the mitochondria (where they might serve a metabolic role), or on the exterior of the organelle (where they would be simply artifacts of our isolation procedure, and counted as adventitiously-bound iron). Our results indicate that they are indeed located inside mitochondria.
Experimental Procedures
Cell Growth and mitochondria isolation
25L cultures of W303-1B cells were grown on Fe-deficient minimal media supplemented with 40 μM 57Fe (8). Cells were harvested at OD600 = 1.0-1.4 and then transferred to a glovebox (~6 °C, ~1 ppm O2). Mitochondria were isolated anaerobically as described (8-10), except that cells were treated with ~1000 units lyticase/g wet cells for ~50 min. Also, cells were disrupted with 20 25 strokes of the Dounce homogenizer, and a 14.5 - 18.5%-Nycodenz gradient was used. In some experiments, the re-suspension buffer contained chelators and/or dithionite (10 mM final concentration). Samples isolated with buffers that included 1 mM EGTA are referred to as EGTA-washed mitochondria. Mössbauer spectra were collected and analyzed as described (8).
Western blots were obtained using specific antibodies for cellular organelles, including mitochondrial porin (Invitrogen), the vacuolar protein carboxypeptidase Y (CPY; Invitrogen), the cytosolic protein 3-phosphoglycerate kinase (PGK; Invitrogen) and the endoplasmic reticular protein Kar2 (Santa Cruz Biotechnology). Goat anti-mouse HRP conjugate secondary antibodies (Invitrogen) were used with all primary antibodies except Kar2, which used goat anti-rabbit HRP conjugate secondary antibody (Santa Cruz Biotechnology). Thermo Scientific Enhanced Chemiluminescent (ECL) Western Blotting Substrate (Thermo Scientific) was then added. Images were obtained (FujiFilm LAS-4000mini) with a 10 sec standard exposure and the chemiluminesce setting. Images were analyzed using the MultiGuage v3.1 software.
BPS experiments
In the first and third experiments, cells were treated with buffers containing 1 mM EGTA for the initial steps, including those used to rinse the cells and for incubation with lyticase. The buffer used just prior to homogenization and in all steps thereafter contained 3 mM BPS. Past the step in which mitochondria were collected from the density gradients, all buffers included dithionite 10 mM. The mitochondrial sample was rinsed and packed into a Mössbauer sample holder which was then frozen anaerobically. Spectra were collected and the sample was thawed anaerobically and sonicated 5×15 sec with a Branson 450 sonifier at a 60% duty load using a two-step microtip. The sample was then refrozen anaerobically and the Mössbauer spectrum was re-collected. In the second and fourth experiments (Fig. 2, C and D, and Fig. S4), mitochondria were collected with EGTA in all buffers. In the step just prior to being frozen, the sample was treated with buffer containing 3 mM BPS. Dithionite was also included in the fourth experiment.
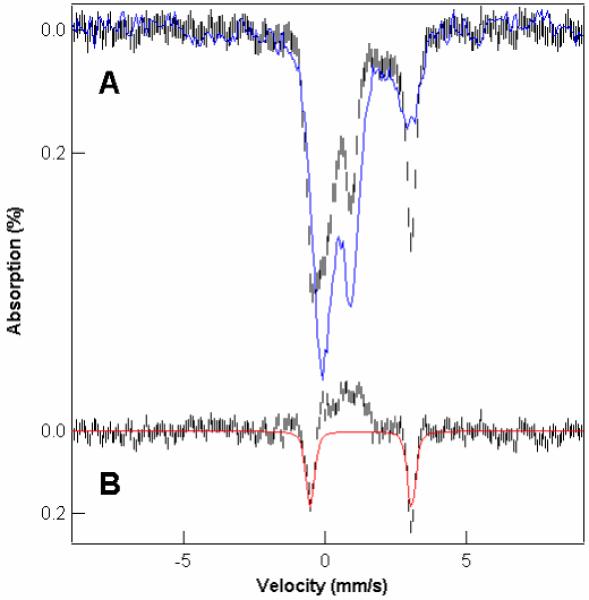
Figure 2.

Mössbauer spectra (4.5 K, 0.05 T) of BPS-washed mitochondria (Sample F6, (18)). A, before (blue line) and after (hashmarks) sonication; B, after minus-before difference spectrum; the red line in B is a simulation assuming that NHHS FeII and the central doublet Fe were converted into the FeII(BPS)3 complex. C and D are Mössbauer spectra (100 K, 0.05 T) of a second experiment using EGTA-washed mitochondria treated in the final step with BPS. C, (Sample F13, (18)) before (blue line) and after (hashmarks) sonication; D, after-minus-before difference spectrum. The red line is a simulation assuming that NHHS FeII (12% of total Fe), Fe of the central doublet (14% of total Fe) and FeIII nanoparticles (34% of total Fe) were converted into FeII(BPS)3 (60% of total Fe).
Phenanthroline experiment
EGTA-washed mitochondria were split into two aliquots; one was left untreated, the other was treated with 3 mM phen (ACROS Organics). After 30 min, both were packed into Mössbauer cups and frozen anaerobically.
Dithionite and Deoxycholate experiment
A sample of EGTA-washed mitochondria was split equally and treated with dithionite (10 mM final). One half was treated with deoxycholate (ACROS Organics) (0.5%, final). Samples were frozen after 30 min incubation in the glovebox.
Whole cells
Cells were grown on minimal media under constant shaking, and harvested at an OD600 of 1.0. Cells were collected by centrifugation at 4000×g and rinsed with unbuffered 100 μM ethylenediaminetetraacetic acid. Cells were rinsed twice with water, packed into a Mössbauer sample holder, and frozen. After collecting spectra, cells were thawed anaerobically, sonicated as above, and refrozen.
Results
All samples of mitochondria were anaerobically isolated from fermenting yeast cells. This involved numerous steps in which samples were suspended in buffer, pelleted by centrifugation, and then resuspended in fresh buffer after discarding the supernatant. We refer to these steps as washing. Mitochondria were initially washed with buffers that did not include metal chelators. Such preparations exhibited at low-temperature (4.5 K) and in weak applied magnetic fields (0.05 T) Mössbauer spectra possessing quadrupole doublets typical of nonheme high-spin (NHHS) FeII species. Such doublets had been observed in spectra of mitochondria isolated from WT respiring (lactate-grown) cells (9). The major objective of the current study was to establish whether these FeII ions were located within fermenting mitochondria, where they might serve a metabolic role, or located on the exterior of the organelle, in which case they would probably be artifacts of our isolation procedure.
Throughout these studies, mitochondrial purity was an important consideration. Western blot analysis of our isolated mitochondria indicated a ~ 30× enrichment of the mitochondrial porin relative to the amount present in cell extracts (Fig. S1). In fermenting cells, mitochondria occupy ~ 3% of the cellular volume (11), suggesting that our preparations were relatively pure. Western blot analysis indicated some contaminating vacuolar, endoplasmic reticular and cytosolic proteins, as is generally observed (10).
Samples were packed by centrifugation into Mössbauer holders (an open delrin cup) to maximize the amount of Fe examined. However, the resulting spectra (Fig. 1) had lower S/N ratios than is readily obtained with Fe-containing proteins or small molecules, due to the low inherent concentration of Fe in mitochondria (700 – 800 μM Fe overall and typically 200 – 300 μM of 57Fe in samples grown on 57Fe-enriched media). In spectra of mitochondria, the quality was sufficient to recognize some minor species (≥ ~ 10%), but insufficient to quantify such species to greater than ± 5% precision.
Figure 1.

Mössbauer spectra of EGTA-washed fermenting mitochondria (Sample F12, (18)) recorded at 4.5 K and 0.05 T (A), 100 K and 0.05 T (B), and 4.2 K and 8 T (C). Solid lines simulate the contributions of NHHS FeII species (blue line in A, ~20% of total Fe), the central doublet (red line in A and blue line in C, ~ 20%), FeIII nanoparticles (red line in B, ~ 40%), and mononuclear HS FeIII species (red line in C, ~ 20%). Shown offset above B is the experimental spectrum of FeII(EGTA) (black hashmarks). The black arrows in Figures 1-3 point to the high energy absorption line of the NHHS FeII species.
Nonheme high-spin (NHHS) Ferrous Ions in EGTA-Washed Fermenting Mitochondria
Our initial strategy was to remove adventitiously bound NHHS FeII by including 1 mM EGTA, a strong FeII chelator, in all washing buffers used during mitochondrial isolation. Such samples were exposed to the chelator for ~ 6 hrs overall. In the packing step, all EGTA of the final wash was removed except for that residing between the packed mitochondrial particles (the residual buffer was previously estimated to occupy ~ 20% of total volume (9, 12). This quantity of residual EGTA was sufficient to coordinate ~ 200 μM FeII ions. We chose EGTA because it reportedly does not penetrate mitochondrial membranes (13). Also, the FeIIEGTA quadruple doublet can be distinguished reasonably well from the NHHS FeII doublet associated with our mitochondria samples. Despite these efforts, the nonheme, non-FeII(EGTA) HS FeII doublet was observed in all of the ~ 30 independently-prepared batches of EGTA-washed mitochondria examined. Spectra of 4 other batches (Fig. S2) illustrate the extent of batch-to-batch variation.
The blue line in Fig. 1A is a simulation assuming isomer shift, quadrupole splitting and effective linewidth parameters of δ ≈ 1.25 mm/s, ΔEQ, ≈ 3.35 mm/s, and Γ = −0.65 mm/s, respectively (in WMOSS, a negative linewidth indicates a Voigt profile with a Lorentzian of 0.15 mm/s full width convoluted into a Gaussian with σ = −0.65 mm/s). These values are typical of mononuclear {Fe2+(O)m(N)n} complexes for which 5 ≤ (m + n) ≤ 6 and m ≥ 4 (14). HS FeII hemes have parameters δ ranging from 0.92 0.95 mm/s and ΔEQ ranging from 2.02 to 2.20 mm/sec (15, 16). The low-energy absorption line of the NHHS FeII doublet is hidden within the central doublet (see below) while the high-energy line, which contains half of the doublet’s intensity, is generally resolved. This line is marked by the arrow in Fig. 1A and in all other spectra. In Fig. 1A, the spectral area of the doublet represents 20% of the Fe in the sample, corresponding to ~ 150 μM FeII. The large width of the absorption lines suggests multiple species. This experiment shows that the NHHS FeII ions in our sample are protected from EGTA chelation despite extensive washing of mitochondria with EGTA-containing buffers.
Mössbauer spectra of fermenting mitochondria also contain a quadrupole doublet representing ~20% of the total Fe, with δ = 0.45 mm/s and ΔEQ ~1.15 mm/s. This species, called the central doublet, arises from unresolved S = 0 [Fe4S4]2+ clusters and low-spin ferrous hemes (Fig. 1A, red line) (8, 9). In strong applied fields the contribution of these species can readily be simulated (Fig. 1C, blue line) because the effective field at the nucleus arises solely from the applied field. In contrast, HS FeII ions exhibit paramagnetic hyperfine structure spread over a wide velocity range, making it difficult to characterize in 8.0 T spectra.
EGTA-washed fermenting mitochondria also exhibited spectral features from magnetically isolated high-spin (S = 5/2) mononuclear FeIII species with E/D ~ 1/3. In weak applied fields (0.05 T), magnetically isolated FeIII yield intricate Mössbauer patterns exhibiting paramagnetic hyperfine structure. With the low 57Fe concentrations in these samples, such features cannot be analyzed well or easily distinguished from baseline (distorting the quantification of other species). Fortunately in 8 T applied fields, the outmost features of HS FeIII components are resolved (Fig. 1C, red line), allowing an accurate estimate of concentration (here 20% of spectral intensity, corresponding to ~ 150 μM Fe).
In 0.05 T applied fields, and at 4.5 K (Fig. 1A) and 100 K (Fig. 1B), EGTA-washed fermenting mitochondria also yielded a quadrupole doublet with ΔEQ ≈ 0.63 mm/s and δ ≈ 0.52 mm/s; the red line in Fig. 1B. Similar doublets were present in spectra of mitochondria isolated from Yfh1p-, Yah1p-, and Atm1p-depleted cells (4, 8, 17); they arise from FeIII phosphate nanoparticles exhibiting superparamagnetism. In strong applied fields, these nanoparticles yield broad unresolved features (see Fig. 2D of (8)). Quantification is most accurate at temperatures well above the blocking temperature, TB; for T ≫ TB, spectra consist of a quadrupole doublet (in the present samples, TB < 4.2 K). The 100 K spectrum (Fig. 1B) shows that ~ 40% of the Fe of the sample belongs to FeIII nanoparticles.
In summary, the Fe in EGTA washed fermenting WT mitochondria is distributed into 4 major groups. Approximately 20% is NHHS FeII, ~ 20% is a combination of [Fe4S4] and LS FeII hemes, ~ 40% FeIII resides in nanoparticles, and ~ 20% is non-interacting mononuclear high-spin FeIII. These organelles also contain small amounts of other Fe-containing species(18). All of these Fe-containing species were present despite extensive exposure of the mitochondria to a strong FeII chelator, suggesting that they are located within the organelle and protected from chelation.
BPS-treated mitochondria
As the difference in the positions of the high energy lines of the NHHS FeII doublet and the FeIIEGTA doublet is modest, we wanted more compelling evidence that the NHHS FeII species in our samples were located within the organelle. BPS is orders-of-magnitude stronger than EGTA in terms of FeII chelation, and its negative charge should also make it impenetrable to mitochondrial membranes. However, the major advantage of using BPS is that it forms a LS FeII complex which is easily distinguishable from HS FeII ions.
The blue line in Fig. 2A is a 4.5 K Mössbauer spectrum of a mitochondria sample washed with 3 mM BPS. It contains a NHHS FeII doublet representing 20% of total iron. After collecting this spectrum, the sample was thawed, sonicated and re-frozen, all in a glove box containing ~ 1 ppm O2. The resulting spectrum (Fig. 2A hash marks) lacked the NHHS FeII doublet; rather, it exhibited a doublet with parameters ΔEQ = 0.32 mm/s and δ = 0.38 mm/s indicating LS FeII(BPS)3. These changes are best visualized by the after-minus-before sonication difference spectrum shown in Fig. 2B. Features pointing upward (downward) are present before (after) sonication; unchanged features cancel. The spectral simulation (red line) assumes that 23% of the Fe in the sample converted to FeII(BPS)3 by sonication, including NHHS FeII (13%) and the central doublet (10%) (percentage in parentheses refers to total Fe, not % change of the spectral species). The change corresponds to the majority of the initial NHHS FeII species and to about half of the central doublet. Other experiments suggest that sonication alone can destroy [Fe4S4]2+ clusters (Fig. S3), whereas BPS does not chelate FeII coordinated in heme centers (19). We suspect that sonication degraded a large portion of mitochondrial [Fe4S4] clusters and that the released Fe ions were reduced by endogenous agents present in mitochondria (or generated upon sonication) to FeII and coordinated by BPS.
Similar results were observed in a second independent experiment (Fig. 2, C and D) in which BPS was added to EGTA-washed mitochondria only in the final isolation step. Again, the majority of NHHS FeII ions and half of the central doublet were replaced by FeII(BPS)3 after sonication. In this experiment, the majority of the iron contained in the FeIII nanoparticles was also converted to FeII(BPS)3 upon sonication (the first experiment showed a lower % of nanoparticles). We suspect that sonication released species (sulfide ions?) that reduced the FeIII ions of the nanoparticles to HS FeII ions that were then coordinated by BPS. A third independent experiment (Fig. S4) using BPS-washed mitochondria also showed the semi-quantitative conversion of NHHS FeII ions into LS FeII(BPS)3 upon sonication. Other Fe-containing species in the mitochondria also converted to FeII(BPS)3 but our spectra are insufficiently resolved to identify them. A fourth experiment was conducted in which membranes were disrupted by exposure to deoxycholate rather than by sonication. This detergent has been used to disrupt mitochondrial membranes (22). The spectra, also shown in Fig. S4, again shows the presence of NHHS FeII in the BPS-washed sample, and the replacement of this doublet by the FeII(BPS)3 doublet in the spectra of the sample treated with deoxycholate. The results of these four experiments establish that the NHHS FeII ions in our samples were protected from BPS chelation prior to sonication, and that they became susceptible to chelation after sonication. We conclude that this protection arose because these ions are encapsulated by the mitochondrial membrane across which BPS cannot penetrate. Sonication (or deoxycholate) disrupts these membranes, rendering the NHHS FeII ions accessible to chelation. Depending on the extent of BPS exposure, a portion of the Fe in [Fe4S4]2+ clusters and/or Fe-nanoparticles can also be chelated by BPS.
Mitochondria treated with Phenanthroline
From the perspective of Fe coordination, phen and BPS have the same structure and properties; both are extremely strong bidentate chelators that bind HS FeII to form LS FeII complexes. However, in contrast to negatively-charged BPS, phen is neutral and able to penetrate the mitochondrial inner membrane (IM) (6). Thus, if the NHHS FeII species are inside mitochondrial membranes, phen should chelate these ions in unsonicated mitochondria. To test this, an EGTA-washed mitochondria sample was divided in two; half was frozen without treatment and the other half was treated with phen and then frozen. The untreated control (Fig. 3A, blue line) is that of Fig. 1; it exhibited a HS FeII doublet representing 20% of the Fe in the sample. The matched phen-treated sample (Fig. 3A, black hash marks) lacked the NHHS FeII doublet but contained an intense quadrupole doublet with ΔEQ = 0.31 mm/s, δ = 0.37 mm/s. These parameters are characteristic of LS FeII(phen)3. This doublet represented 25% of the total Fe in the sample. These changes are illustrated in the “after-minus-before” difference spectrum (Fig. 3B). The red line is a simulation showing 15% NHHS FeII ions (the features pointing upward) converting to FeII(phen)3 after exposure to phen. Some additional Fe species, representing ~10% of total Fe, also converted to FeII(phen)3. These species exhibit the upward feature at ~ 1.2 mm/s in Fig. 3B. They might be FeIII nanoparticles or Fe of the central doublet, but the spectra lack sufficient resolution to distinguish these. Phen did not cause the decline of the mononuclear HS FeIII species, perhaps due to the weaker coordination of phen to ferric ions. Regardless, our main conclusion is that phen penetrates unsonicated mitochondria and coordinates the NHHS FeII ions located therein.
Figure 3.

Mössbauer spectra (4.5 K 0.05 T) of EGTA-washed mitochondria (Sample F14, (18)) incubated (A, black hash marks), and not incubated (A, blue line) with phen. B, incubated-minus-not-incubated difference spectrum. The red line is a simulation assuming that NHHS FeII ions converted to FeII(phen)3 after exposure to phen. The remaining FeII(phen)3 doublet originated from either FeIII nanoparticles, mononuclear FeIII ions or irons of the central doublet.
No correlation of NHHS FeII to contamination levels
One difficulty in determining the cellular location of the observed NHHS FeII species has been to exclude the possibility that they are encapsulated by membranes other than those of mitochondria. As has been discussed (10, 20), the best method available for isolating large quantities of mitochondria (i.e. discontinuous density gradient centrifugation) does not remove all non-mitochondrial membranous material; the most common contaminants include endoplasmic reticulum (ER) and vacuoles (10). Besides having a density similar to that of mitochondria, the ER physically interacts with mitochondria for phospholipid biosynthesis and calcium signaling (21). These interactions might prevent the clean separation of the two organelles.
We have discovered that the % of NHHS FeII differs in mitochondria isolated from cells grown on different carbon sources (18). In mitochondrial preparations isolated from cells grown on glucose, galactose and glycerol, the NHHS FeII doublet quantified to 16%, 8%, and 2% of total Fe, respectively. Western blot analysis confirmed that these preparations contained some contaminating ER and vacuolar proteins (Fig. 4). The density of blots obtained using antibodies that bind to proteins in the ER, vacuoles, and cytosol was normalized using antibodies for the porin protein that localizes to mitochondria. We found that the normalized blot densities for contaminating organelles were not correlated to the % of the NHHS FeII doublet (Fig. 4, table). Similar analyses performed on 8 different batches of mitochondria isolated from glucose-grown cells also showed no correlation (Fig. S5). These results indicate that the NHHS FeII ions present in chelator-washed mitochondria are contained within these organelles rather than in contaminating membranous species such as ER or vacuoles.
Figure 4.

Western blot of extracts of mitochondria from cells grown on glucose (left lane), galactose (middle) and glycerol (right) (Samples F5, RF1 and R1(18)). For each sample, 60 μg of protein, determined by the bicinchoninic acid method (Thermo Scientific), was added to each lane of a 10% SDS-PAGE gel. Primary antibodies used in staining included Kar2p, CPY, PGK, and porin. Integrated intensities of contaminating bands were normalized to the intensity of the corresponding porin band. These ratios are given in the table along with the percentage of the NHHS FeII doublet observed in the Mössbauer spectrum of the same material.
Dithionite- and deoxycholate-treated mitochondria
We also used deoxycholate in the presence of the reductant dithionite to evaluate whether the HS FeIII species in our mitochondrial samples were contained within the organelle. We treated half of a WT EGTA-washed fermenting mitochondria sample with dithionite; the other half was treated with dithionite and deoxycholate.
The low-field spectrum of the dithionite-and-deoxycholate treated sample (Fig. 5A, black hashmarks) contained a doublet due to FeIIEGTA with δ = 1.3 mm/s, ΔEQ = 3.6 mm/s (Fig. 5A, blue line) that represented 40% of the total Fe. The corresponding spectrum of the dithionite treated sample exhibited a NHHS FeII doublet with about half that intensity (Fig. 5A, blue line). The deoxycholate treated-minus-untreated difference spectrum (Fig. 5B) revealed that besides EGTA coordination to the 20% of NHHS FeII species originally in the dithionite-treated sample, ~ 20% of the Fe from other species was also converted to FeII(EGTA). High field spectra (Fig. S6) reveal that some (~ 12% of total Fe) of these other species originated from HS mononuclear FeIII species. Spectral features from such species are evident in the 8.0 T spectrum of the dithionite-treated sample but absent in that of the dithionite-plus-deoxycholate-treated sample. The other iron species contributing to the FeII(EGTA) complex (~ 8% of total Fe) could not be identified, but they could be FeIII nanoparticles. The central doublet contribution was unchanged in the experiment, consistent with deoxycholate treatment being gentler than sonication in disrupting membranes but not damaging Fe4S4 clusters. These results suggest that the mononuclear HS FeIII species (and perhaps FeIII nanoparticles) that contribute to the spectra of isolated fermenting mitochondria are contained within these organelles, protected from reduction by dithionite. Disruption of these membranes by deoxycholate removed this protection, allowing dithionite to reduce FeIII to FeII. EGTA then chelated the FeII ions forming the observed FeII(EGTA) doublet.
Figure 5.
Effect of deoxycholate on the ability of dithionite to reduce FeIII species in EGTA-treated mitochondria (Sample F15, (18)). A, 100 K Mössbauer spectra of EGTA-washed, dithionite-treated, mitochondria in the absence (blue) and presence (black hashmarks) of deoxycholate. B, presence-minus-absence of deoxycholate difference spectrum; the red line is a simulation representing 20% of total Fe with δ = 1.3 mm/s, ΔEQ = 3.6 mm/s.
Whole yeast cells
57Fe-enriched whole fermenting yeast cells exhibited 4.5 K Mössbauer spectra dominated by features indicating magnetically non-interacting mononuclear HS FeIII components (Fig. 6). These components have vanishingly small spin-dipolar interactions with other paramagnetic Fe sites. At 0.05 T (Fig. 6A), they display paramagnetic hyperfine structure (a quadrupole doublet would be expected if spin-dipolar interactions were effective or if the FeIII component belonged to nanoparticles with a TB ≪ 4 K). At 8.0 T (Fig. 6C), such species exhibited patterns characteristic of magnetically non-interacting FeIII. This behavior implies that these components should be EPR active.
Figure 6.

4.5 K Mössbauer spectra of whole fermenting yeast cells grown on 57Fe-enriched minimal media. A, 0.05 T applied field. The red line is a simulation with A values ranging from −21 T to −23.5 T. B, spectrum obtained after subtracting the simulation in A from the data; the blue line is the spectrum of isolated mitochondria given in Fig. 1A. C, same as A, but at 8.0 T applied field; the red line is a simulation with A values ranging from −21.5 T to −22.5 T.
The red lines in Fig. 6 are the sum of simulations for three mononuclear HS FeIII species, collectively representing ~75% of spectral intensity; the actual number of species contributing to these features remains undetermined. Individual differences amongst the HS FeIII species are lost at 8.0 T. The difference spectrum (Fig. 6B) obtained by subtracting the low-field simulation of Fig. 6A from the spectrum of Fig. 6A is similar to that obtained for isolated mitochondria (the blue line in Fig. 6B is the spectrum of EGTA-washed mitochondria shown in Fig. 1A).
A detailed analysis of the iron content of entire yeast cells will require a separate analysis, but our current analysis is sufficient for us to draw two major conclusions. First, the magnetically non-interacting mononuclear HS FeIII species (whose contribution was removed from the spectrum of Fig. 6A) are not located in mitochondria. Second, the majority of Fe in fermenting yeast cells can be divided into two major groups – these non-mitochondrial mononuclear FeIII species and mitochondrial Fe.
The non-mitochondrial FeIII species are reduced to the FeII state upon sonication of cells and treatment with dithionite (Fig. S7). The resulting quadrupole doublet had ΔEQ = 3.10 mm/s and δ = 1.35 mm/s, parameters similar to those of the NHHS FeII doublet in isolated mitochondria. This does not necessarily mean that the two doublets represent the same pool of iron, but neither can this possibility be excluded.
Discussion
NHHS FeII pool within isolated mitochondria
The major conclusion of this study is that the NHHS FeII species that are present in our isolated mitochondrial samples are located within the organelle. Three lines of evidence support this. Firstly, such species were observed after intact mitochondria were exposed to high concentrations of strong FeII chelators (EGTA and BPS) for extensive periods of time. EGTA is reported not to penetrate mitochondrial membranes and BPS is unlikely to do so because of its negative charge. We have observed such species in all ~ 30 batches prepared in this way over the course of the past 5 years. These FeII species were present in samples that had not been sonicated or exposed to phen, indicating that they were not generated by the degradation of [Fe4S4] clusters.
Secondly, BPS and EGTA were only able to coordinate NHHS FeII after samples were sonicated. As sonication disrupts mitochondrial membranes, we conclude that the NHHS FeII species are located within the mitochondria and are protected from these chelators until the mitochondrial membranes are disrupted by sonication or by detergents such as deoxycholate. This conclusion is supported by the observation that phen (with a similar coordinating chemical structure as BPS but neutral and membrane permeable) can chelate the NHHS FeII species without sonication.
Thirdly, there was no correlation between the spectral intensity of the NHHS FeII doublet and the level of ER or vacuolar contamination in our samples. This excludes the possibility that these FeII species are located in a membrane-bound but non-mitochondrial organelle that contaminated our preparations.
Other scenarios have also been considered. For example, it is conceivable that during isolation, mitochondrial membranes become more permeable, allowing Fe from the isolation buffers to enter into the organelle. However, in this case, one would also expect that the strong chelators present in these buffers would have also entered the organelle and coordinated the observed HS FeII species, and/or that Fe within the organelle would also diffused into the buffer, draining the organelle of the observed HS FeII. The presence of the HS FeII species argues against these scenarios.
These FeII components represent ~ 20% of the total Fe in the organelle (700 – 800 μM), corresponding to ca. 150 μM in NHHS FeII. Given the low intensity of our signals and batch-to-batch variations, we estimate an overall relative uncertainly of ± 30% (100 – 200 μM) for the concentration of these components in fermenting mitochondria. This concentration is an order-of-magnitude higher than previous estimates based on fluorescence studies. Comparing results is difficult because the sources of the mitochondria (yeast vs. rat liver) differed as is the metabolic conditions under which the cells were prepared. Nevertheless, our studies show that the concentration of these ions in mitochondria isolated from fermenting yeast is higher than has been generally assumed.
Other pools of iron in mitochondria and whole cells
Although the focus of this paper was to establish whether the NHHS FeII species were located within yeast mitochondria, our experiments also provide evidence for other pools of Fe in the organelle, including FeIII nanoparticles (~ 40% of Fe, corresponding to ~ 300 μM, but somewhat variable) and mononuclear HS FeIII ions (~ 20% of Fe, corresponding to ~ 150 μM). The combined concentration of these three pools (600 μM) represents ~ 80% of the total Fe in fermenting mitochondria. This is again a larger-than-expected proportion of mitochondrial Fe in the form of Fe pools. Whether these pools are independent of each other (e.g. imported through different IM transporters) or are in dynamic equilibrium with each other is unknown, but we assume the latter in the model of Figure 7. We have also observed a fourth pool of Fe in fermenting yeast cells, namely mononuclear HS FeIII ions located in a non-mitochondrial region of the cell. The concentration of this pool is high, representing ~ 75% of all Fe in the cell.
Figure 7.

Distribution of iron pools in mitochondria isolated from fermenting yeast. Three pools composed of nonheme HS FeII species, mononuclear HS FeIII species, and FeIII nanoparticles have been identified.
We have not established the metabolic role of any of these pools. FeII ions are imported into the mitochondrial matrix via two high-affinity transporters (Mrs3p/Mrs4p), and this pool is used as feedstock for Fe/S and heme biosynthesis. Studies also suggest the presence of an FeIII pool in vacuoles (23). It is appealing to consider that we have observed these and perhaps other Fe pools in yeast, but further studies are required to establish this. Mössbauer spectroscopy in combination with the analysis of various genetic strains of yeast will undoubtedly be useful in elucidating this and other details of iron trafficking in cells.
Supplementary Material
Abbreviations
- LS
low-spin
- HS
high-spin
- NHHS
nonheme high-spin
- BPS
bathophenanthroline sulfonate
- EGTA
glycol-bis(2-aminoethylether)-N,N,N’,N’-tetraacetic acid
Footnotes
This study was supported by the National Institutes of Health grants GM084266, (PAL), EB-001475 (EM), T32GM008523 (GPHH and JGM) and the Robert A. Welch Foundation (A1170, PAL).
Supporting Information Available: Fig. S1, Western blot of isolated mitochondria; Fig. S2, Mössbauer spectra of EGTA-washed mitochondria from fermenting cells; Fig. S3, effect of sonication; Fig. S4, the third BPS experiment; Fig. S5, Western blot of eight independent mitochondria preparations; Fig. S6, effect of deoxycholate on Mössbauer spectra of dithionite-reduced mitochondria; Fig. S7, Mössbauer spectrum of whole fermenting yeast cells after sonication and treatment with dithionite. This material is available free of charge via the Internet at http://pubs.acs.org.
References
- 1.Atamna H. Heme, iron, and the mitochondrial decay of ageing. Ageing Research Reviews. 2004;3:303–318. doi: 10.1016/j.arr.2004.02.002. [DOI] [PubMed] [Google Scholar]
- 2.Mühlenhoff U, Stadler JA, Richhardt N, Seubert A, Eickhorst T, Schweyen RJ, Lill R, Wiesenberger G. A specific role of the yeast mitochondrial carriers Mrs3/4p in mitochondrial iron acquisition under iron-limiting conditions. J. Biol. Chem. 2003;278:40612–40620. doi: 10.1074/jbc.M307847200. [DOI] [PubMed] [Google Scholar]
- 3.Shvartsman M, Kikkeri R, Shanzer A, Cabantchik ZI. Non-transferrin-bound iron reaches mitochondria by a chelator-inaccessible mechanism: Biological and clinical implications. American Journal of Physiology-Cell Physiology. 2007;293:C1383–C1394. doi: 10.1152/ajpcell.00054.2007. [DOI] [PubMed] [Google Scholar]
- 4.Lesuisse E, Santos R, Matzanke BF, Knight SAB, Camadro JM, Dancis A. Iron use for haeme synthesis is under control of the yeast frataxin homologue (Yfh1) Human Molecular Genetics. 2003;12:879–889. doi: 10.1093/hmg/ddg096. [DOI] [PubMed] [Google Scholar]
- 5.Tangeras A, Flatmark T, Backstrom D, Ehrenberg A. Mitochondrial iron not bound in heme and iron-sulfur centers - estimation, compartmentation and redox state. Biochim. Biophys. Acta. 1980;589:162–175. doi: 10.1016/0005-2728(80)90035-3. [DOI] [PubMed] [Google Scholar]
- 6.Petrat F, de Groot H, Sustmann R, Rauen U. The chelatable iron pool in living cells: A methodically defined quantity. Biol. Chem. 2002;383:489–502. doi: 10.1515/BC.2002.051. [DOI] [PubMed] [Google Scholar]
- 7.Petrat F, Weisheit D, Lensen M, de Groot H, Sustmann R, Rauen U. Selective determination of mitochondrial chelatable iron in viable cells with a new fluorescent sensor. Biochem. J. 2002;362:137–147. doi: 10.1042/0264-6021:3620137. [DOI] [PMC free article] [PubMed] [Google Scholar]
- 8.Miao R, Martinho M, Morales JG, Kim H, Ellis EA, Lill R, Hendrich MP, Munck E, Lindahl PA. EPR and Mössbauer spectroscopy of intact mitochondria isolated from yah1p-depleted Saccharomyces cerevisiae. Biochemistry. 2008;47:9888–9899. doi: 10.1021/bi801047q. [DOI] [PubMed] [Google Scholar]
- 9.Hudder BN, Morales JG, Stubna A, Münck E, Hendrich MP, Lindahl PA. Electron paramagnetic resonance and Mössbauer spectroscopy of intact mitochondria from respiring Saccharomyces cerevisiae. Journal of Biological Inorganic Chemistry. 2007;12:1029–1053. doi: 10.1007/s00775-007-0275-1. [DOI] [PubMed] [Google Scholar]
- 10.Diekert K, de Kroon AIPM, Kispal G, Lill R. Isolation and subfractionation of mitochondria from the yeast Saccharomyces cerevisiae. Methods in Cell Biology. 2001;65(65):37–51. doi: 10.1016/s0091-679x(01)65003-9. [DOI] [PubMed] [Google Scholar]
- 11.Stevens BJ. Variation in number and volume of mitochondria in yeast according to growth-conditions - study based on serial sectioning and computer graphics reconstitution. Biologie Cellulaire. 1977;28:37–56. [Google Scholar]
- 12.Lindahl PA, Morales JG, Miao R, Holmes-Hampton G. Methods enzymol. Academic Press; 2009. Chapter 15 isolation of Saccharomyces cerevisiae mitochondria for Mössbauer, EPR, and electronic absorption spectroscopic analyses; pp. 267–285. [DOI] [PubMed] [Google Scholar]
- 13.Luo Y, Bond JD, Ingram VM. Compromised mitochondrial function leads to increased cytosolic calcium and to activation of map kinases. Proc. Natl. Acad. Sci. U. S. A. 1997;94:9705–9710. doi: 10.1073/pnas.94.18.9705. [DOI] [PMC free article] [PubMed] [Google Scholar]
- 14.Dickson DPE, Berry FJ. Mössbauer spectroscopy. Cambridge University Press; Cambridge; New York: 1986. [Google Scholar]
- 15.Wikstrom M, Krab K, Saraste M. Proton-translocating cytochrome complexes. Annu. Rev. Biochem. 1981;50:623–655. doi: 10.1146/annurev.bi.50.070181.003203. [DOI] [PubMed] [Google Scholar]
- 16.Kent TA, Münck E, Dunham WR, Filter WF, Findling KL, Yoshida T, Fee JA. Mössbauer study of a bacterial cytochrome-oxidase - cytochrome c1aa3 from Thermus-thermophilus. J. Biol. Chem. 1982;257:2489–2492. [PubMed] [Google Scholar]
- 17.Miao R, Kim H, Koppolu UMK, Ellis EA, Scott RA, Lindahl PA. Biophysical characterization of the iron in mitochondria from Atm1p-depleted Saccharomyces cerevisiae. Biochemistry. 2009;48:9556–9568. doi: 10.1021/bi901110n. [DOI] [PMC free article] [PubMed] [Google Scholar]
- 18.Garber-Morales J, Holmes-Hampton GP, Miao R, Guo Y, Münck E, Lindahl PA. The iron-ome of mitochondria isolated from respiring and fermenting Saccharomyces cerevisiae. 2010 doi: 10.1021/bi100558z. [DOI] [PMC free article] [PubMed] [Google Scholar]
- 19.Flatmark T, Tangeras A. Mitochondrial ‘non-heme non-FeS iron’ and its significance in the cellular metabolism of iron. In: E.B. Brown PA, Fielding J, Crichton RR, editors. Proteins of iron metabolism. Grune & Stratton; New York, USA: 1976. pp. 349–358. [Google Scholar]
- 20.Glick BS, Pon LA. Isolation of highly purified mitochondria from Saccharomyces cerevisiae. Mitochondrial Biogenesis and Genetics. 1995;(Pt A 260):213–223. doi: 10.1016/0076-6879(95)60139-2. [DOI] [PubMed] [Google Scholar]
- 21.Goetz JG, Nabi IR. Interaction of the smooth endoplasmic reticulum and mitochondria. Biochem. Soc. Trans. 2006;34:370–373. doi: 10.1042/BST0340370. [DOI] [PubMed] [Google Scholar]
- 22.Green DE, Tisdale HD, Criddle RS, Bock RM. Structural protein and mitochondrial organization. Biochem. Biophys. Res. Commun. 1961;5:81. doi: 10.1016/0006-291x(61)90085-7. [DOI] [PubMed] [Google Scholar]
- 23.Singh A, Kaur N, Kosman DJ. The metalloreductase Fre6p in Fe-efflux from the yeast vacuole. J. Biol. Chem. 2007;282:28619–28626. doi: 10.1074/jbc.M703398200. [DOI] [PubMed] [Google Scholar]
Associated Data
This section collects any data citations, data availability statements, or supplementary materials included in this article.