

Abstract
Many reports have documented age-by-frequency increases in average auditory thresholds in various human populations. Despite this, the prevalence of different patterns of hearing loss in presbycusis remains uncertain. We examined presbycusis phenotypes in a database of 960 subjects (552 female, 408 male, 18 to 92 yrs) that each had 30 measures of peripheral hearing sensitivity: pure tone audiograms for left and right ears from 0.25 kHz to 8 kHz and DPOAE for each ear with Fmean = 1 to 6.4 kHz. Surprisingly, the hearing phenotypes did not naturally separate into discrete classes of presbycusis. Principal component (PC) analysis revealed that two principal components account for 74 % of the variance among the 30 measures of hearing. The two components represent the overall degree (PC1) and configuration of loss (Flat vs. Sloping; PC2) and the phenotypes form a continuum when plotted against them. A heuristic partitioning of this continuum produced classes of presbycusis that vary in their degree of Sloping or Flat hearing loss, suggesting that the previously reported sub-types of presbycusis arise from the categorical segregation of a continuous and heterogeneous distribution. Further, most phenotypes lie intermediate to the extremes of either Flat or Sloping loss, indicating that if audiometric configuration does predict presbycusis etiology, then a mixed origin is the most prevalent.
Keywords: Presbycusis, Age-related hearing loss, Audiometric configuration, ISO 7029, ANSI S3.44
1. Introduction
That people tend to lose their hearing as they age is widely recognized by the general public, and age-related hearing loss (ARHL) has been studied for well over 100 years since Roosa (1885) coined the term presbykousis (presbycusis, reviewed e.g. by Gates & Mills, 2005). The decline of hearing abilities with age manifests in several ways, most notably in terms of the difficulty most elderly have in detecting weak sounds (e.g. Glorig & Nixon, 1962; Brant & Fozard, 1990; Cruickshanks et al. 1998). These age-related changes raise the research question of whether hearing deteriorates with increasing age via a single process, or whether there are distinct subtypes of presbycusis. There are two interrelated ways to address this question: mechanistically in terms of the pathological changes occurring in the underlying biological systems of hearing with age; and phenomenologically in terms of the observed range of hearing abilities measured in the elderly. In this report, we take the phenomenological approach in order to characterize how peripheral hearing loss manifests in an aging population.
Many studies have characterized loss of hearing sensitivity in large populations for people unscreened, as well as those screened for noise and ototoxic exposure. After compiling many studies (screened: Robinson and Sutton, 1979; unscreened Robinson, 1988) normative data schedules were produced (ANSI, 1996; ISO, 2000), and these list measures of both central tendency (medians) and the statistical dispersion (percentiles) of pure tone thresholds as a function of age for men and women. They reveal accelerating hearing loss with age, especially for high frequencies, and also reliable differences between men and women, with women showing less high frequency loss. The increased dispersion of thresholds at each frequency with age also suggests that hearing abilities become more heterogeneous with age. That unscreened populations have worse hearing, particularly for high frequencies, as indicated by exposure dose-dependent hearing loss, demonstrates the interaction of presbycusis with what has been termed socioacusis (Glorig & Nixon, 1962), the hearing loss that is produced by everyday as well as ototraumatic or ototoxic exposure. Animal models have been employed to deconvolve these effects (Gerbil: Mills et al. 1990; Mice: Kujawa & Liberman, 2006, 2009; Ohlemiller, 2006), but essentially all humans, especially in modern western societies, experience some degree of socioacusis.
Normative data schedules, such as the ANSI and ISO standards, apparently predict a uniform progression with age of predominantly high-frequency hearing loss (ANSI, 1996; ISO, 2000), or rather; they do not yield information regarding specific audiometric configurations, or phenotypes, of the individuals contributing to this data. By contrast, clinical reports have tended to stress the existence of two distinct hearing loss configurations, namely Flat loss and High Frequency Sloping loss. Such observations led Schuknecht and colleagues to attempt to relate specific cochlear pathologies to specific audiometric configurations (e.g., Schuknecht & Gacek, 1993). They reported case studies with distinct types of abnormal temporal bone structures, either atrophy of sensory hair cells or of the stria vascularis. They linked these pathologies to steeply sloping high-frequency hearing loss and the relatively flat loss audiometric configuration respectively (e.g., Ramadan & Schuknecht, 1989). Schuknecht also identified a neural presbycusis associated with reduced word recognition, and cochlear conductive loss from altered basilar membrane stiffness, as well as mixed and indeterminate pathologies (Schuknecht & Gacek, 1993). Strial presbycusis has been extensively studied using the gerbil model of human presbycusis, with successful demonstration that disruption of the endocochlear potential produces hearing loss that mimics the flat loss configuration found in some elderly humans (Schmiedt, 1996; Mills, 2003; 2006; Mills & Schmiedt, 2004). A recent report by Demeester et al. (2009) identified three distinct presbycusis phenotypes, which they suggest may be associated with distinct genetic and environmental factors, while Friedland et al. (2009) have shown that the strial phenotype in humans is correlated with underlying cardiovascular disease. However, recent quantitative studies of human temporal bones with flat or sloping audiometric configurations (Nelson and Hinojosa, 2003 and 2006 respectively) have cast doubt on the utility of audiometric classification alone on predicting underlying otopathology.
Distortion product otoacoustic emissions (DPOAE) are thought to be dependent on the integrity of the cochlear outer hair cells and may be differently affected by aging compared with pure tone thresholds (Lonsbury-Martin et al. 1991; Oeken et al. 2000; Mills, 2006). As such, they may offer an independent means of non-invasively assessing otopathology. Mills (2003; 2006) proposed a model of differential diagnosis of the etiology of presbycusis based on the ratio of change in DPOAE amplitudes or thresholds to the change in pure tone thresholds. Gates and colleagues (Gates et al. 2002; Cilento et al. 2003; Mills et al. 2007) have considered this model in the context of human subjects and have provided data supporting strial dysfunction as contributing to presbycusis in humans.
In the current report, we have attempted to unify the two approaches of characterizing the degree and configurations of hearing loss in presbycusis. The data were obtained as part of subject screening for a multi-year study of presbycusis, and in addition to bilateral pure tone audiometric thresholds, we use DPOAE amplitudes as a potentially complementary measure of auditory peripheral sensitivity that might be especially useful in revealing strial presbycusis. We compare conventional audiometric shape calculations, (especially following Cruickshanks, 1998; Demeester et al. 2009) with a novel average auditory age calculation, and cluster and principal components analyses to examine measures of central tendency and dispersion with age and sex in these data, as well as to examine what natural classifications exist that might help distinguish different presbycusis subtypes and their underlying bases. Based on the schema of Schuknecht and colleagues and the audiometric shape calculations of Demeester et al. (2009), we hypothesized that PTT and DPOAE data would naturally cluster into sub-groups corresponding to different classes of hearing loss.
2. Materials and Methods
2.1 Subjects
The data reported here represent 960 subjects, including 552 females and 408 males with either normal hearing (ANSI, 2004) or hearing loss as determined by pure-tone audiometry and tympanometry. Subjects ranged in age from 18 to 92 years. These data were collected over a 7-year period as part of a large cross-sectional study of presbycusis. Exclusion criteria were ear surgery, fluctuating hearing loss including Meniere s disease, labyrinthitis, auditory neuropathy, brain injury, ototoxic medications, dementia, and extensive noise exposure as judged by self-report. All subjects were volunteers and were paid a small hourly wage for their participation. Subjects were recruited from the Rochester, NY community and reflect the demographics of the region in terms of ethnic and racial composition, with a probable bias towards above average education and socioeconomic status typical of volunteer research participants. Research was approved by the human subjects institutional review boards of the Rochester Institute of Technology and University of Rochester and was conducted according to the principles of the Declaration of Helsinki.
2.2 Audiometric Measures
2.2.1 Pure tone thresholds
The pure-tone thresholds (PTT) reported below consist of air-conduction thresholds at audiometric frequencies of 250, 500, 1000, 2000, 4000, and 8000 Hz measured via Grason-Stadler GSI 61 audiometer and insert earphones (Etymotic Research ER-3A). All testing was conducted in an IAC sound attenuating chamber.
2.2.2 Distortion product otoacoustic emissions
Distortion product otoacoustic emissions (DPOAEs) were recorded with an Otodynamics ILO system (Otodynamics, Ltd. ILO92 or ILO292). The stimulus levels were held constant at L1 = 70 and L2 = 60 dB SPL and the stimulus frequencies were geometrically centered between 1001 and 6348 Hz in 1/3 octave steps with an f2/f1 ratio of 1.22. DPOAEs were considered present when the signal at 2f1-f2 was at least 3 dB above the corresponding noise level (Lonsbury-Martin et al. 1991). The Otodynamics software records the levels found in 12 neighboring frequencies and sets the significant levels for the DPOAE at two standard deviations above the mean noise level (for 95% confidence).
2.3 Data Analysis
2.3.1 Statistical analysis
Pure tone thresholds and DPOAE S/N amplitudes were each subjected to mixed design repeated-measures analyses of variance (ANOVA) with Ear (L/R), and Test Frequency as within-subject variables and Age Range (Decade) and Gender (Male/Female) as between-subjects variables and these were performed using SPSS v15 (SPSS Inc, Chicago, IL). The degrees of freedom for the ANOVA were adjusted for non-homogeneity of between-cell correlations using the Huyhn-Feldt procedure. Bivariate correlations of the dataset were calculated (Pearson s r, PTT and DPOAE together), as were partial correlations while controlling for Age. Subsequent to the principal component analysis, bivariate correlations of PC1, PC2, and Age were calculated for males and females separately.
2.3.2 Average Auditory Age calculations
Robinson and Sutton (1979) introduced a formula for calculating the median hearing threshold shift between 0.125 and 12 kHz for otologically screened men and women as a function of age up to 70 years:
where N is age, and af,s is a frequency and sex specific constant listed in Table V of Robinson and Sutton (1979), and reproduced in Appendix I. Conversely, a novel approach used here is to calculate an effective auditory age from each of the pure tone thresholds and for each subject calculate an Average Auditory Age (AAA):
where n is the number of frequencies (f) contributing to the average, and where ΔH ≥ 0. Here, a single AAA was calculated for each subject based on an average age for PTTs from their better ear (the ear with the lowest average PTT). In order to assess the robustness of the AAA measure, simulated data were generated using median threshold shifts predicted for male and females at each decade between 20 and 90 years, rounded to the nearest 5 dB. A range of age-normal AAA was estimated from adding or subtracting 5 dB from the simulated median threshold shift and recalculating an AAA for each decade, this representing the precision limit of the audiogram, which is measured in 5 dB steps. Ages beyond 70 years represent extrapolations of the relationships reported by Robinson and Sutton (1979).
2.3.3 Audiometric shape calculations
The pure tone thresholds for each ear were subjected to a series of calculations to determine an audiometric shape. Following the procedures of Demeester et al. (2009), a Flat audiogram was defined as having the average PTT of 250 Hz and 500 Hz, 1 kHz and 2 kHz, and 4 kHz and 8 kHz all within 15 dB of each other. A High-Frequency Gently Sloping audiogram was defined as having the difference between the 500 Hz and 1 kHz average and the 4 kHz and 8 kHz average greater than 15 dB but less than 30 dB. A High-Frequency Steeply Sloping audiogram was defined as having the difference between the 500 Hz and 1 kHz average and the 4 kHz and 8 kHz average greater than 30 dB. If the PTTs for an ear did not match any of these three classes, it was classed as Other, while if an ear matched both the Flat and Gently sloping criteria, it was classed as Gently Sloping only. For each subject, audiograms were categorized as Flat, Gently Sloping, Steeply Sloping, or Other if both ears were of the same category, and categorized as Mixed if the two ears were different. Separately, each subject s audiogram was assessed for Between-Ear PTT Asymmetry and Notch Hearing Loss. The audiogram was classified as having Between-Ear PTT Asymmetry if the difference in PTT between the ears at any frequency exceeded 15 dB. Notch Hearing Loss was assessed following Dobie (2006), but using the difference between the 4 kHz threshold and the 2 kHz and 8 kHz average since 3 kHz and 6 kHz data were not measured. A Notch Hearing Loss was indicated if both ears showed a 4 kHz notch hearing loss greater than 20 dB relative to the 2 and 8 kHz average. Lastly, following Cruickshanks et al. (1998) we categorize a subject as having Hearing Loss if the pure tone average of 0.5, 1, 2, and 4 kHz in the worse ear was greater than 25 dB HL. Note that the use of these descriptor classes is not intended to include or exclude any specific etiology (e.g., absence of a notch does not rule out noise-induced hearing loss).
2.3.4 Hierarchical Cluster Analysis
Hierarchical cluster analysis was performed using the Statistics Toolbox in Matlab 2007b (The Mathworks, Natick, MA). Hierarchical cluster analysis is a technique that sorts data according to how similar and dissimilar each data point is from all others. Similarity is quantified by a distance metric. Data closest to each other are grouped together, and these groups are in turn iteratively grouped to form hierarchical grouping relationships among all the data. Natural clusters form if some data are all close to each other and far from others. In hierarchical clustering, these natural clusters have short distances within the cluster, but large distances between clusters. Alternatively, if the data are not naturally clustered the hierarchical structure will produce clusters that have similarly sized within- and between- cluster distances.
Pairwise distances between the PTT and DPOAE data of each subject were calculated using a standardized Euclidean distance metric to account for differences of scale among the measures. These distances between data points were linked using their shortest mutual distance. The maximum distance between all the clusters was calculated, along with the co-phenetic distance, which is a standardized metric that scores a hierarchical cluster between 0 and 1 on how well the clustering reflects the overall distances among the original data. The hierarchical cluster analysis was also performed on the following data subsets: Right Ear PTT, Left Ear PTT, Right Ear DPOAE, Left Ear DPOAE, Both Ears PTT, Both Ears DPOAE, Better Ear PTT, Better Ear PTT and DPOAE.
2.3.5 Principal Component Analysis and post-hoc clustering
Principal component analysis (PCA) is performed on datasets with a large number of correlated variables to transform them into a representation based on uncorrelated principal components. The first principal component is a weighted sum of the original variables that accounts for the maximal shared variance in the original sample. Subsequent components iteratively account for the residual variance.
The dataset of PTT and DPOAE variables studied here is a good candidate for PCA because there are large mutual correlations among the 30 PTT and DPOAE variables. For exploratory purposes, PCA was conducted on the full data set as well as the subsets listed in section 2.3.4 using both z-transformed and non-transformed data. The transformed data equalize differences in variability among the different measures, but the non-transformed data maintain their natural dB scale. PCA was performed using the Statistics Toolbox in Matlab 2007b, which performs a Singular Value Decomposition on the data matrix. The PCA generates 1) the principal component vectors, 2) the projection of the original data into the space of the principal components, and 3) the eigenvalues of the PCA. The eigenvalues list the total variance accounted for by each of the principal components, and from these the percentage of variance accounted for by each of the principal components was calculated. The principal component vector table was not rotated, and represents the weighting of each of the original audiometric variables in each of the principal components.
As detailed below, we found no evidence for natural categorical boundaries in these data and they appear to be continuously distributed. Using the K-means algorithm, we imposed arbitrary, but objective categorical boundaries on the data in order to determine if this would reveal presbycusis subtypes. The K-means algorithm is an iterative calculation that partitions data into a predetermined number of clusters. The algorithm iteratively moves the cluster centroids and shuffles the cluster membership of each data point until the combined sum of distances between cluster members and their centroid has been minimized. We used K-means to partition the first two principal component scores into clusters, and compared the results of partitioning into 2 to 10 clusters. The distance metric used was the squared Euclidean distance, with 50 replicates employed to avoid local minima in the solution. The different numbers of clusters were compared by examining what regions of the PC space they covered, and by plotting the average audiograms and DPgrams of the members of each of the clusters.
3. Results
3.1 Audiometric measures
3.1.1 Aging and Sex effects on PTT and DPOAE
For the analyses of this study, each subject was represented by their Sex, Age, and 30 measures of peripheral hearing sensitivity; namely six octave-spaced PTT for the Right and Left ear, and nine third octave-spaced DPOAE amplitudes for each ear. Figure 1 shows the overall aging effect that is immediately apparent in these data when subjects are pooled by decade, and also the difference in the expression of presbycusis in males and females. Mean right ear PTT are shown in the top panels and DPOAE amplitudes in the bottom panels. Error bars are omitted from Figure 1 for clarity, but the reader should note that the apparent orderly progression of hearing loss with age in these mean data obscures a striking heterogeneity of hearing abilities within all subject groupings.
Figure 1.

Mean Right Ear Pure Tone Thresholds (top) and DPOAE amplitudes (bottom) for Males (Left) and Females (Right), pooled by decade bin (+/− 5 years around nominal age listed in legend). Both sexes show the classic progression of increasing high-frequency hearing loss and loss of DPOAE amplitude with age, males tending to have greater high-frequency loss, as well as a modest notch loss near 4 kHz.
On average, the 20- and 30-year-old males do not show PTT shifts; however, the 30-year old males do show reduced DPOAEs compared to the 20-year old group. The 40-year-old males appear to be anomalous, with larger low- and mid-frequency threshold shifts than expected by inspection of adjacent age groups, possibly due to the small number of subjects in this group (n = 12, see Table 1). Older groups seem to show a steady progression of increasing hearing loss with age, especially of high-frequency hearing, and a small uptick at 4 kHz, especially in the 50-year-old group, perhaps indicating a notch loss. The DPOAE appear to show a steady progression of decreased amplitude with age, and for the 60-year-old and older groups the higher frequency DPOAEs appear to decline faster, being essentially non-existent in the 90-year-old group. The females appear to have less severe hearing loss than the males and no sign of a 4 kHz notch in the average data. The 20- and 30-year old females appear to have no hearing loss on average, and strong DPOAEs. The 40- and 50-year-olds appear to have very similar PTTs and DPOAEs with a relatively uniform hearing loss across frequency. The older women show a steady progression of low-frequency hearing loss and somewhat greater high-frequency hearing loss. Their DPOAE also show a uniform decline in frequency with age, however the 80-year-old group has lower high-frequency DPOAE, and the 90-year-old group appears to have no measureable response.
Table 1.
Audiometric configuration by age and gender (Male/Female). For each subject, left and right ears were categorized as having Flat, Gently Sloping, Steeply Sloping, or Other configuration, and are listed as such in the table if both ears had the same configuration, otherwise as L≠R. Separately each subject was categorized as having Between-Ear Asymmetry if at least one PTT differed by 15 dB between the ears, while a Notch Loss was indicated if both ears had 4 kHz loss >20 dB above the 2 and 8 kHz average. A subject was categorized with Hearing Loss if the pure tone average of 0.5, 1, 2, and 4 kHz in the worse ear was greater than 25dB.
| Decade | Flat | Gently Sloping | Steeply Sloping | Other | L≠R | Total | Between-Ear Asymmetry | Notch Loss | Hearing Loss |
|---|---|---|---|---|---|---|---|---|---|
| 20 (18–24) | 49/46 | 0/0 | 0/0 | 1/0 | 2/3 | 52/49 | 2/3 | 0/0 | 0/0 |
| 30 (25–34) | 11/7 | 0/0 | 0/0 | 0/0 | 2/2 | 13/9 | 1/2 | 0/0 | 0/0 |
| 40 (35–44) | 10/16 | 0/1 | 0/0 | 2/1 | 0/4 | 12/22 | 3/1 | 0/0 | 3/1 |
| 50 (45–54) | 8/25 | 2/2 | 7/1 | 0/1 | 9/9 | 26/38 | 8/6 | 4/0 | 1/1 |
| 60 (55–64) | 16/37 | 8/30 | 21/20 | 0/5 | 29/46 | 74/138 | 21/34 | 5/1 | 13/15 |
| 70 (65–74) | 10/16 | 13/28 | 84/52 | 0/3 | 39/79 | 146/178 | 57/60 | 14/2 | 58/56 |
| 80 (74–84) | 0/8 | 14/22 | 52/41 | 0/6 | 15/31 | 81/108 | 29/27 | 3/2 | 65/62 |
| 90 (84–92) | 0/0 | 0/1 | 4/5 | 0/0 | 0/4 | 4/10 | 2/3 | 0/0 | 4/10 |
| Total | 104/105 | 37/84 | 168/119 | 3/16 | 96/178 | 408/552 | 123/136 | 265 | 144/145 |
ANOVA on the PTT data reveal significant main effects of Frequency, F(2.7/2570)=303, p<0.001, η2p=0.243, Age, F(7/944)=153, p<0.001, η2p=0.532, and Sex F(1/944)=7.4, p=0.007, η2p=0.008, while the main effect of Ear (Left vs. Right) failed to reach significance F(1/944)=3.4, p>0.05, η2p=0.004. The significant interaction terms of the ANOVA were Frequency × Age, F(19.1/2570)=54.8, p<0.001, η2p=0.289, Frequency × Sex, F(2.7/2570)=10.9, p<0.001, η2p=0.011, Frequency × Ear, F(3.8/3576)=7.7, p<0.001, η2p=0.008, and Frequency × Age × Sex F(19.1/2570)=2.9, p<0.001, η2p=0.021.
ANOVA on the DPOAE data show significant main effects of Frequency, F(3.6/3432)=47.8, p<0.001, η2p=0.048, Age, F(7/944)=124.4, p<0.001, η2p=0.480, Sex F(1/944)=9.0, p=0.003, η2p=0.009, and Ear, F(1/944)=7.5, p=0.006, η2p=0.008. The significant interaction terms of the ANOVA were Frequency × Age, F(25.4/3432)=11.5, p<0.001, η2p=0.079, Frequency × Sex, F(3.6/3432)=4.9, p=0.001, η2p=0.005, and Frequency × Age × Sex F(25.4/3432)=1.5, p=0.042, η2p=0.011.
Ranking by effect size, Age is by far the strongest factor for both PTT and DPOAE, with η2p near 0.5. Frequency and Frequency × Age are also strong, with η2p near 0.25 for PTT and 0.08 for the DPOAE. The sex effects in the data are relatively modest, the largest of these being the Frequency × Age × Sex interaction, with η2p = 0.021.
3.1.2 Average Auditory Age
The Average Auditory Age (AAA) was calculated for each subject, as described in section 2.3.2 above. AAA is plotted vs. the subject s calendar age in Figure 2. Both males and females show broad distributions of AAA at all ages, with some young subjects having relatively old hearing, but relatively more common are the many elderly who have apparently young hearing. The dashed lines in Figure 2 represent AAA calculated from the median PTT but with 5 dB added to each PTT (upper line), or 5 dB subtracted from each PTT (lower line). As such, the area between the lines represents age-normal PTT, within a conservative estimate of the measurement imprecision of the PTT. Many subjects have AAA above the upper line of Figure 2, and thus have unusually elevated thresholds for their age. However, a large majority of the data lie below this line, and a substantial number lie below the lower line, indicating better hearing than expected for their age.
Figure 2.

Average Auditory Age (AAA) vs. calendar age, for Males (crosses) and Females (filled circles). The dashed lines represent a conservative estimate of the precision limit of the audiogram, measured in 5 dB steps. The upper line is the AAA for the age-median HL (Robinson & Sutton, 1979) with 5dB added to each PTT, while the lower line was calculated from subtracting 5 dB for each PTT from the age-median HL, with HL scores less than zero being set to zero.
3.1.3 Prevalence of audiometric configurations
Audiometric configurations were calculated for the PTT data for each ear of each subject, with the configurations defined as Flat, Gently Sloping, Steeply Sloping, Other, or L≠R if the two ears had different configurations, as described in section 2.3.3. Table 1 lists the results of these calculations broken down by Age Range and Sex. The Flat configuration is the most common for ages 20 to 50, although Steeply Sloping and L≠R have equivalent numbers for the 50-year-old males. For ages 60 to 80, both males and females have substantial numbers where L≠R, but otherwise the Flat configuration becomes less common for both sexes and the Steeply Sloping the most common for ages 70 and above. The Other configuration is rare at all ages.
Between-ear PTT Asymmetry was assessed with a second criterion, namely whether subjects had one or more frequencies that differed in their PTT by 15 dB or more. The number of subjects in each Age and Sex grouping that match this criterion is also listed in Table 1. Between-ear PTT Asymmetry was present in all the groups, but was rare for the 20- and 40-year olds. The highest frequency of Between-ear PTT Asymmetry for both men and women was in the 70-year-old group (39% and 37% respectively).
The presence of bilateral notched hearing loss can be indicative of ototraumatic noise exposure (McBride & Williams, 2001). The depth of the 4 kHz notch was calculated by comparison with the 2 and 8 kHz average, and notched loss was defined as a bilateral notched depth of 20 dB or greater. As shown in Table 1, this diagnosis was very uncommon for women of any age, but also uncommon for men. The largest proportional incidence was for the 50-year-old male group, where it was still a modest 15%.
Hearing Loss was defined following Cruickshanks et al. (1998) as the presence in the worse ear of a PTT average (0.5, 1, 2, 4kHz) greater than 25dB HL. As shown in Table 1, such hearing loss was absent in all the 20- and 30-year-old subjects, but the prevalence of hearing loss increased for both males and female with age. An unusually high proportion of the 40-year-old males had hearing loss (25%). Males between 50 and 80 were 43% more likely than females to have hearing loss and all of the 90-year-old subjects presented with hearing loss.
3.1.4 Correlation structure in the data
The 30 hearing measures used here are all highly correlated, with every bivariate correlation being highly significant (p<0.001). Generally, the further apart in frequency, the lower was the correlation between measures. Excluding the diagonal terms (correlating each measure with itself), the average absolute value of Pearson s r was 0.576, and the minimum was 0.351 (between R250 PTT and L1001 DP). The average Pearson s r for all right ear PTT vs. all other right ear PTTs was 0.611, while for left ear PTTs it was 0.623, and between the right and left ears it was 0.599. The DPOAEs were also very highly correlated, with all right ear DPs vs. each other having r = 0.638, left ears r = 0.630, and between left and right r = 0.597. In addition, the PTT and DPOAE were all highly negatively correlated. Right ear PTT vs. DPOAE had r = −0.560, while for the left ear this was −0.518. Lastly the Right ear PTT vs. left ear DPOAE had r = −0.518, while the Left ear PTT vs. right ear DPOAE had r = −0.563.
These strong correlations suggest an underlying variable that co-modulates all these hearing measures. Age is a good candidate for this variable, and when partial correlations were calculated, while controlling for Age, the correlations listed above were all reduced, however they all remained highly significantly correlated (p<0.001). Controlling for Age, the average Pearson s r for all right ear PTT vs. all other right ear PTTs was 0.450, for left ear PTTs was 0.478, and for right vs. left ear PTT it was 0.440. The DPOAEs also remained correlated, with all right ear DPs vs. each other having r = 0.490, left ears 0.479, and left vs. right had r = 0.431. In addition, the PTT and DPOAE were all highly negatively correlated. Right ear PTT vs. DPOAE had r = −0.384, while for the left ear this was −0.330. Lastly the Right ear PTT vs. left ear DPOAE had r = −0.322, while the Left ear PTT vs. right ear DPOAE had r = −0.392.
3.2 Hierarchical Cluster Analysis
Hierarchical clustering failed to reveal natural clusters in the data. Visual inspection of the dendrograms of the different data sets (not shown) never showed hierarchical clustering; rather the data split continuously into very small groupings of data points. The maximum ratio of within- to between-cluster distances was 1.15, meaning that the largest distance from one cluster to another was only 15% larger than the average distances between members of those two clusters. This small separation between hierarchical clusters strongly suggests that natural sub-groupings are absent from this data set. The co-phenetic distance is a correlation coefficient for the hierarchical cluster tree and signifies how well the dendrogram represents dissimilarities among the data. For the linkage using all 30 variables, the co-phenetic distance was 0.254. Of the subsets examined, the largest co-phenetic distance was 0.593 for the Left Ear PTT. All datasets showed poor linkage, indicating they are not well suited to hierarchical clustering. This again indicates that there are no natural divisions in this dataset and variation is likely continuous rather than categorical.
3.3 Principal component analysis and post-hoc clustering
As identified above in section 3.1.4, all of the measures of hearing here are highly correlated, even after controlling for age. This strongly suggests the existence of underlying factors that simultaneously act on all these measures to produce this correlation structure. Principal component analysis is a means of generating a representation of the data, where the principal component vectors (PCs) are all mutually orthogonal, and are ordered so that the first PC accounts for the most variance in the data, and the last accounts for the least. The first PC of these data accounts for fully 66% of variance. The second PC accounts for an additional 8%, while the higher-order components each capture less than 5% of the variance, but together account for the remaining 25%.
The PC vectors are weighting functions that list how the original variables combine to produce the principal components. The first two PCs are plotted in Figure 3 as a function of stimulus frequency for the right ear PTT and DPOAE. The two frequency axes are plotted to the same scale to show the correspondence of the PTT and DPOAE weightings in the PC vectors. The first PC weights all PTT positively and all DPOAE negatively. The weightings are larger for higher frequencies, which may reflect the increase in threshold variance with PTT frequency. A hearing phenotype will score high on PC1 if the PTT are large and the DPOAE are small. Conversely, it would score low if the PTT are small and the DPOAE are large. As such, the PC1 score captures the overall degree of hearing loss in the phenotype.
Figure 3.
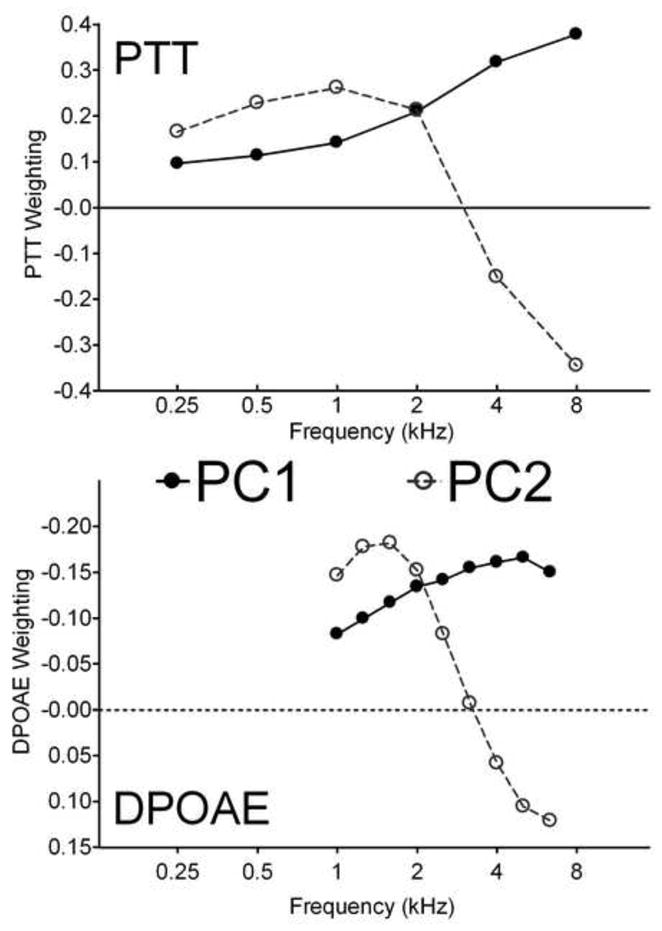
Weighting functions of the first two principal components for Right ear PTT (upper) and DPOAE (lower), plotted as a function of stimulus frequency. The first component weights all PTT positively and all DPOAE negatively, with a bias for higher frequencies: it represents a measure of overall hearing loss. The second component positively weights low frequencies and negatively weights high frequencies: it represents differential high-frequency vs. low-frequency hearing loss.
The second PC differentially weights high and low frequency measures. A phenotype will score highly on PC2 if the PTT are larger for frequencies below 4 kHz than they are for 4 and 8 kHz. Likewise, if the DPOAE are stronger below 4 kHz than they are above, then the PC2 score will increase. PC2 apparently captures differential hearing loss in the phenotype. A negative score on PC2 would correspond to high frequency sloping loss, while a positive score would represent a flatter loss. The very high proportion of variance captured by the first two principal components suggests that they might provide a natural coordinate system for representing the hearing loss associated with aging. Figure 4 shows the data from all 960 subjects projected into the space of the first two principal components. The data are continuously distributed in this space with little evidence for natural breaks or clustering.
Figure 4.
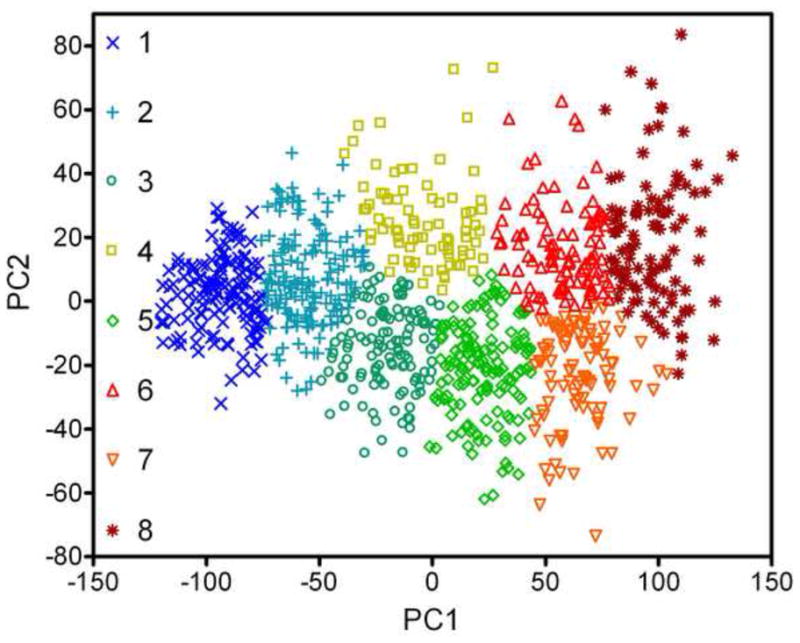
Representation of the PTT and DPOAE data for each of the 960 subjects in the two-dimensional space of the first and second principal components. While they are continuously distributed in this space, the data are categorized and labeled according to the results of a K-means cluster analysis.
Despite the apparent absence of a natural hierarchy of clusters in the data, there is heuristic value in partitioning the data into subregions. The data shown in Figure 4 were divided into 8 clusters using the K-means algorithm. While there are many ways to partition data, the K-mean method is objective and free of bias, save that the number of clusters is specified a priori. Of the different clusters attempted (N = 2 to 10) eight clusters were chosen here because this number produces clusters that alternate above and below the PC2 = 0 line, and that distribute evenly along PC1. Clusters 1 and 2 have large negative PC1 scores and are centered on the PC2 = 0 line with limited extent either side. Large negative PC1 corresponds good hearing, which naturally constrains PC2. As PC1 becomes more positive the range of possible PC2 scores increases.
To better interpret the segregation introduced by the K-mean clustering, the average PTT and DPOAE were calculated for each cluster and these are shown in Figure 5. Cluster 1 has grouped phenotypes with no hearing loss and strong DPOAEs, while Cluster 2 shows very mild change in PTT but a relatively large and flat drop in DPOAE of approximately one third. Clusters 3, 5, and 7 and Clusters 4, 6, and 8 appear to form two distinct families of hearing loss. Clusters 3, 5, and 7 demonstrate increasing severity of Steeply Sloping Hearing Loss, while Clusters 4, 6, and 8 show increasing severity of Flat to Gently Sloping Hearing Loss. The DPOAE data for the clusters broadly mirrors the change in PTT, with predominantly high frequency loss in the Steeply Sloping family, and low frequency loss in the Flat, although DPOAEs were essentially absent for clusters 7 and 8.
Figure 5.

Right ear PTT and DPOAE for the centroids of the eight clusters determined using K-means analysis. The clusters represent No Hearing Loss (1), Mild Hearing Loss (2), Steeply Sloping Loss of increasing degree (3, 5, 7), and Flat to Gently Sloping Loss of increasing degree (4, 6, 8).
Table 2 lists the breakdown of cluster membership by age and sex. The No Loss cluster 1 includes most of the 20- and 30-year olds, but some Males as old at 60 and Females as old as 70. Women outnumbered men by more than 2:1 in the Mild Loss cluster 2. Female were nearly equally represented in the Flat and Steeply Sloping cluster families while males were twice as likely to be in the Steeply Sloping family of clusters rather than the Flat.
Table 2.
Cluster membership by age and gender (Male/Female).
| Decade | 1 No Loss | 2 Mild | 3 Mild HF | 4 Mild Flat | 5 Mod. HF | 6 Mod. Flat | 7 Sev. HF | 8 Sev. Flat | Total |
|---|---|---|---|---|---|---|---|---|---|
| 20 (18–24) | 44/44 | 7/3 | 0/0 | 0/2 | 1/0 | 0/0 | 0/0 | 0/0 | 52/49 |
| 30 (25–34) | 8/7 | 4/2 | 1/0 | 0/0 | 0/0 | 0/0 | 0/0 | 0/0 | 13/9 |
| 40 (35–44) | 3/9 | 5/6 | 0/1 | 2/5 | 0/0 | 1/1 | 0/0 | 1/0 | 12/22 |
| 50 (45–54) | 4/10 | 8/21 | 7/3 | 3/4 | 3/0 | 0/0 | 1/0 | 0/0 | 26/38 |
| 60 (55–64) | 6/8 | 17/43 | 13/30 | 9/22 | 14/23 | 5/9 | 7/1 | 3/2 | 74/138 |
| 70 (65–74) | 0/2 | 13/34 | 17/39 | 4/18 | 44/32 | 13/25 | 32/13 | 23/15 | 146/178 |
| 80 (74–84) | 0/0 | 0/2 | 2/11 | 1/11 | 10/21 | 16/29 | 21/16 | 31/18 | 81/108 |
| 90 (84–92) | 0/0 | 0/0 | 0/0 | 0/0 | 0/0 | 0/2 | 2/2 | 2/6 | 4/10 |
| Total | 65/80 | 54/111 | 40/84 | 19/62 | 72/76 | 35/66 | 63/32 | 60/41 | 408/552 |
Bivariate correlations among Age, PC1, and PC2 were calculated for Males and Females separately. For Males the correlation of Age with PC1 and PC2 was highly significant (p<0.001) with Pearson s r of 0.787 for PC1 and −0.198 for PC2. For Females, the correlation of Age and PC1 was highly significant (r = 0.717, p<0.001), but there was no correlation with PC2 (r = −0.040, p>0.3). Because they are orthogonal, PC1 and PC2 are not correlated overall, but they are significantly correlated for Females when broken down by sex (PC1 vs. PC2, Females, r = 0.106, p<0.05; Males, r = −0.066, p>0.1), though the effect size was small, accounting for only about 1% of the variance in the females. These relationships may be interpreted as indicating that with age, Males show an increase in PC1 and a decrease in PC2 and tend to lose overall hearing but also preferentially high-frequency hearing, perhaps owing to the accumulated damage suggested in a number of previous reports. For females, Age increases PC1 and PC2, producing a flatter and gentle sloping loss.
4. Discussion
4.1 Comparison of this dataset with previous reports
Bilateral pure tone thresholds and DPOAE amplitudes from 960 research subjects aged 18 to 92 years were examined in order to characterize presbycusis phenotypes. The analysis was phenomenological, with the intent of imposing as few assumptions as possible about the underlying structure of the data, including the dependence of presbycusis on calendar age, which is why young and middle aged subjects are included, and not just elderly. DPOAE amplitudes were included because prior reports indicate that these have an age-dependent decline that may be, at least partially, independent of pure tone threshold shifts (Oeken et al. 2000; Mills 2003, 2006; Gates et al. 2008).
The Sex × Age × Frequency effects described here are very similar to previous reports (Cruickshanks et al, 1998; Dubno et al, 2008; Demeester et al, 2009), and we have deliberately presented mean data in Figure 1 following these prior reports. We note that the data generally have skewed, non-normal distributions. The median should be the preferred summary statistic of central tendency for data of this sort (medians were used to generate the normative data schedules for presbycusis; Robinson and Sutton, 1979). On the other hand, presenting medians (or even full percentile rankings) broken out by sex, age, and frequency provides little information about specific audiometric configurations in the contributing data. The results of the ANOVA on the PTT data showed only a modest effect size for Sex, which is surprising, given the distinct differences in the mean data in Figure 1. However, there is much overlap between the hearing phenotypes of the sexes, which is not evident in summary plots that only show distribution means.
Demeester et al. (2009) partitioned audiograms for each ear of 1147 research subjects aged 55 to 65 years into one of six categories, with the vast majority being in the Flat, Gently Sloping, and Steeply Sloping categories. We used their a priori criteria with our dataset, and the resulting categorization is listed in Table 1. For brevity, we did not present the Right Ear by Left Ear breakdown of the results, rather pooling instances where the two ears had different categories. In our data set there were a substantial number of subjects with apparent Between-ear PTT Asymmetry, especially in the 60 and 70-year-old age ranges. The frequency of Between-ear PTT Asymmetry shows some agreement with the frequency of the L≠R classification; however, they may capture different aspects of Between-ear Asymmetric hearing loss. The common clinical definition of asymmetric hearing loss is that at least one frequency has PTT that differ between the ears by 15 dB or more (Urben et al., 1999). This is a rather liberal definition, and we note that when using the criteria of Demeester et al. (2009) instead, the prevalence of asymmetry in our data is similar to theirs. We found no significant overall difference between the two ears of our subjects, which is somewhat counter to that reported by Cruickshanks (1998), who found that right ear hearing was better than that of the left ear. This difference may be due to the different study designs, and the fact that we include young as well as elderly subjects. In our sample as a whole there was a small but non-significant right ear advantage (488 Right, 472 Left; Binomial test, p>0.6). By limiting the comparison to ages 65 and older, the right ear advantage became more prevalent but still not significantly different than chance (276 right, 250 left; Binomial test, p>0.2).
The small number of subjects in our dataset that have a defined 4 kHz notch may validate the subjects self assessment of little to no noise exposure. However, we note that McBride and Williams (2008) recently examined the prevalence of a notch hearing loss after known noise exposure. They counted unilateral notches, and also found notches for which the frequencies did not agree between the two ears. Only about half of their sample showed notched hearing loss, suggesting that notch hearing loss might not be a very sensitive indicator of ototraumatic noise exposure, or alternatively that susceptibility to notched loss varies greatly in the population.
4.2 Average Auditory Age
We have introduced a novel hearing loss statistic that we term the Average Auditory Age. The AAA is calculated from the subject s audiogram, by reversing the order of the equations of Robinson and Sutton (1979), which generate median hearing thresholds for a specified Sex, Age, and Audiometric Frequency. While the majority of subjects have AAA within a normal range, there are many with worse hearing than expected for their age (Lead Ears), but also many with better than expected hearing (Golden Ears). The tools developed here may prove useful in identifying extreme examples of successful and unsuccessful auditory aging. These outlying individuals could be the subject of further study of genetic or environmental factors in order to determine what distinguishes them from each other, and from the large majority of listeners with intermediate hearing loss.
While not particularly convenient for manual calculation, the AAA nonetheless offers a useful take home statistic for subjects and patients, as well as offering an intuitive single number to quantify a subject s hearing. The major problem with a single hearing statistic is that it disregards all information about audiometric configuration, much as the normative data tables for presbycusis do (ANSI, 1996; ISO, 2000). To illustrate this point, we calculated AAA for the 8 clusters shown in Figures 4 and 5. Unsurprisingly, the No Loss cluster 1 has an AAA of 18 years, while the mild loss cluster 2 has an AAA of 50 years. The High Frequency Sloping Loss clusters 3, 5, and 7 have AAA of 59, 71, and 78 years respectively, while the Flat Loss clusters 4, 6, and 8 have AAA of 70, 87, and 96 years. Overall, the Flat loss clusters appear older because the AAA is more sensitive to losses at lower frequencies than at high frequencies. Hence, when an audiogram yields a specific AAA, say 70 years, the corollary question must be What type of 70-year-old? There appear to be insufficient resources at present to address this question, and we conclude that it would be very useful to update the existing normative data tables for presbycusis in order to account in some way for the variety of audiometric configurations that are found in the elderly.
4.3 Reduction of the data set by Principal Component Analysis
Principal component analysis was highly successful at reducing the 30 hearing measures into two factors that describe most of the variation in the data. The first principal component accounts for 2/3 of the variance in this data set and this strong single factor arises because of the high correlation among all the PTT and DPOAE data. The weighting function of PC1 has the general shape of the mean data of Figure 1, indicating that various degrees of this single measure capture the overall central tendency of the data. This is consistent with the high correlation of PC1 with Age. The second principal component provides a smaller contribution to the overall variance, however it represents a key finding of this report, namely that presbycusis phenotypes are essentially distinguished by differential hearing loss between high and low frequencies. This can be seen directly in the weighting function for PC2 plotted in Figure 3. In addition, it is noteworthy that in Figure 4 there is increased dispersion in PC2 as PC1 moves from negative to positive. We can conclude that while there is only one basic configuration associated with No Hearing Loss (Cluster 1), with increasing loss phenotypes become more diverse in their possible audiometric configurations. However these configurations are not arbitrary and they can be well-described by PC2 and its differential weighting of high- and low- frequency hearing loss.
The results of hierarchical cluster analysis and the principal component analysis strongly indicate that there are no natural categorical boundaries in this dataset. The data of Figure 4 have been labeled categorically according to the results of the k-means cluster analysis. Inspection reveals that these clusters all have fluid and arbitrary boundaries. Nevertheless, clusters do group similar phenotypes. In this sense selective arbitrary clustering may be very useful in describing different groupings of presbycusis phenotypes (which might be termed strial or sensorineural), as long as the arbitrary nature of these categorical boundaries is recognized. In evaluating the distribution of ages and sexes in the clusters listed in Table 2, perhaps the most striking feature may be that despite the paucity of elderly with No Loss and of young people with Severe Loss, there is a very broad distribution of both Males and Females across the clusters at all ages. This is another indication that while broad families of hearing loss do emerge in these data, presbycusis manifests as a very heterogeneous disorder. Our results here recapitulate the basic results compiled by Robinson and Sutton (1979) for average trends in presbycusis data, while the overall spread of the dataset in the space of PC1 and PC2 highlights the heterogeneity of age-related hearing loss. It is interesting that the extremes of this distribution are consistent with the hearing loss types described by Schuknecht and others.
4.4 Comparison of hearing summary statistics
To further evaluate the utility of the principal components in explaining the data set, we calculated four metrics for the audiometric data for each of our subjects ears. These are shown in Figure 6: A) the pure tone average (0.5, 1, 2, 4 kHz), which Cruikshanks et al. (1998) used to categorize Hearing Loss (PTA > 25 dB HL); B) the difference between the 4 & 8 kHz average and the 0.5 & 1 kHz average, which Demeester et al. (2009) used to categorize Gently (15 < Difference < 30 dB HL) or Steeply Sloping Hearing Loss (Difference > 30dB HL); C) the pure average (0.25, 0.5, 1, 2, 4, 8 kHz) weighted by PC1; D) the pure average (0.25, 0.5, 1, 2, 4, 8 kHz) weighted by PC2. These plots all show bimodal distributions, which visually confirms that there are young and old sub-populations in this dataset, and that they overlap in their properties. In each of these figures the solid line is the bimodal fitting, while the dotted and dashed lines show the theoretical sub-populations produced by these fittings. The gray-filled areas represent that data for subjects over 65 years of age and in each case they show close correspondence with one of the sub-populations. In figure 6A, it is apparent that a 25 dB HL cutoff represents the upper tail of a Low PTA distribution. This supports this criterion being used as a break point for defining hearing loss, although this is not a natural breakpoint in the overall distribution. Some of the elderly lie below this cutoff, but generally match the High PTA distribution. Contrasting with Figure 6C however, we note that including 0.25 and 8 kHz in the average and weighting by PC1 has produced a much clearer separation of two sub-populations into Low PTA and High PTA subjects. The High PTA grouping again shows a close correspondence with the elderly subjects data.
Figure 6.
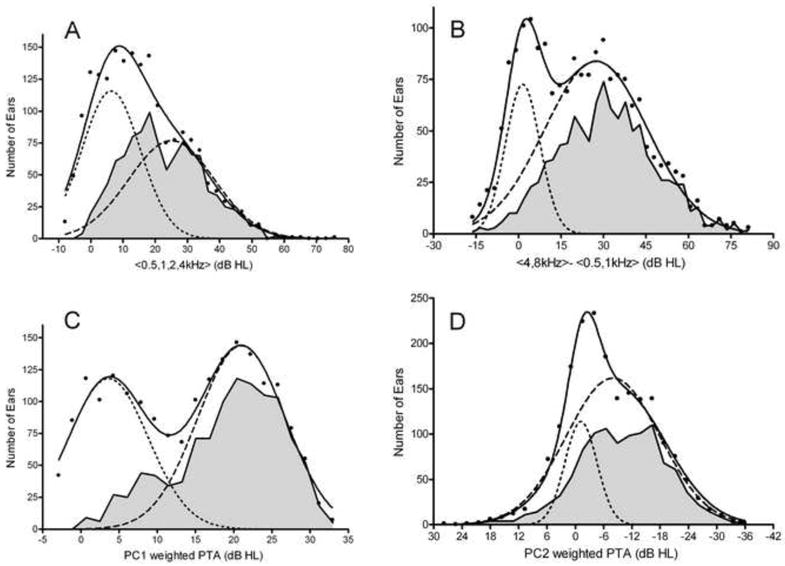
Distributions of Overall and Differential Hearing Loss. Histograms of number of ears based on A) Pure tone average of 0.5, 1, 2, and 4 kHz; B) Difference between the averages of 4 & 8 kHz and 0.5 & 1 kHz; C) PC1 weighted 0.5 to 8kHz pure tone average; D) PC2 weighted 0.5 to 8kHz pure tone average. All four distributions appear bimodal and are well-fit by two Gaussian distributions. The gray shaded areas show data for subjects older than 65 years.
In Figure 6B we note that the upper tail of the Low Difference dotted line is near 15 dB, which was the initial cutoff for Gently Sloping audiograms used by Demeester et al. (2009), and that 30 dB is near the center of the High Difference dashed line, also supporting the use of this cutoff to define Steeply Sloping configurations. Again, the elderly account for the majority of this High Difference distribution. Figure 6D shows two Gaussian populations, the first is small, narrow and centered near 0 PC2, and predominantly represents younger, normal-hearing subjects, with flat no-loss configurations. The larger and much broader population is centered near -10 PC2 and this may represent the diverse PC2 configurations that accompany presbycusis. In fact, the distribution of elderly is again a good fit for this Broad PC2 distribution, save that it has lower kurtosis, being broader and flatter than a normal distribution.
In each of these cases, the elderly phenotypes fall into broad normal distributions. Normal distributions often arise in nature as the sum of a large number of independent random processes. We speculate that with aging, there are many possible microscopic processes that may degrade hearing, each producing an incremental upward progression in PC1. These microscopic degenerative processes could affect different portions of the cochlea (stria vascularis, inner and outer hair cells, the spiral ganglion; Nelson and Hinojosa, 2003, 2005), and the cumulative effect in any particular individual would manifest as a specific presbycusis phenotype that reflects this history. At the population level, the signature of these many random degenerative processes could be the broad distribution of PC2 scores that we report here. However, the recent demonstration of a strong correlation between low-frequency presbycusis and cerebrovascular and peripheral arterial disease by Friedland and colleagues (Friedland et al. 2009), suggest that stria vascularis dysfunction caused by cardiovascular disease is likely a key mechanism underlying presybucusis.
Longitudinal data on the progression of presbycusis in individuals could be used to evaluate the predictions of different theories of presbycusis. A cumulative micro-insult model, such as the one we speculate is responsible for the pattern of results here, would predict a random progression in PC2 with age but a steady increase in PC1. Conversely, if a single mechanism dominated hearing loss in an individual, their trajectory in PC1-PC2 space would be linear. For example, progressive high frequency sensorineural hearing loss would manifest as a straight line of increasingly negative PC2 with increasing PC1. A progressive flat loss produced by strial presbycusis might simply show increasing PC2 with PC1. Plausibly, strial loss produces progressive hearing loss in humans that mimics the Gerbil model (Schmiedt, 1996; Mills, 2003; 2006; Mills & Schmiedt, 2004), where the initial loss is gently sloping, but as the disorder worsens the hearing profile tends to flatten out. The curves of Figure 5 can be used to illustrate this point: subjects exhibiting progressive strial dysfunction might progress from group 5 to 6 and 7 to 8, with low frequency loss progressively filling in preexisting higher frequency loss. Such hearing loss would follow a J shaped trajectory in the PC1-PC2 space, initially tending negative in PC2 but then moving upwards to positive PC2 as hearing loss progresses. Application of the methods developed here to longitudinal data sets could help disambiguate these possible scenarios.
While the principal components are computationally more complex than simple pure tone averages, they have proven effective in reducing and summarizing the dataset, and appear to produce metrics that allow better segregation of sub-populations in the data, by explicitly transforming the dataset into dimensions that contain the most variation. One caution in using these results is that PCA is essentially a statistical tool for describing a given dataset. Consequently analyzing a different set could yield quite different answers, especially if a different subject selection bias was used. Ideally such an analysis should be performed on different populations for validation of the general approach, including highly screened populations, or unscreened such as the large cohort studied by Cruickshanks et al. (1998).
4.5 DPOAE amplitudes are highly correlated with PTT
Lonsbury-Martin et al. (1991) reported that DPOAEs are reduced in older human subjects and that this reduction accurately tracks the loss of high-frequency hearing. The analysis of Oeken et al. (2000) suggested a possible independent aging effect on DPOAE amplitudes and pure tone thresholds, and Mills (2003, 2006) suggested that comparisons of DPOAE and PTT could distinguish presbycusis subtypes, specifically distinguishing between strial and sensorineural hearing loss. Here we find that DPOAE amplitudes are very highly correlated with PTT, and their inclusion in these analyses does not appear to have revealed distinct strial presbycusis phenotypes. This may be because there are no strial presbycusis phenotypes that are distinct from the overall incremental age-related hearing loss processes discussed above. Alternatively, the measure we included is not appropriate to differentiate strial dysfunction. In fact, Mills (2003, 2006) demonstrates that it is DPOAE thresholds, not amplitudes that provide effective segregation of Gerbil audiometric data from noise injured (sensorineural hearing loss) and furosemide injected (strial hearing loss) animals. Unfortunately, DPOAE growth functions were not collected as part of our subject screening, and we recommend that future studies add this measurement in order to address this issue.
4.6 Presbycusis phenotypes and speech communication
While loss of hearing sensitivity may be the primary phenomenon in presbycusis, it is the reduced quality of speech communication, particularly in competing background noise, that most affects the quality of life for the elderly with hearing loss. The twin effects of peripheral hearing loss and brain aging may interact to worsen this disability. Hearing loss produces predictable changes in speech intelligibility (e.g. Pavlovic et al, 1986), but many studies have shown an additional age-related deterioration in auditory perception that is not simply related to hearing loss, and this likely reflects altered central auditory processing (e.g., Jerger, 1973; Humes, 2005; Divenyi et al. 2005; Dubno, 2008). While beyond the scope of this report, preliminary regression analysis of Hearing in Noise Test (HINT) data for these subjects (Allen and Eddins, 2009) shows that PC1 and PC2 both predict HINT scores in quiet and in background noise. This result is consistent with known hearing loss effects on speech intelligibility, but also suggests an effect of configuration, as indexed by PC2. We note that aging of the brain not only affects central auditory processing. Age-related changes in executive function can affect test-taking ability, and can produce variability in behaviorally determined audiometric thresholds.
4.7 Conclusions
This report demonstrates that a large subject pool and database can offer novel opportunities for evaluating the relationships among various measures of presbycusis. We have introduced a novel hearing statistic, the Average Auditory Age, and our analysis indicates that it would be very useful to update the existing normative data schedules on presbycusis with a statistic that captures differential high- vs. low-frequency hearing loss. Our analysis indicates that there are no categorical boundaries delineating presbycusis phenotypes; however, sub-types of presbycusis can still be identified, especially in the extremes of the data distributions. The phenomenological analysis discussed here may find use in the characterization, diagnosis, and measurement of presbycusis and in evaluation of both mechanistic explanations and ameliorative strategies. Ultimately, presbycusis therapeutics would be greatly enhanced by the development of a biomarker based on non-invasive and cheap audiometric measures, as this would facilitate interventions targeted to specific pathological sub-types.
Supplementary Material
Acknowledgments
We thank Prof. James R. Ison for helpful conversations and comments on this manuscript and two anonymous reviewers for their insightful critiques. This research was supported by USPHS grants AG009524 and DC005409.
Abbreviations
- ARHL
Age-related hearing loss
- AAA
Average Auditory Age
- ANOVA
Analysis of variance
- DPOAE
Distortion Product Otoacoustic Emissions
- PC
Principal Component
- PTT
Pure Tone Thresholds
- HL
Hearing Level
Footnotes
Portions of this work were previously presented at the 32nd Annual Midwinter Research Meeting of the Association for Research in Otolaryngology, February 14-19 2009.
Publisher's Disclaimer: This is a PDF file of an unedited manuscript that has been accepted for publication. As a service to our customers we are providing this early version of the manuscript. The manuscript will undergo copyediting, typesetting, and review of the resulting proof before it is published in its final citable form. Please note that during the production process errors may be discovered which could affect the content, and all legal disclaimers that apply to the journal pertain.
Contributor Information
Paul D. Allen, Email: paul_allen@urmc.rochester.edu.
David A. Eddins, Email: david_eddins@urmc.rochester.edu.
References
- Allen PD, Eddins DA. Cluster analysis reveals presbycusis phenotypes that group subjects by degree and configuration of hearing loss. Assoc Res Otolaryngol Abstr. 2009;32:140. [Google Scholar]
- American National Standards Institute. ANSI S3.44–1996, Determination of Occupational Noise Exposure and Estimation of Noise-Induced Hearing Impairment. New York: Acoustical Society of America; 1996. [Google Scholar]
- American National Standards Institute. American National Standard Specifications for Audiometers. New York: American National Standards Institute; 2004. [Google Scholar]
- Brant LJ, Fozard JL. Age changes in pure-tone hearing thresholds in a longitudinal study of normal human aging. J Acoust Soc Am. 1990;88:813–820. doi: 10.1121/1.399731. [DOI] [PubMed] [Google Scholar]
- Cilento BW, Norton SJ, Gates GA. The effects of aging and hearing loss on distortion product otoacoustic emissions. Otolaryngol Head Neck Surg. 2003;129:382–389. doi: 10.1016/S0194-59980300637-5. [DOI] [PubMed] [Google Scholar]
- Cruickshanks KJ, Wiley TL, Tweed TS, Klein BE, Klein R, Mares-Perlman JA, Nondahl DM. Prevalence of hearing loss in older adults in Beaver Dam, Wisconsin. The Epidemiology of Hearing Loss Study. Am J Epidemiol. 1998;148:879–886. doi: 10.1093/oxfordjournals.aje.a009713. [DOI] [PubMed] [Google Scholar]
- Demeester K, van Wieringen A, Hendrickx J-j, Topsakal V, Fransen E, van Laer L, Van Camp G, Van de Heyning P. Audiometric shape and presbycusis. Int J Audiol. 2009;48:222–232. doi: 10.1080/14992020802441799. [DOI] [PubMed] [Google Scholar]
- Divenyi PL, Stark PB, Haupt KM. Decline of speech understanding and auditory thresholds in the elderly. J Acoust Soc Am. 2005;118:1089–1100. doi: 10.1121/1.1953207. [DOI] [PMC free article] [PubMed] [Google Scholar]
- Dobie RA. Methodological Issues When Comparing Hearing Thresholds of a Group with Population Standards: The Case of the Ferry Engineers. Ear & Hear. 2006;27:526–537. doi: 10.1097/01.aud.0000233863.39603.f5. [DOI] [PubMed] [Google Scholar]
- Dubno JR, Lee F-S, Matthews LJ, Ahlstrom JB, Horwitz AR, Mills JH. Longitudinal changes in speech recognition in older persons. J Acoust Soc Am. 2008;123:462–475. doi: 10.1121/1.2817362. [DOI] [PubMed] [Google Scholar]
- Friedland DR, Cederberg C, Tarima T. Audiometric Pattern as a Predictor of Cardiovascular Status: Development of a Model for Assessment of Risk. Laryngoscope. 2009;119:473–486. doi: 10.1002/lary.20130. [DOI] [PubMed] [Google Scholar]
- Gates GA, Mills D, Nam BH, D'Agostino R, Rubel EW. Effects of age on the distortion product otoacoustic emission growth functions. Hear Res. 2002;163:53–60. doi: 10.1016/s0378-5955(01)00377-x. [DOI] [PubMed] [Google Scholar]
- Gates GA, Mills JH. Presbycusis. Lancet. 2005;366:1111–1120. doi: 10.1016/S0140-6736(05)67423-5. [DOI] [PubMed] [Google Scholar]
- Glorig A, Nixon J. Hearing loss as a function of age. Laryngoscope. 1962;72:1596–1610. doi: 10.1288/00005537-196211000-00006. [DOI] [PubMed] [Google Scholar]
- Humes LE. Do auditory processing tests measure auditory processing in the elderly? Ear Hear. 2005;26:109–119. doi: 10.1097/00003446-200504000-00001. [DOI] [PubMed] [Google Scholar]
- International Organization for Standardization. ISO 7029. Geneva, Switzerland: International Organization for Standardization; 2000. Acoustics: Statistical distribution of hearing thresholds as a function of age. [Google Scholar]
- Jerger J. Audiological findings in aging. Adv Oto-Rhino-Laryngol. 1973;20:115–124. [PubMed] [Google Scholar]
- Kujawa SG, Liberman MC. Acceleration of Age-Related Hearing Loss by Early Noise Exposure: Evidence of a Misspent Youth. J Neurosci. 2006;26:2115–2123. doi: 10.1523/JNEUROSCI.4985-05.2006. [DOI] [PMC free article] [PubMed] [Google Scholar]
- Kujawa SG, Liberman MC. Adding Insult to Injury: Cochlear Nerve Degeneration after “Temporary” Noise-Induced Hearing Loss. J Neurosci. 2009;29:14077–14085. doi: 10.1523/JNEUROSCI.2845-09.2009. [DOI] [PMC free article] [PubMed] [Google Scholar]
- Lonsbury-Martin BL, Cutler WN, Martin GK. Evidence for the influence of aging on distortion-product otoacoustic emissions in humans. J Acoust Soc Am. 1991;89:1749–1759. doi: 10.1121/1.401009. [DOI] [PubMed] [Google Scholar]
- McBride DI, Williams S. Audiometric notch as a sign of noise induced hearing loss. Occup Environ Med. 2001;58:46–51. doi: 10.1136/oem.58.1.46. [DOI] [PMC free article] [PubMed] [Google Scholar]
- Mills JH, Schmiedt RA, Kulish LF. Age-related changes of auditory potentials of Mongolian gerbil. Hearing Res. 1990;46:201–210. doi: 10.1016/0378-5955(90)90002-7. [DOI] [PubMed] [Google Scholar]
- Mills DM. Differential responses to acoustic damage and furosemide in auditory brainstem and otoacoustic emission measures. J Acoust Soc Am. 2003;113:914–924. doi: 10.1121/1.1535942. [DOI] [PubMed] [Google Scholar]
- Mills DM. Determining the Cause of Hearing Loss: Differential Diagnosis Using a Comparison of Audiometric and Otoacoustic Emission Responses. Ear & Hear. 2006;27:508–525. doi: 10.1097/01.aud.0000233885.02706.ad. [DOI] [PubMed] [Google Scholar]
- Mills DM, Schmiedt RA. Metabolic presbycusis: differential changes in auditory brainstem and otoacoustic emission responses with chronic furosemide application in the gerbil. J Assoc Res Otolaryngol. 2004;5:1–10. doi: 10.1007/s10162-003-4004-3. [DOI] [PMC free article] [PubMed] [Google Scholar]
- Mills DM, Feeney MP, Gates GA. Evaluation of cochlear hearing disorders: normative distortion product otoacoustic emission measurements. Ear Hear. 2007;28:778–792. doi: 10.1097/AUD.0b013e3181576755. [DOI] [PubMed] [Google Scholar]
- Nelson EG, Hinojosa R. Presbycusis: a human temporal bone study of individuals with flat audiometric patterns of hearing loss using a new method to quantify stria vascularis volume. Laryngoscope. 2003;113:1672–1686. doi: 10.1097/00005537-200310000-00006. [DOI] [PubMed] [Google Scholar]
- Nelson EG, Hinojosa R. Presbycusis: a human temporal bone study of individuals with downward sloping audiometric patterns of hearing loss and review of the literature. Laryngoscope. 2006;116:1–12. doi: 10.1097/01.mlg.0000236089.44566.62. [DOI] [PubMed] [Google Scholar]
- Oeken J, Lenk A, Bootz F. Influence of age and presbyacusis on DPOAE. Acta Otolaryngol. 2000;120:396–403. doi: 10.1080/000164800750000630. [DOI] [PubMed] [Google Scholar]
- Ohlemiller KK. Contributions of mouse models to understanding of age- and noise-related hearing loss. Brain Res. 2006;1091:89–102. doi: 10.1016/j.brainres.2006.03.017. [DOI] [PubMed] [Google Scholar]
- Pavlovic CV, Studebaker GA, Sherbetoe RL. An articulation index based procedure for predicting the speech recognition performance of hearing-impaired individuals. J Acoust Soc Am. 1986;80:50–57. doi: 10.1121/1.394082. [DOI] [PubMed] [Google Scholar]
- Ramadan HH, Schuknecht HF. Is there a conductive type of presbycusis? Otolaryngol Head Neck Surg. 1989;100:30–34. doi: 10.1177/019459988910000105. [DOI] [PubMed] [Google Scholar]
- Robinson DW. Threshold of hearing as a function of age and sex for the typical unscreened population. Br J Audiol. 1988;22:5–20. doi: 10.3109/03005368809077793. [DOI] [PubMed] [Google Scholar]
- Robinson D, Sutton G. Age effect in hearing: a comparative analysis of published threshold data. Audiol. 1979;18:320–334. [PubMed] [Google Scholar]
- Roosa DBStJ. Presbykousis. Trans Am Otol Soc. 1885;3:449–460. [Google Scholar]
- Schmiedt RA. Effects of aging on potassium homeostasis and the endocochlear potential in the gerbil cochlea. Hear Res. 1996;102:125–32. doi: 10.1016/s0378-5955(96)00154-2. [DOI] [PubMed] [Google Scholar]
- Schuknecht HF, Gacek MR. Cochlear pathology in presbycusis. Ann Otol Rhinol Laryngol. 1993;102:1–16. doi: 10.1177/00034894931020S101. [DOI] [PubMed] [Google Scholar]
- Urben SL, Benninger MS, Gibbens ND. Asymmetric sensorineural hearing loss in a community-based population. Otolaryngol Head Neck Surg. 1999;120:809–814. doi: 10.1016/S0194-5998(99)70318-9. [DOI] [PubMed] [Google Scholar]
Associated Data
This section collects any data citations, data availability statements, or supplementary materials included in this article.