

Abstract
The goal of this article is to gain a better understanding of the denatured state ensemble (DSE) of proteins through an experimental and computational study of their denaturation by urea. Proteins unfold to different extents in urea and the most hydrophobic proteins have the most compact DSE and contain almost as much secondary structure as folded proteins. Proteins that unfold to the greatest extent near pH 7 still contain substantial amounts of secondary structure. At low pH, the DSE expands due to charge–charge interactions and when the net charge per residue is high, most of the secondary structure is disrupted. The proteins in the DSE appear to contain substantial amounts of polyproline II conformation at high urea concentrations. In all cases considered, including staph nuclease, the extent of unfolding by urea can be accounted for using the data and approach developed in the laboratory of Wayne Bolen (Auton et al., Proc Natl Acad Sci 2007; 104:15317–15323).
Keywords: urea denaturation, denatured state ensemble, m values, hydrophobic interactions, electrostatic interactions, polyproline II
Introduction
Characterizing the denatured state ensemble (DSE) is crucial for understanding protein stability and the mechanism of protein folding,1–3 and progress is being made using a variety of approaches.4–12 The realization that many proteins are unfolded or have regions of the polypeptide chain that are disordered under physiological conditions has made this even more important.13–15 These proteins are referred to as intrinsically disordered proteins (IDPs) and the number identified is now over 500. Some of the characteristics, such as hydrophobicity and mean net charge, that distinguish IDPs from proteins that fold have been identified.6,13,16 One aim of this article is to see if these characteristics are similar to those that determine the extent of unfolding of proteins in urea.
Protein chemists have used urea to unfold proteins for many years.17 In 1974, it was shown that an analysis of urea denaturation curves could be used to estimate the stability of a protein.18 The data are used to calculate the free energy of unfolding, ΔG, as a function of urea concentration. It was found that ΔG varies linearly with urea concentration and the data were fit to the following equation:
| (1) |
where m is the slope of a plot of ΔG versus urea molarity and ΔG(H2O) is the value of ΔG at 0M urea, and, consequently, an estimate of the stability of the protein in the absence of denaturant. This method is called the linear extrapolation method (LEM), and it is widely used to measure protein stability,19,20 generally giving stability estimates in good agreement with those determined by analyzing thermal denaturation curves.21,22 In this article, we focus our attention on m and we refer to it as the m value.
Tanford showed that m values depend on the groups that are buried in the folded protein, but exposed to solvent in the unfolded protein.23 Since the groups buried in the folded protein can be estimated,24 the m values can be used to reach conclusions about the DSE. The current interest in m values and the DSE was stimulated by studies on staph nuclease by the Shortle lab.25 They showed that single change in the amino acid sequence could lead to large changes in the m values and concluded, in part, “… the denatured state of this protein under many conditions is not a random coil – it has residual structure ··· this residual structure can be dramatically altered by single mutations ···.”25 Other groups reached similar conclusions based on m values.26–31 Myers et al.32 showed that the GdnHCl and urea m values correlate with the amount of protein surface area newly exposed to solvent upon unfolding, as does the heat capacity change. Several groups have used different approaches and model compound data to account for this observation: Schellman,33 Timasheff,34 Record,35 and Bolen.36
To apply Tanford's approach quantitatively, the free energy of transfer, ΔGtr, of the constituent groups of a protein from water to urea solutions must be known. Some of these values were measured by Tanford and Nozaki37 and others,38,39 but there was considerable uncertainty in the value for the peptide group. More recently, the Bolen group carefully measured transfer free energies for the side chains and backbone units of a protein for urea and many protecting osmolytes.40 They showed that the interactions of urea with the backbone groups of the protein make the major contribution to the m value and were able to predict m values in good agreement with experimental m values.36 This required a model for the DSE of proteins. They chose a DSE model that was intermediate between two extreme models proposed by the Rose Lab41 and used earlier by Schellman.33 This model led to good agreement between the predicted and experimental m values.
Despite the good overall agreement observed by Myers et al.,32 Cannon et al.,35 and Auton et al.,36 it has long been clear that proteins unfold to different extents.18,22 One objective of this article is to see if we can explain why proteins unfold to different extents in urea. In addition, we report m values for a small protein, villin head piece (VHP), with just 36 residues, and a very large protein, an outer surface lipoprotein of Borrelia burgdorferi (VlsE), with 294 residues that extend the previous results.36
For several proteins, the m value measured at pH 3 is twice as large as the m value measured at pH 7.42–49 Originally, it was suggested that electrostatic repulsion among the many positive charges on a protein at pH 3 caused the molecules in the DSE to expand so that more favorable interactions with urea were possible.42 Other explanations have been proposed.50,51 The availability of more reliable ΔGtr values and the evidence that it is mainly the backbone units and not the side chains that determine the m values has made this question even more puzzling.35,36 To gain a better understanding, we have prepared a series of charge variants of RNase Sa for which the net charges varies from +14 to −14 between pH 3 and 7 and measured m values as a function of pH and salt concentration. These results give us better insight into the dramatic shifts in the m values with pH.
Results
Urea denaturation curves were determined for VHP, RNase Sa, and VlsE and the results are shown in Figure 1. These curves were analyzed to calculate ΔG as a function of urea [Eq. (1)], and the results are given in Table I. The m values for VHP and VlsE are the average from three experiments. The m value for RNase Sa was first reported in 199852 and has since been measured by several graduate students. Based on these results, the average m value = 940 ± 40 cal/mol/M. The m values for VHP and VlsE are the smallest and largest values that have been measured for monomeric proteins. Note that RNase Sa is more stable than VHP despite the fact that they have similar (urea)1/2 values, and the stabilities of RNase Sa and VlsE are similar despite the big difference in the (urea)1/2 values (Table I). These are reflections of the large differences in the m values.
Figure 1.
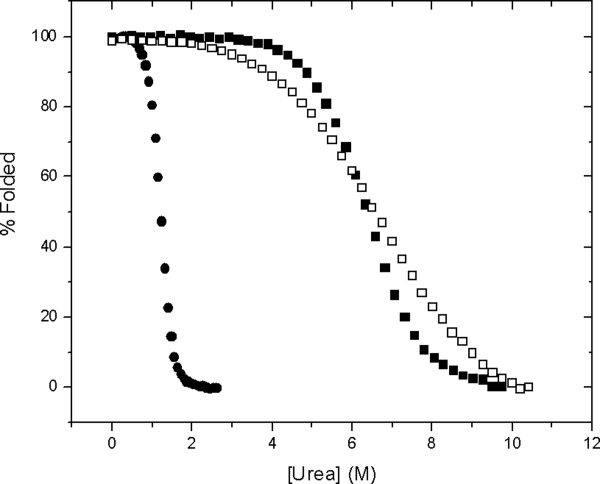
Percent folded protein as a function of urea concentration for VlsE (•), RNase Sa (▪), and VHP (□) in 30 mM Mops, pH 7.0, 25°C.
Table I.
Predicted and Experimental m Values for VHP, RNase Sa, and VlsE
| Protein | Residues | pdb | ΔASA (upper) (Å2)a | ΔASA (lower) (Å2)b | mPred (cal/mol/M)c | mExp (cal/mol/M)d |
|---|---|---|---|---|---|---|
| VHP | 36 | 1YRI | 2465 | 1894 | 424 | 435 ± 20 |
| RNase Sa | 96 | 1RGG | 7503 | 5992 | 1005 | 940 ± 40 |
| VlsE | 338 | 1L8W | 25725 | 21066 | 4216 | 3860 ± 200 |
ΔASA upper is based on the upper boundary model of Creamer et al.41 for the denatured state.
ΔASA lower is based on the lower boundary model of Creamer et al.41 for the denatured state.
The average of ΔASA upper and lower was used to calculate mPred as described by Auton et al.36
mExp are the experimental m values for the proteins determined from urea denaturation experiments at 25°C, pH 7, 30 mM MOPS buffer. The [urea]1/2 values were 6.71 ± 0.04M for VHP, 6.45 ± 0.06M for RNase Sa, and 1.19 ± 0.05M for VlsE. The ΔG(H2O) values in kcal/mol are 2.9 for VHP, 6.1 for RNase Sa, and 4.6 for VlsE.
Urea denaturation curves for RNase Sa 7K (Table II) at a series of pHs between 3 and 7 are shown in Figure 2. At pH 7, the m value is 1.15, but at pH 3, it is doubled to 2.37 cal/mol/M (Table III). This can be seen in the curves in Figure 2: the curves become steeper as the pH decreases. Note also that the m value at pH 3 is identical at 5 and 25°C. Similar studies were done on the charge variants of RNase Sa shown in Table II, and the parameters obtained by fitting the data to Eq. (1) are summarized in Table III. In addition, m values were measured as a function of salt concentration for some of the charge variants and the results are presented in the “Discussion.” For the rest of the article, we will refer to the wild type protein as either RNase Sa or 0K, and the other proteins by the name given in Table II, e.g., 7K or 5REA.
Table II.
Variants of RNase Sa and Their Estimated pI Values and Net Charges at pH 3 and pH 7
| Name | Variant | pIa | Net charge pH 3 | Net charge pH 7 |
|---|---|---|---|---|
| 7K | D1K+D17K+E41K+D25K+E74K+D79K+S31K | 9.75 | 14.4 (15.0, −0.6) | 6.4 (13.4, −7.0) |
| 6K | D1K+D17K+E41K+D25K+E74K+D79K | 9.60 | 13.4 (14.0, −0.6) | 5.4 (12.4, −7.0) |
| 5K | D1K+D17K+E41K+D25K+E74K | 9.20 | 12.3 (13.0, −0.7) | 3.4 (11.4, −8.0) |
| 3K | D1K+D17K+E41K | 6.50 | 10.1 (11.0, −0.9) | −0.6 (9.4, −10.0) |
| 0K | Wild Type | 4.20 | 6.8 (8.0, −1.2) | −6.6 (6.4, −13.0) |
| 1RE | R40E | 4.00 | 5.8 (6.0, −1.2) | −8.6 (5.4, −14.0) |
| 2RE | R40E+R63E | 3.75 | 4.7 (6.0, −1.3) | −10.6 (4.4, −15.0) |
| 3REA | R40E+R63E+R65A | 3.60 | 3.7 (5.0, −3.3) | −11.6 (3.4, −15.0) |
| 5REA | R40E+R63E+R65A+R68A+R69A | 3.40 | 1.7 (3.0, −1.3) | −13.6 (1.4, −15.0) |
The pI and net charge values were calculated using the intrinsic pK values in 0.1M NaCl at 25°C: α-carboxyl = 3.67, Asp = 3.94, Glu = 4.25, His = 6.54, α-amino = 8.00, Tyr = 9.84, Lys = 10.40, and Arg = 12.3.53
Figure 2.
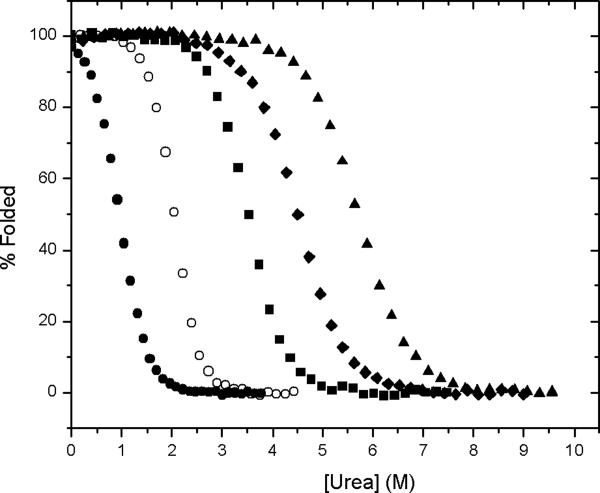
Percent folded protein as a function of urea concentration for RNase Sa 7K at pH 3, 25°C (•), pH 3, 5°C (○), pH 4.16, 25°C (▪), pH 4.74, 25°C (♦), and pH 7.00, 25°C (▴).
Table III.
Parameters Characterizing the Urea Denaturation of RNase Sa and Eight Charge Variantsa
| pH 3b |
pH 7b |
|||||
|---|---|---|---|---|---|---|
| RNase Sac | [Urea]1/2 (M) | m (kcal mol−1M−1) | ΔG(H2O) (kcal mol−1) | [Urea]1/2 (M) | m (kcal mol−1M−1) | ΔG(H2O) (kcal mol−1) |
| 7K | 1.1 | 2.37 | 2.6 | 5.7 | 1.15 | 6.6 |
| 6K | 1.2 | 2.25 | 2.7 | 6.9 | 1.03 | 7.1 |
| 5K | 1.8 | 1.92 | 3.5 | 5.3 | 1.07 | 5.7 |
| 3K | 1.7 | 1.95 | 3.3 | 4.0 | 0.93 | 3.7 |
| 0K | 1.6 | 1.63 | 2.6 | 6.4 | 1.00 | 6.4 |
| 1RE | 1.9 | 1.52 | 2.9 | 6.6 | 0.91 | 6.0 |
| 2RE | 2.2 | 1.66 | 3.7 | 6.4 | 0.91 | 5.8 |
| 3REA | 1.5 | 1.43 | 2.1 | 4.9 | 0.93 | 4.6 |
| 5REA | 4.5 | 1.17 | 5.3 | 4.6 | 0.85 | 3.9 |
The variants are described in Table II.
The urea denaturation curves were determined at 25°C in 30 mM glycine buffer at pH 3 or 30 mM MOPS buffer at pH 7. The [Urea]1/2 and m values are based on 3 to 7 urea denaturation curves and the errors are estimated to be ±10% for the values at pH 3 and about ±2% for [Urea]1/2 and ± 5% for the m values at pH 7.
Circular dichroism (CD) spectra for folded and urea and thermally unfolded RNase Sa are shown in Figure 3. Folded RNase Sa contains 15% α-helix and 20% β-sheet. The unusual positive CD band at 235 nm observed for folded RNase Sa has been discussed previously.54 The CD spectrum of thermally denatured RNase Sa differs substantially from that of the urea denatured protein, as has been observed in studies of other proteins.55 The CD spectrum of the protein in 8.5M urea is consistent with the presence of substantial amounts of polyproline II (PPII) conformation.56,57 The CD spectra of five of the charge variants in Table II are shown in Figure 4. The spectra in 4A suggest that the five proteins have similar conformations in 8.5M urea at pH 7 and that the molecules in the DSE contain similar amounts of the PPII conformation. The spectra in 4B show that in 3.5M urea at pH 3 0K, 5K, and 7K have similar conformations with a reduced content of PPII in the DSE. (These proteins are unfolded at 3.5M urea.) When the urea concentration is increased to 8.5M, the content of PPII is increased and is greater for 5K and 7K than it is for 0K, 3REA, and 5REA. These results will be discussed further below.
Figure 3.
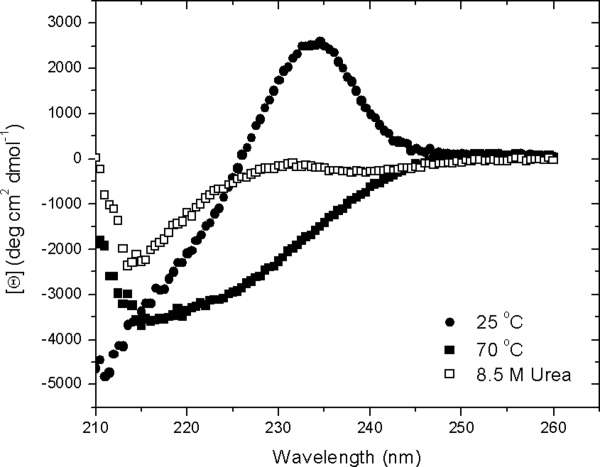
Circular dichroism spectra of RNase Sa in 30 mM MOPS buffer at pH 7, 25° (•), in 30 mM MOPS buffer at pH 7, 70° (▪) and in 8.5M urea, at pH 7, 25° (□).
Figure 4.
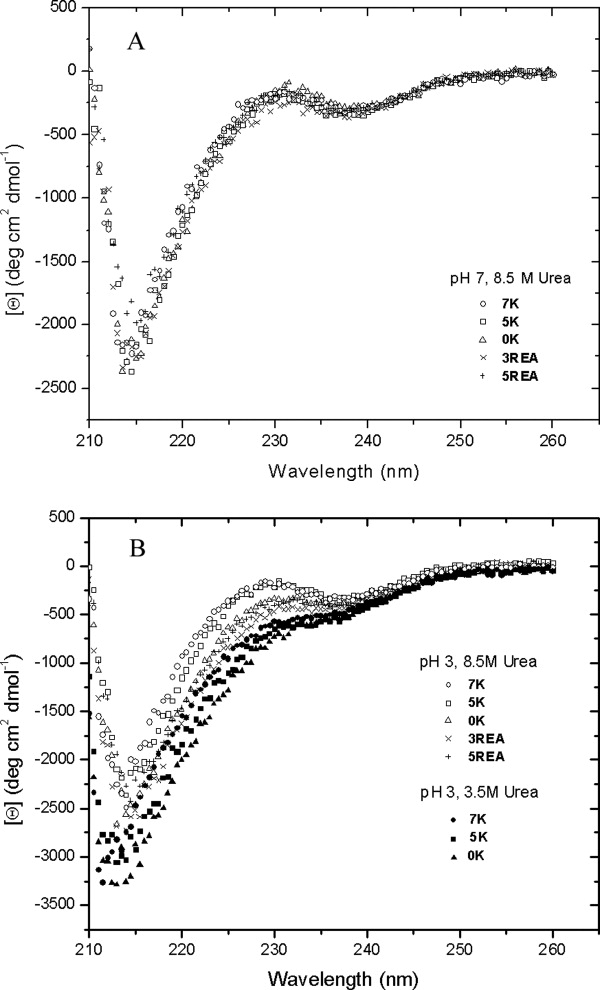
Circular dichroism spectra of RNase Sa and some charge variants (Table II). A: pH 7, 8.5M urea, 25° and B: pH 3, 8.5M urea, 25°C (open symbols), and pH 3, 3.5M urea, 25°C (closed symbols).
Discussion
Urea m values correlate with ΔASA values
It was previously shown that there is a good correlation between urea m values, GdnHCl m values, ΔCp and ΔASA, the change in solvent-accessible surface area when the protein unfolds.32 In this article, we reconsider the urea m values. Previously, we used urea m values for 32 proteins ranging in size from 56 to 270 residues.32 Here, we add urea m values for a smaller protein, VHP, with 36 residues and a larger protein, VlsE, with 338 residues (Table I). Only 294 of the 338 residues in VlsE are visible in the structure of VlsE.58 In addition, we include the m values for RNases Sa, Sa2, and Sa3,52 the m values for RNases H from three species,59–61 and the m values for some proteins included in the analysis by Hong et al.62 and by Auton et al.36 that were not included previously.32 We used only monomeric proteins whose folding approaches a two-state mechanism. For the proteins that have disulfide bonds, the ΔASA values are corrected by subtracting 900 (Å)2 per disulfide bond as described previously.32 For the original list with 32 proteins, m = (0.140 ± 0.005) (ΔASA) with a correlation coefficient of 0.90.32 For the new list of 52 proteins, m = (0.153 ± 0.003) (ΔASA) with a correlation coefficient of 0.94. These results are shown in Figure 5A. In Figure 5B, we show the same plot for the 39 m values from proteins that do not contain disulfide bonds. In this case, m = (0.155 ± 0.003) (ΔASA) with a correlation coefficient of 0.95. The good agreement between the results in 5A and 5B shows that the correction applied for proteins containing disulfide bond is reasonable. Recent studies by the Bolen group36 and the Record group35 both conclude that the major contribution to the urea m value is from the ΔASA of the backbone peptide groups. Consequently, we also plotted urea m values versus the ΔASA of the backbone groups and found: m = (0.55 ± 0.01) (ΔASA backbone groups) with a correlation coefficient of 0.95. The good correlation between the urea m values and ΔASA shows that changes in urea m values can be used to estimate changes in ΔASA.
Figure 5.
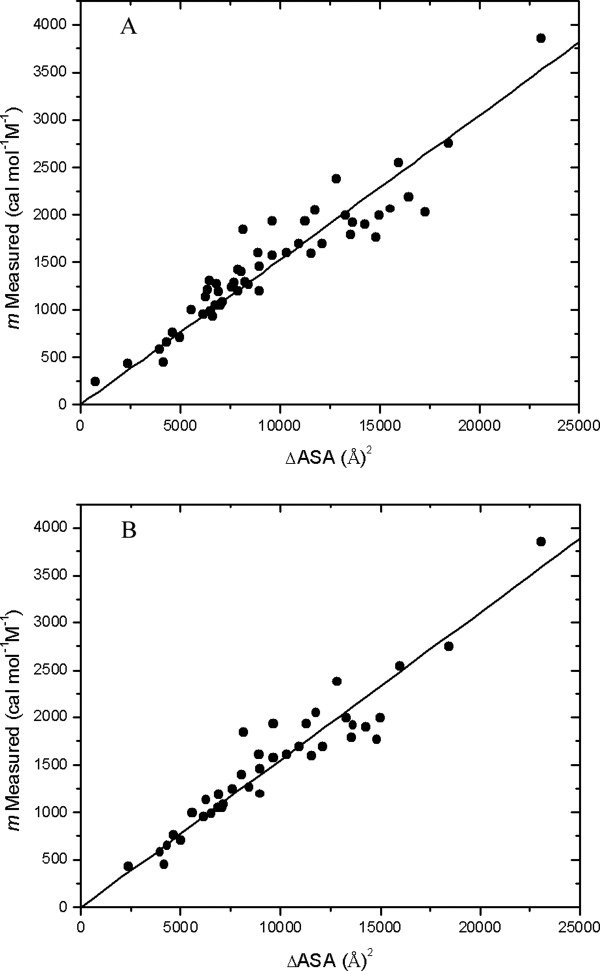
Experimental m values as a function of the change in solvent-accessible surface area for protein unfolding (ΔASA). A: This plot includes all 52 proteins given in the list in the Supporting Information. For the proteins that contain disulfide bonds, 900 (Å)2 was subtracted from the ΔASA per disulfide bond.32 All of the proteins are monomeric proteins with two-state folding mechanisms. B: This plot includes only the 39 proteins from the table with no disulfide bonds.
More hydrophobic proteins have more compact denatured states
Auton et al.36 showed that urea m values could be predicted using the ΔGtr values from water to 1M urea measured for the backbone group and the side chains of proteins. In their original analysis, 36 proteins were included. We have analyzed the three proteins in Table I in the same way, and the combined results for these 39 proteins are shown in Figure 6. There is a good correlation between the measured and predicted m values: m (exp) = (0.96 ± 0.03) (m (calc)) with a 0.92 correlation coefficient. However, it is clear that some of the measured m values deviate substantially from the predicted values. To predict the m values, it is necessary to assume a model to calculate the ASA for the denatured state. The model assumed was the average of the upper and lower bound models suggested by Creamer et al.41 (These models will be discussed further below.) It seems likely that the predicted m values that deviate to the greatest extent do so because the proteins unfold to a greater or lesser extent than the model. Using the measured m values and those predicted for the upper and lower bounds,36 we can estimate the extent of unfolding for each of the 39 proteins. This approach shows that apomyoglobin (12% unfolded) is the least and staph nuclease (90% unfolded) the most unfolded proteins. This difference in extent of unfolding is striking and will be discussed further.
Figure 6.
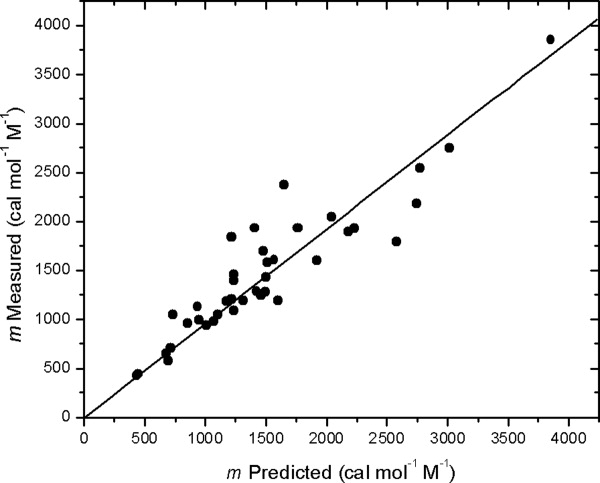
Experimental m values as a function of calculated m values for 39 proteins. The m values were calculated as described by Auton et al.36 Three of the m values are from Table I and the rest are from Ref. 36.
In Table IV at the top, we list five proteins that are on average 80% unfolded. We chose not to use a fragment (Nank 4–7, 71% unfolded) of the full-length notch ankyrin domain because it is partly unfolded under native state conditions. At the bottom, we list five proteins that are on average 34% unfolded. We chose not to use apomyoglobin (12% unfolded) because the native protein binds a heme group; cytochrome c (21% unfolded) because of the presence of the heme groups, and von Willebrand factor A3 domain (26% unfolded) and ribonuclease A (36% unfolded) because they both contain disulfide bonds. The ten proteins in Table IV are all monomeric proteins without disulfide bonds that closely approach a two-state folding mechanism. Their urea m values were measured at pH 7 ± 1.
Table IV.
Comparison of Properties of Least and Most Unfolded Proteins
| Protein | % Unfoldeda | # Residues | % Nonpolar residuesb | % Polar and charged residuesc | % Gly | % Pro | Net charge (pH 7)d | Net charge per residue |
|---|---|---|---|---|---|---|---|---|
| Staph Nuc | 90 | 149 | 36 | 53 | 7 | 4 | 10 | 0.07 |
| Barnase | 89 | 110 | 37 | 51 | 9 | 3 | 2 | 0.02 |
| LDKE | 82 | 93 | 40 | 53 | 7 | 1 | −6 | 0.07 |
| Calbindin | 71 | 75 | 33 | 55 | 7 | 5 | −7 | 0.09 |
| FKBP | 68 | 107 | 36 | 45 | 12 | 7 | 2 | 0.02 |
| Average | 80 | 107 | 37 | 51 | 8 | 4 | 0.05 | |
| DHFR | 37 | 159 | 43 | 44 | 6 | 6 | −8 | 0.05 |
| RNase H | 35 | 155 | 40 | 48 | 9 | 3 | 3 | 0.02 |
| NTRPL9 | 35 | 56 | 41 | 48 | 9 | 2 | 6 | 0.11 |
| Barstar | 32 | 89 | 44 | 48 | 6 | 2 | −6 | 0.07 |
| Che Y | 31 | 129 | 49 | 41 | 8 | 2 | −4 | 0.03 |
| Average | 34 | 118 | 43 | 46 | 8 | 3 | 0.06 |
% unfolded = [experimental m value − calculated m value (lower bound)]/[calculated m value (upper bound) − calculated m value (lower bound)], using the values for each protein given in Table SI-3 of the Supporting Information for Auton et al.36.
Ala, Val, Ile, Leu, Met, Cys, Phe, Tyr, and Trp.
Thr, Ser, Gln, Asn, Asp, Glu, His, Lys, and Arg.
Calculated as described in Table II.
Uversky et al.13 published one of the first papers that attempted to predict whether a protein would be “natively unfolded” under native state conditions. (For the remainder of the paper, we will refer to these as IDPs.) They showed that the key characteristics were a low overall hydrophobicity and a large net charge. For their sample of 91 IDPs, the mean hydrophobicity was 0.39 ± 0.05 and the mean charge per residue was 0.12 ± 0.09. For their sample of 250 folded proteins, the mean hydrophobicity was 0.48 ± 0.03 and the mean charge per residue was 0.04 ± 0.04. In the extensions of these prediction procedures,63 these have remained important parameters. They are also important in predictions of amyloid formation.64 We reasoned that these same two characteristics might be important in determining the extent of unfolding of proteins in urea.
In Table IV, we compare characteristics of the proteins that unfold to the smallest extent with those that unfold to the largest extent. The proteins range in size from 56 to 159 residues, and size does not appear to be an important factor. Similarly, Gly and Pro contents do not appear to be an important characteristic. None of the proteins that are the most unfolded have a net charge per residue as large as the average for the IDPs, and the averages for the two groups of proteins are very similar. Thus, the net charge per residue does not seem to be as important here as it does in the case of IDPs.13 (It is important at pH 3, as discussed below.) The two groups of proteins differ significantly in their content of nonpolar residues, and there is a corresponding change in their content of polar and charged residues. We will focus on the nonpolar residues. The average nonpolar residue content is 37% for the most unfolded and 43% for the least unfolded proteins. Two of the proteins stand out: Calbindin contains only 33% nonpolar residues and CheY contains 49% nonpolar residues (Table IV). These results encouraged us to examine the differences in hydrophobicity in more detail.
The results of Auton et al.36 show that when a protein unfolds, 75% of the change in accessible surface area, ΔASA, is due to the side chains and 25% is due to the backbone groups. However, the urea m values are dominated by the contribution of the backbone groups (See Fig. 4 in Auton et al.36). Cannon et al.35 reached a similar conclusion. So, to explain the results in Table IV, we need to know why peptide groups are much more accessible to urea in the most unfolded proteins than in the least unfolded proteins. The column giving the percent nonpolar residues from Table IV is shown as the second column in Table V. This is not the best measure of a protein's hydrophobicity because it does not take into account the differences in hydrophobicity among the amino acid side chains. Uversky et al.13 used the Kyte and Doolittle scale (K-D)73 to calculate the mean hydrophobicity of their sample of proteins. The K-D scale assigns each amino acid a hydrophobicity on a scale that ranges from −4.5 to +4.5. These values were normalized to a scale ranging from 0 to 1 and used to calculate the total and mean hydrophobicity of each protein. This calculation can be done with the program PONDR that is available at http://www.pondr.com.65 We used this program to calculate the mean hydrophobicity of each of the proteins in Table IV and the results are shown in the third column in Table V. The least unfolded proteins are 6% more hydrophobic that the most unfolded proteins, a difference that is considerable smaller than the difference based on just the nonpolar amino acid content (16% higher). If the nonpolar side chains are important in determining the interaction of backbone groups from urea, the K-D scale is probably not a good one to use. For example, it classes the Tyr and Trp side chains as hydrophilic, in contrast to most other scales. For this reason, we also calculated the mean side chain hydrophobicities using six hydrophobicity scales determined in different ways. The results are shown in Table V. For each of the six scales, the least unfolded proteins are substantially more hydrophobic than the most unfolded proteins. As the units on the various scales differ, we have calculated the % difference in mean hydrophobicity based on each scale and these are shown at the bottom of Table V. The % differences range from 10% to 17% with an average of 13%. Staph nuclease is the least hydrophobic protein on all of the scales and either CheY or barstar are the most hydrophobic.
Table V.
Estimating the Average Hydrophobicity of the Least and Most Unfolded Proteins Shown in Table IV
| Protein | % Nonpolar residuesa | PONDRb | Octanolc | Cyclohexaned | Rosemane | W-C-Wf | K-M-Hg | C-Wh |
|---|---|---|---|---|---|---|---|---|
| Staph Nuc | 36 | 0.40 | 0.57 | 1.07 | 0.47 | 0.74 | 5.76 | 0.40 |
| Barnase | 37 | 0.43 | 0.67 | 1.11 | 0.56 | 0.86 | 6.94 | 0.44 |
| LDKE | 40 | 0.45 | 0.74 | 1.34 | 0.58 | 0.91 | 7.17 | 0.51 |
| Caldbindin | 33 | 0.43 | 0.69 | 1.33 | 0.57 | 0.86 | 7.35 | 0.52 |
| FKBP | 36 | 0.45 | 0.67 | 1.21 | 0.53 | 0.83 | 6.69 | 0.47 |
| Average | 37.5 | 0.43 | 0.67 | 1.21 | 0.54 | 0.82 | 6.78 | 0.47 |
| DHFR | 43 | 0.47 | 0.80 | 1.41 | 0.60 | 0.98 | 7.85 | 0.54 |
| RNase H | 40 | 0.43 | 0.67 | 1.22 | 0.52 | 0.85 | 6.73 | 0.45 |
| NTRPL9 | 41 | 0.43 | 0.66 | 1.34 | 0.54 | 0.85 | 6.79 | 0.49 |
| Barstar | 44 | 0.47 | 0.85 | 1.51 | 0.65 | 1.02 | 8.33 | 0.58 |
| Che Y | 49 | 0.50 | 0.81 | 1.62 | 0.64 | 1.03 | 8.22 | 0.59 |
| Average | 43.4 | 0.46 | 0.76 | 1.42 | 0.59 | 0.94 | 7.58 | 0.53 |
| % Greater | 16 | 6 | 13 | 17 | 10 | 12 | 12 | 13 |
Ala, Val, Ile, Leu, Met, Cys, Phe, Tyr, and Trp. The side-chains of these residues were used to calculate the average hydrophobicity in the following columns.
Calculated using the program PONDR65 (http://www.pondr.com) as described in the text.
Calculated using ΔGtr values from n-octanol to water determined by Fauchere and Pliska66 and given in Pace.67
Calculated using ΔGtr values from cyclohexane to water determined by Radzika and Wolfenden68 and given in Pace.67
Calculated using the hydrophobicity coefficients given in column 5 (pH 7, no salt) of Table III as determined in Kovacs et al.71
Calculated using the ProtScale Tool (http://ca.expasy.org/tools/pscale) which is based on the hydrophobicity scale determined in Cowan and Whittaker.72
It is hard to envision how this 13% greater hydrophobicity can reduce the exposure of the backbone groups of a protein from 90% to 30%. However, it is now clear that “ ··· hydrophobic interactions remain strong even in 8M urea solution.”12 If the increased hydrophobicity of the side chains causes pockets of structure to form, they would have to remove 60% of the backbone groups from access to solvent to explain these results. This seems unlikely. This subject will be discussed further below.
The m values double at low pH because charge–charge repulsion leads to DSE expansion
We showed previously that the m values for RNase A, RNase T1, Barnase, and RNase Sa increase markedly when the pH is lowered from 7 to 3.42,43,46 This has also been observed with staph nuclease47 and other proteins.44,45,48,49 The original explanation was that electrostatic repulsion among the positive charges at low pH causes the molecules in the DSE to expand so that they are able to interact more extensively with urea. More recently, Whitten et al.51 suggested that the m value is low at pH 7 due to the presence of intermediate states and increases at lower pHs because the concentration of the intermediates decreases. To investigate this further, we prepared a series of variants of RNase Sa that differ in charged group content (Table II) and measured their m values at pH 3 and 7 (Table III). The pI, net charge, and estimated content of positive and negative charges on the proteins at pH 3 and 7 are shown in Table II. For all of these variants, the number of residues and the hydrophobic residue content is identical.
At pH 3, there is a steep increase in the m value as the net positive charge on the molecule increases (Fig. 7). The amino acid substitutions are all on the surface of RNase Sa, so it is not surprising that the folded CD spectra of the variants are similar and they all have RNase activity (data not shown). In addition, the structure of 5K has been determined and the results are presented in the Supporting Information. The structure (PDB ID code 3A5E) is very similar to RNase Sa (1RGG). Consequently, the folded conformations of the variants do not differ significantly from that of RNase Sa. The difference between the m values at pH 7 and 3 increases as the net charge goes up, and for 3K, 6K and 7K, the m value more than doubles. The equation describing the line shown on the figure is m = 0.082 (net charge) + 1.10 with a correlation coefficient of 0.96. It seems unlikely that this pH dependence would be observed if it resulted from a decrease in the concentration of a folding intermediate. It is more consistent with an expansion of the molecules in the denatured state ensemble as the positive charge on the molecules increases. This expansion of the DSE at low pH is supported by electrostatic effect calculations on the unfolded state of staph nuclease by Fitzkee and Garcia-Moreno.74
Figure 7.
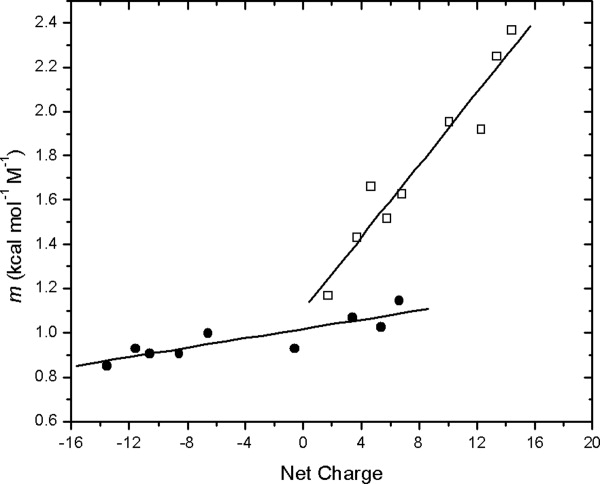
Experimental m values as a function of net charge for the charge variants of RNase Sa (Table II) at pH 7 (•) and pH 3 (□).
At pH 7, the dependence of the m value on net charge is much smaller (Fig. 7). The equation describing the results at pH 7 is m = 0.011 (net charge) + 1.02 with a correlation coefficient of 0.87. To aid in understanding these results, Table II shows the net charge and the contribution from positive and negative charges for each of the variants. For wild type RNase Sa (0K), for example, at pH 3 the net charge is 6.8 due to 1.2 (−) and 8.0 (+) charges, but at pH 7 it is −6.6 due to 13 (−) and 6.4 (+) charges. Despite the similarity in the net charges, the m value is much higher at pH 3 (1.6) than it is at pH 7 (0.95). This probably results, in part, because the number of charges is a more balanced at pH 7 and there are both favorable and repulsive electrostatic interactions among the charges at pH 7 and this makes the molecules in the DSE more compact. There is now considerable evidence showing that electrostatic interactions in the DSE can affect both the stability and kinetics of folding of proteins.75,76
Another observation is interesting. It is clear that an excess of positive charges on the molecules causes a much larger increase in the m value than an excess of negative charges. For example, 7K has a net charge of + 14.4 at pH 3 and the m value is 2.4, but 5REA has a net charge of −13.6 at pH 7 and the m value is 0.9 (Tables II and III). Consequently, in the DSE, there may be greater repulsion among positive charges than among an equivalent number of negative charges. We have also observed a difference in the effect of positive and negative charges on the solubility of RNase Sa. Adding negative charges to the protein surface always increases the solubility, but adding positive charges may either increase or decrease the solubility.77 This may have to do with the extent of hydration of charged groups on proteins. As Collins78 has pointed out: “ ··· the negative charges on proteins (carboxylates) are strongly hydrated, whereas the positive charges on proteins (derivatives of ammonium) are weakly hydrated.”
For three of the proteins, the m values were measured in the presence of 1M NaCl at pH 3 and 7, and the results are shown in Table VI. At pH 3, the m values are always lower at the higher salt concentration and the decrease depends on the net charge on the molecule. These results are consistent with the higher salt concentration reducing the electrostatic interactions among the positive charges at pH 3 so that the molecules in the DSE are more compact. At pH 7, the m values do not differ significantly with salt concentration, suggesting that both repulsive and attractive electrostatic interactions are present so the effect of higher salt concentration is smaller.
Table VI.
Effect of NaCl on the m values of RNase Sa (0K) and the 3K and 5K Charge Reversal Variants at pH 3 and pH 7
| pH 3 |
pH 7 |
|||||||
|---|---|---|---|---|---|---|---|---|
| Variant | Net chargea | m 0M NaCl (kcal mol−1M−1) | m 1M NaCl (kcal mol−1M−1) | % Δ | Net chargea | m 0M NaCl (kcal mol−1M−1) | m 1M NaCl (kcal mol−1M−1) | % Δ |
| 0K | 6.8 | 1.63 | 1.44 | ↓ 11.7 | −6.6 | 1.00 | 0.97 | ↓ 3.0 |
| 5K | 12.3 | 1.92 | 1.48 | ↓ 22.9 | 3.4 | 1.07 | 1.09 | ↓ 1.8 |
| 7K | 14.4 | 2.37 | 1.61 | ↓ 32.1 | 6.4 | 1.15 | 1.17 | ↓ 1.7 |
Calculated as described in Table II.
The results for urea and GdnHCl m values are quite different. For the same three proteins shown in Table VI, the GdnHCl m values decrease from an average value of 2.6 ± 0.1 kcal/mol/M at pH 7 to 2.3 ± 0.1 at pH 3 (Richard Thurlkill, unpublished results). The GdnHCl m values for RNase A were identical within error at pH 7 and 3, but for RNase T1, the GdnHCl m value is slightly higher at pH 3 than it is at pH 7.42 Thus, the pH dependence of the GdnHCl m values is quite different from that of the urea m values. Lim et al.79 have suggested that urea but not GdnHCl destabilizes proteins by hydrogen bonding to the peptide group. They suggest that “··· stacking rather than H-bonding is the most likely mode for guanidinium interaction with the peptide group.” This, plus the fact that GdnHCl is a salt, screening charge–charge interactions, may contribute to the differences observed.
All experimental m values can be accounted for using the approach of Auton et al.36
Auton et al.36 measured ΔGtr values from water to 1M urea for all of the amino acid side chains and the backbone units in a polypeptide chain. These data and an approach developed by Tanford23 were used to predict the m values shown in Figure 3. We will use the equations shown below and the data used previously36 to calculate m values.
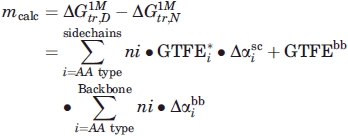 |
(2) |
where 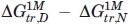 is the free energy difference between native (N) and denatured (D) protein when transferred from dilute buffer to 1M urea, GTFE*i is the corrected transfer free energy values for the side-chains, GTFEbb is the transfer free energy for the backbone groups, ni is the number of residues of type i in the protein, and
  and
and  are the side chain and backbone group average fractional change in solvent accessibility of residue i for the N→D reaction (SI Appendix of Ref. 36).
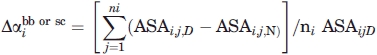 |
(3) |
where ASAi,j,N and ASAi,j,D are the native and denatured solvent accessible surface areas of residues in the native and denatured states calculated as described in Auton et al.36 In the denominator, we use the ASA for the side chains and backbone groups in the fully extended chain—the upper bound of Creamer et al.41—rather than the ASA based on Gly-X-Gly tripeptides used by Auton et al.36 The Gly-X-Gly model overestimates the exposure of the side chains in denatured proteins.41 In addition, we used ΔGtr = −43 cal/mol for the backbone group rather than the value of 39 cal/mol used by Auton et al.36 The more negative value is based on model peptides which should be a better model for an unfolded protein than the cyclic diglycine which was used to obtain the other value. We predicted m values for seven proteins using the lower and upper bounds described by Creamer et al.41 The results are shown in Table VII.
Table VII.
Comparing the Experimental and Calculated m Values (cal mol−1 M−1) for Seven Proteins
| Protein | Experimental m value pH 7 | Calculated m value (lower bound)a | Net charge per residue pH 7b | Experimental m value pH 3 | Calculated m value (upper bound)a | Net charge per residue pH 3b |
|---|---|---|---|---|---|---|
| Staph Nuc | 2380c | 900 | 0.07 | 4200d | 3510 | 0.21 |
| Barnase | 1940e | 1035 | 0.02 | 3015e | 2875 | 0.15 |
| 7K | 1150f | 510 | 0.07 | 2370f | 1910 | 0.15 |
| 5K | 1070f | 510 | 0.04 | 1920f | 1910 | 0.13 |
| 0K | 940g | 515 | −0.07 | 1630f | 1980 | 0.07 |
| Barstar | 1250h | 1145 | −0.07 | N/A | 2630 | 0.18 |
| Che Y | 1600i | 1520 | −0.03 | N/A | 3755 | 0.11 |
For their upper bound model, Creamer et al.41 calculated the ASA using an extended conformation of the protein with the backbone dihedral angles set to φ = −120° and Ψ = +120° and side chain torsion angles set to 180°. This is the same approach used by Spolar et al.,83 but Creamer et al.41 use the average of results from 43 proteins. When applied to individual proteins, the results are generally in reasonable agreement, but, for example, for staph nuclease, the ΔASA from Creamer et al.41 is 15% higher than the value from Hong et al.62 Unfolded proteins are not expected to be as unfolded as this upper bound model.
For their lower bound model, the average ASA values of 17 residue fragments from 43 proteins with the same conformation they have in folded proteins were used.41 The fragments retain the secondary structure they have in the folded proteins, but there will be no long-range interactions. Unfolded proteins are not expected to be as compact as this lower bound model.
Creamer et al.41 analyzed the accessible surface area (ASA) of five proteins with from 110 to 275 residues (See their Table II). For these proteins, the ASA is ∼30% greater for the upper bound model than for the lower bound model. (For comparison, the ASA of the Gly-X-Gly tripepetide model is ∼22% higher than the upper bound model.) The % difference in ASA between the upper and lower bounds is greater for the backbone groups than for the side chains. For staph nuclease, for example, the ASA for the upper bound model is 73% higher for the backbone groups, but only a 19% increase for the side chains. This is expected based on the model used for the lower bound where the native α-helices and β-turns will be retained, but longer-range tertiary interaction will not.
The m values for the two proteins that unfold to the smallest extent, barstar and CheY, are close to the m values calculated using the lower bound model; the experimental m values are only 5 and 9% higher (Table VII). This suggests that the proteins with the most compact denatured states approach the lower bound model of the DSE. For the two proteins than unfold to the greatest extent, barnase and staph nuclease, the measured m values are intermediate between the lower and upper bound models. This suggests that at pH 7 they contain substantial structure, but considerably less than barstar and CheY.
For the two proteins that unfold to the greatest extent, barnase and staph nuclease, and for 0K, 5K, and 7K, experimental m values have been measured at pH 3 where the m values are much higher than at pH 7 (Table VII). It is of interest to compare these m values with those predicted using the upper bound model. For barnase and 5K, the experimental m values are in reasonable agreement with the m values calculated using the upper bound model. For RNase Sa (0K), the calculated m value is greater than the experimental value. We think this result because the net charge per residue is much less for 0K than for barnase and 5K (Table VII). This suggests that barnase and 5K approach the upper bound model which has no structure, but that 0K, because of the lower net charge per residue, retains some structure at pH 3.
For staph nuclease, the measured urea m value increases from 2380 at pH 7, to 3100 at pH 4, to ∼4200 at pH 3.7.47 The m value cannot be measured at lower pHs because the native state is not stable and the value at pH 3.7 is less certain because only part of the urea denaturation curve can be measured. The urea m value at pH 3 for staph nuclease will clearly be much greater than the predicted m value of 3510 (Table VII).
There is no evidence in Figure 7 that the m values at pH 3 for the charge variants of RNase Sa are leveling off as the net charge on the molecules increases. The largest measured m value at pH 3 is 2370 for 7K (Table III), but the predicted value is only about 1910 (Table VII). (The structure of 7K has not been determined, but this variant should have a structure similar to RNase Sa and 5K and, consequently, a similar predicted m value. The structure of 5K is reported here. The details are given in the Supporting Information, and the pdb ID is 3A5E.) The fact that the m values predicted using the upper bound model are less than the measured m values at pH 3 for 7K and staph nuclease is puzzling. The upper bound model is a fully extended chain and should give the maximum possible m value for a given protein. There are only a few possibilities to account for this and they are discussed next.
The presence of intermediates would lower the m value so this need not be considered. Another possibility is the effect of an increase in the PPII content, as observed in the CD spectra. Urea promotes the formation of PPII,56 and we observe this with the RNase Sa charge variants. For 0K, 5K, and 7K, the content of PPII increases substantially when the urea concentration is raised from 3.5 to 8.5M [Fig. 4(B)]. The increase is greatest for 5K and 7K, which have the highest m values. This suggests that when the net charge per residue is high, the DSE contains more PPII than when it is lower. Since the net charge per residue is higher for staph nuclease than any of the other proteins, it may well have an even higher content of PPII. This is a possible explanation for why the m value calculated using the upper bound is less than the measured m value for staph nuclease. Related to this, the ΔGtr value for a peptide group might be higher if the peptides used for the measurements were in a PPII conformation. The ΔGtr values were determined in 1M urea and this might not be high enough to induce a PPII conformation in the peptides. A decrease from −43 kcal/mol to −50 kcal/mol would account for the measured m values of 7K and staph nuclease. Auton et al.36 point out that if the transfer free energies of the glycine peptides are corrected for the dipolar ion contribution, the value obtained is −56 cal/mol per backbone unit, and the Pettit group (personal communication) has computed a value of −54 cal/mol so a decrease to 50 cal/mol is a reasonable possibility.
In summary, for the two proteins that unfold to the smallest extent, barstar and CheY, the m values predicted by the lower bound model are in reasonable agreement with the measured m values. For the proteins that unfold to the greatest extent at pH 3, the m values predicted by the upper bound model can account for m values for 0K, 5K, and barnase, and only a moderate increase in the ΔGtr for the backbone group is needed to account for the m values for 7K and staph nuclease. This is encouraging. It suggests that the wide range of measured m values can be accounted for using the approach of Auton et al.36 and that some of the more complicated explanations that have been suggested may not be necessary.51
The DSE of proteins at pH 7 must contain substantial amounts of secondary structure
Studies by the Bolen and Record labs suggest that urea m values are determined mainly by the backbone groups of a protein that are exposed to solvent when the protein unfolds.35,36 Thus, the large difference between the least and most unfolded proteins in Table IV must result from differences in the extent of burial of backbone groups in the DSE. This suggests that the proteins that unfold to the smallest extent contain more structure that reduces their interactions with urea. This would most likely be α-helices, β-sheets, and β-turns. It has been shown that proteins with more compact DSEs contain more secondary structure.12,84 The results from the previous section suggest that for the least unfolded proteins the content of secondary structure in the DSE is not much less than observed in folded proteins. It seems unlikely that pockets of structure of the type observed in several proteins could account for these results, although in some cases they may play an important role.85–87 There is little evidence from the CD spectra for the presence of α-helices in the unfolded proteins (Fig. 4), perhaps because the helices form transiently in the DSE and will generally be shorter than the helices in folded proteins. However, there is abundant evidence from NMR studies that the denatured states of proteins contain native and nonnative α-helices and other structures that could inhibit the interactions with urea.11,88,89 Our results indicate that these structures occur to a greater extent in more nonpolar proteins.
For the proteins that unfold to the greatest extent, considerable structure must be present in the DSE at pH 7, but it is clearly less than the amount present in the proteins that unfold to a smaller extent. The results in the previous section suggest that for the proteins with the largest net charge per residue the structure is disrupted by repulsive charge–charge interactions at pH 3. So, the importance of net charge per residue seen in IDPs can also be seen in proteins denatured by urea.
Staph nuclease, an enigma?
Studies by Tanford's group in the 1960's led many of us to a too simple view of protein denatured states.90 This ended 20 years later when the Shortle lab began their studies of staph nuclease. In 1986, Shortle and Meeker80 observed large differences between the m values of staph nuclease mutants that differed only slightly in amino acid sequence and suggested: “One plausible explanation for these altered patterns of denaturation is that chain–chain or chain–solvent interactions in the denatured state have been modified—interactions which appear to involve hydrophobic groups.” In the 20 years that followed, the folding and DSE of staph nuclease were studied in more detail than for any other protein but, despite this, many questions remain.89,91–94 In 2003, Schellman concluded33: “Staphylococcal nuclease, as usual, is atypical in essentially all respects. The m values of this protein vary considerably as a result of single point mutation in sequence, indicating large differences in exposed surface area ···. This suggests a structure in the unfolded form that is more detailed and specific than the generic polymer effects normally associated with unfolded proteins.” For staph nuclease, there is good evidence that intermediates are present for some mutants under some conditions33,51,84 and that the DSE is more compact at low urea concentrations where the m value is measured and expands as the urea concentration increases.95 These two topics were not considered here, because they would be important in explaining low m values and m− mutants, but not the high m value observed with staph nuclease. Our results show that you can account for the exceptionally high m value observed for staph nuclease at low pH, and, as discussed above, the exceptionally low m values observed with other proteins using the approach of Auton et al.36 Nevertheless, Staph nuclease does seem exceptional and it is important that we gain an understanding of its interesting DSE under all conditions. We conclude by extending the thoughts of Shortle and Meeker. The most plausible explanation for the differences in the extent of unfolding of proteins in urea is that chain–chain and chain–solvent interactions in the denatured state differ and appear to involve hydrophobic groups.
Materials and Methods
All buffers and chemicals were of reagent grade. Urea was from Amresco or Nacalai Tesque (Kyoto, Japan) and GdmCl was from MP Biomedicals or ICN Biomedicals. Both were used without further purification. The plasmids for RNase Sa and the variants were derived from the pEH100 plasmid previously described.96 The plasmids for VHP and VlsE were derived from pET vectors (Novagen), and their constructions are described in detail in Fu.97 Expression hosts were either E. coli strains RY1988 (MQ), DS2000, or C41(DE3). Oligonucleotide primers for mutagenesis were from Integrated DNA Technologies (Coralville, IA). Site directed mutagenesis was performed with a QuikChange™ Site-Directed Mutagenesis Kit from Stratagene (La Jolla, CA). Mutant plasmids were sequenced by the Gene Technologies Lab, Texas A&M University, and the integrity of each gene was confirmed through the sequence.
RNase Sa, and the 3K and 5K variants were expressed and purified as described previously.98 For the 5K, 6K, and 7K variants, the host strains were grown for 6 h after induction before harvesting, and the postharvest supernatant was applied to a cation-exchange column equilibrated in 15 mM Tris, 3mM EDTA pH 7.8, then eluted with a 0–0.6M NaCl gradient. Size-exclusion chromatography was performed in 50 mM formic acid. For the 3REA and 5REA variants, an anion exchange column equilibrated in 50 mM sodium succinate pH 5.35 was used, and the proteins were eluted with a 0–1.0M NaCl gradient.
VHP was expressed and purified as described in Fu.97 VlsE was expressed according to the Studier auto-induction procedure.99 Briefly, C41 E. coli cells were transformed with the His-tag free VlsE294 vector (V3nL) onto LB agar plate with 50 μg/mL ampicillin. A single colony was picked the next day and grown to a saturated solution in 2 mL LB. This was then inoculated into 2 L of ZYM 5052 medium containing 50 μg/mL ampicillin, and grown over night at 30 °C. The cells were harvested and resuspended in TE buffer (15 mM Tris/3 mM EDTA/pH 7.4), then lysed using a French Press. NaOAc was added into the lysate to 50 mM and the pH was adjusted to 5 by adding concentrated HCl with stirring. This suspension was centrifuged at 10,000g for 20 min. The supernatant was loaded onto a Sephadex C-25 column equilibrated with NE buffer (50 mM NaOAc/2 mM EDTA/pH 5). Elution was with a 0–0.6M salt gradient in NE buffer after a 10 column volume wash. The fractions containing VlsE were pooled and diluted tenfold with PE buffer (20 mM phosphate/2 mM EDTA/pH11.3) before loading onto a 100 mL sepharose Q column equilibrated with PE buffer. The protein was then eluted by 0–0.7M salt gradient in PE buffer after 10 column volume wash. Fractions containing VlsE were pooled, desalted, freeze dried, and frozen in −20 °C freezer. The purity of all proteins was confirmed by SDS PAGE and MALDI-TOF mass spectrometry.
Urea denaturation curves were determined using either an AVIV 62DS or 202SF spectropolarimeter (Aviv Instruments, Lakewood, NJ) to follow unfolding. The method for RNase Sa and the variants has been described previously.52 For VHP, circular dichroism measurements were made at 222 nm at ≈7μM protein concentration. For VlsE, circular dichroism measurements were made at 220 nm at ≈1 μM protein concentration.100 The analysis of urea denaturation curves assumed a two-state unfolding model and was performed as described elsewhere.101
Acknowledgments
We thank Susan Marqusee and Kath Ratcliff for supplying the most recent urea m values for the RNases H. We also thank Doug Laurents, George Rose, Wayne Bolen, Matt Auton, Luis Holthauzen, Tom Record, and Ruth Saecker for help provided. However, none of them are likely to agree with all of the conclusions in this paper.
References
- 1.Rose GD. Unfolded proteins. Adv Prot Chem. 2002;62:1–398. [PubMed] [Google Scholar]
- 2.Mittag T, Forman-Kay JD. Atomic-level characterization of disordered protein ensembles. Curr Opin Struct Biol. 2007;17:3–14. doi: 10.1016/j.sbi.2007.01.009. [DOI] [PubMed] [Google Scholar]
- 3.Creamer TP, editor. Unfolded proteins: from denatured to intrinsically disordered. Hauppauge, NY: Nova Science Publishers; 2008. [Google Scholar]
- 4.Mohana-Borges R, Goto NK, Kroon GJ, Dyson HJ, Wright PE. Structural characterization of unfolded states of apomyoglobin using residual dipolar couplings. J Mol Biol. 2004;340:1131–1142. doi: 10.1016/j.jmb.2004.05.022. [DOI] [PubMed] [Google Scholar]
- 5.Bowler BE. Thermodynamic approaches to understanding protein denatured states. In: Creamer TP, editor. Unfolded proteins: from denatured to intrinsically disordered. Hauppauge, NY: Nova Science Publishers Inc.; 2008. pp. 23–50. [Google Scholar]
- 6.Tran HT, Mao A, Pappu RV. Role of backbone-solvent interactions in determining conformational equilibria of intrinsically disordered proteins. J Am Chem Soc. 2008;130:7380–7392. doi: 10.1021/ja710446s. [DOI] [PubMed] [Google Scholar]
- 7.Wang Y, Trewhella J, Goldenberg DP. Small-angle X-ray scattering of reduced ribonuclease A: effects of solution conditions and comparisons with a computational model of unfolded proteins. J Mol Biol. 2008;377:1576–1592. doi: 10.1016/j.jmb.2008.02.009. [DOI] [PMC free article] [PubMed] [Google Scholar]
- 8.Craig PO, Gomez GE, Ureta DB, Caramelo JJ, Delfino JM. Experimentally approaching the solvent-accessible surface area of a proteinsights into the acid molten globule of bovine alpha-lactalbumin. J Mol Biol. 2009;394:982–993. doi: 10.1016/j.jmb.2009.09.058. [DOI] [PubMed] [Google Scholar]
- 9.O'Brien EP, Brooks BR, Thirumalai D. Molecular origin of constant m-values, denatured state collapse, and residue-dependent transition midpoints in globular proteins. Biochemistry. 2009;48:3743–3754. doi: 10.1021/bi8021119. [DOI] [PMC free article] [PubMed] [Google Scholar]
- 10.Rao KS, Tzul FO, Christian AK, Gordon TN, Bowler BE. Thermodynamics of loop formation in the denatured state of rhodopseudomonas palustris cytochrome c': scaling exponents and the reconciliation problem. J Mol Biol. 2009;392:1315–1325. doi: 10.1016/j.jmb.2009.07.074. [DOI] [PMC free article] [PubMed] [Google Scholar]
- 11.Shan B, Eliezer D, Raleigh DP. The unfolded state of the C-terminal domain of the ribosomal protein L9 contains both native and non-native structure. Biochemistry. 2009;48:4707–4719. doi: 10.1021/bi802299j. [DOI] [PMC free article] [PubMed] [Google Scholar]
- 12.Holthauzen LM, Rosgen J, Bolen DW. Hydrogen bonding progressively strengthens upon transfer of the protein urea-denatured state to water and protecting osmolytes. Biochemistry. 2010;49:1310–1318. doi: 10.1021/bi9015499. [DOI] [PMC free article] [PubMed] [Google Scholar]
- 13.Uversky VN, Gillespie JR, Fink AL. Why are “natively unfolded” proteins unstructured under physiologic conditions? Proteins. 2000;41:415–427. doi: 10.1002/1097-0134(20001115)41:3<415::aid-prot130>3.0.co;2-7. [DOI] [PubMed] [Google Scholar]
- 14.Dyson HJ, Wright PE. Intrinsically unstructured proteins and their functions. Nat Rev Mol Cell Biol. 2005;6:197–208. doi: 10.1038/nrm1589. [DOI] [PubMed] [Google Scholar]
- 15.Uversky VN, Dunker AK. Biochemistry. Controlled chaos. Science. 2008;322:1340–1341. doi: 10.1126/science.1167453. [DOI] [PubMed] [Google Scholar]
- 16.Oldfield CJ, Cheng Y, Cortese MS, Brown CJ, Uversky VN, Dunker AK. Comparing and combining predictors of mostly disordered proteins. Biochemistry. 2005;44:1989–2000. doi: 10.1021/bi047993o. [DOI] [PubMed] [Google Scholar]
- 17.Hopkins FG. Denaturation of proteins by urea and related substances. Nature. 1930;126:328–330. [Google Scholar]
- 18.Greene RF, Jr, Pace CN. Urea and guanidine hydrochloride denaturation of ribonuclease, lysozyme, alpha-chymotrypsin, and beta-lactoglobulin. J Biol Chem. 1974;249:5388–5393. [PubMed] [Google Scholar]
- 19.Pace CN. Determination and analysis of urea and guanidine hydrochloride denaturation curves. Methods Enzmyol. 1986;131:266–280. doi: 10.1016/0076-6879(86)31045-0. [DOI] [PubMed] [Google Scholar]
- 20.Scholtz JM, Grimsley GR, Pace CN. Solvent denaturation of proteins and interpretations of the m value. Methods Enzymol. 2009;466:549–565. doi: 10.1016/S0076-6879(09)66023-7. [DOI] [PubMed] [Google Scholar]
- 21.Pace CN, Grimsley GR, Thomas ST, Makhatadze GI. Heat capacity change for ribonuclease A folding. Protein Sci. 1999;8:1500–1504. doi: 10.1110/ps.8.7.1500. [DOI] [PMC free article] [PubMed] [Google Scholar]
- 22.Pace CN, Shaw KL. Linear extrapolation method of analyzing solvent denaturation curves. Proteins. 2000;4:1–7. doi: 10.1002/1097-0134(2000)41:4+<1::aid-prot10>3.3.co;2-u. [DOI] [PubMed] [Google Scholar]
- 23.Tanford C. Isothermal unfolding of globular proteins in aqueous urea solutions. J Am Chem Soc. 1964;86:2050–2059. [Google Scholar]
- 24.Lee B, Richards FM. The interpretation of protein structures: estimation of static accessibility. J Mol Biol. 1971;55:379–400. doi: 10.1016/0022-2836(71)90324-x. [DOI] [PubMed] [Google Scholar]
- 25.Shortle D. Staphylococcal nuclease: a showcase of m-value effects. Adv Protein Chem. 1995;46:217–247. doi: 10.1016/s0065-3233(08)60336-8. [DOI] [PubMed] [Google Scholar]
- 26.Perry KM, Onuffer JJ, Gittelman MS, Barmat L, Matthews CR. Long-range electrostatic interactions can influence the folding, stability, and cooperativity of dihydrofolate reductase. Biochemistry. 1989;28:7961–7968. doi: 10.1021/bi00445a061. [DOI] [PubMed] [Google Scholar]
- 27.Akke M, Forsen S. Protein stability and electrostatic interactions between solvent exposed charged side chains. Proteins. 1990;8:23–29. doi: 10.1002/prot.340080106. [DOI] [PubMed] [Google Scholar]
- 28.Ahrweiler PM, Frieden C. Effects of point mutations in a hinge region on the stability, folding, and enzymatic activity of Escherichia coli dihydrofolate reductase. Biochemistry. 1991;30:7801–7809. doi: 10.1021/bi00245a020. [DOI] [PubMed] [Google Scholar]
- 29.Sandberg W, Terwilliger TC. Energetics of repacking a protein interior. Proc Natl Acad Sci USA. 1991;88:1706–1710. doi: 10.1073/pnas.88.5.1706. [DOI] [PMC free article] [PubMed] [Google Scholar]
- 30.Bowler BE, May K, Zaragoza T, York P, Dong A, Caughey WS. Destabilizing effects of replacing a surface lysine of cytochrome c with aromatc amino acids: implications for the denatured state. Biochemistry. 1993;32:183–190. doi: 10.1021/bi00052a024. [DOI] [PubMed] [Google Scholar]
- 31.Giletto A, Pace CN. Buried, charged, non-ion-paired aspartic acid 76 contributes favorably to the conformational stability of ribonuclease T1. Biochemistry. 1999;38:13379–13384. doi: 10.1021/bi991422s. [DOI] [PubMed] [Google Scholar]
- 32.Myers JK, Pace CN, Scholtz JM. Denaturant m values and heat capacity changes: relation to changes in accessible surface areas of protein unfolding. Protein Sci. 1995;4:2138–2148. doi: 10.1002/pro.5560041020. [DOI] [PMC free article] [PubMed] [Google Scholar]
- 33.Schellman JA. Protein stability in mixed solvents: a balance of contact interaction and excluded volume. Biophys J. 2003;85:108–125. doi: 10.1016/S0006-3495(03)74459-2. [DOI] [PMC free article] [PubMed] [Google Scholar]
- 34.Timasheff SN. Control of protein stability and reactions by weakly interacting cosolvents: the simplicity of the complicated. Adv Protein Chem. 1998;51:355–432. doi: 10.1016/s0065-3233(08)60656-7. [DOI] [PubMed] [Google Scholar]
- 35.Cannon JG, Anderson CF, Record MT., Jr. Urea-amide preferential interactions in water: quantitative comparison of model compound data with biopolymer results using water accessible surface areas. J Phys Chem B. 2007;111:9675–9685. doi: 10.1021/jp072037c. [DOI] [PubMed] [Google Scholar]
- 36.Auton M, Holthauzen LM, Bolen DW. Anatomy of energetic changes accompanying urea-induced protein denaturation. Proc Natl Acad Sci USA. 2007;104:15317–15322. doi: 10.1073/pnas.0706251104. [DOI] [PMC free article] [PubMed] [Google Scholar]
- 37.Nozaki Y, Tanford C. The solubility of amino acids and related compounds in aqueous urea solutions. J Biol Chem. 1963;238:4074–4081. [PubMed] [Google Scholar]
- 38.Robinson DR, Jencks WP. The effect of compounds of the urea-guanidinium class on the activity coefficient of acetyltetraglycine ethyl ester and related compounds. J Am Chem Soc. 1965;87:2462–2470. doi: 10.1021/ja01089a028. [DOI] [PubMed] [Google Scholar]
- 39.Nandi PK, Robinson DR. Effects of urea and guanidine hydrochloride on peptide and nonpolar groups. Biochemistry. 1984;23:6661–6668. doi: 10.1021/bi00321a058. [DOI] [PubMed] [Google Scholar]
- 40.Auton M, Bolen DW. Additive transfer free energies of the peptide backbone unit that are independent of the model compound and the choice of concentration scale. Biochemistry. 2004;43:1329–1342. doi: 10.1021/bi035908r. [DOI] [PubMed] [Google Scholar]
- 41.Creamer TP, Srinivasan R, Rose GD. Modeling unfolded states of proteins and peptides. II. Backbone solvent accessibility. Biochemistry. 1997;36:2832–2835. doi: 10.1021/bi962819o. [DOI] [PubMed] [Google Scholar]
- 42.Pace CN, Laurents DV, Thomson JA. pH dependence of the urea and guanidine hydrochloride denaturation of ribonuclease A and ribonuclease T1. Biochemistry. 1990;29:2564–2572. doi: 10.1021/bi00462a019. [DOI] [PubMed] [Google Scholar]
- 43.Pace CN, Laurents DV, Erickson RE. Urea denaturation of barnase: pH dependence and characterization of the unfolded state. Biochemistry. 1992;31:2728–2734. doi: 10.1021/bi00125a013. [DOI] [PubMed] [Google Scholar]
- 44.Chiti F, van Nuland NA, Taddei N, Magherini F, Stefani M, Ramponi G, Dobson CM. Conformational stability of muscle acylphosphatase: the role of temperature, denaturant concentration, and pH. Biochemistry. 1998;37:1447–1455. doi: 10.1021/bi971692f. [DOI] [PubMed] [Google Scholar]
- 45.Taddei N, Chiti F, Paoli P, Fiaschi T, Bucciantini M, Stefani M, Dobson CM, Ramponi G. Thermodynamics and kinetics of folding of common-type acylphosphatase: comparison to the highly homologous muscle isoenzyme. Biochemistry. 1999;38:2135–2142. doi: 10.1021/bi9822630. [DOI] [PubMed] [Google Scholar]
- 46.Pace CN, Alston RW, Shaw KL. Charge-charge interactions influence the denatured state ensemble and contribute to protein stability. Protein Sci. 2000;9:1395–1398. doi: 10.1110/ps.9.7.1395. [DOI] [PMC free article] [PubMed] [Google Scholar]
- 47.Whitten ST, Garcia-Moreno BE. pH dependence of stability of Staphylococcal nuclease: evidence of substantial electrostatic interactions in the denatured state. Biochemistry. 2000;39:14292–14304. doi: 10.1021/bi001015c. [DOI] [PubMed] [Google Scholar]
- 48.Liu C, Chu D, Wideman RD, Houliston RS, Wong HJ, Meiering EM. Thermodynamics of denaturation of hisactophilin, a beta-trefoil protein. Biochemistry. 2001;40:3817–3827. doi: 10.1021/bi002609i. [DOI] [PubMed] [Google Scholar]
- 49.Li Y, Horng JC, Raleigh DP. pH dependent thermodynamic and amide exchange studies of the C-terminal domain of the ribosomal protein L9: implications for unfolded state structure. Biochemistry. 2006;45:8499–8506. doi: 10.1021/bi052534o. [DOI] [PubMed] [Google Scholar]
- 50.DeKoster GT, Robertson AD. Calorimetrically-derived parameters for protein interactions with urea and guanidine-HCl are not consistent with denaturant m values. Biophys Chem. 1997;64:59–68. doi: 10.1016/s0301-4622(96)02219-3. [DOI] [PubMed] [Google Scholar]
- 51.Whitten ST, Wooll JO, Razeghifard R, Garcia-Moreno EB, Hilser VJ. The origin of pH-dependent changes in m-values for the denaturant-induced unfolding of proteins. J Mol Biol. 2001;309:1165–1175. doi: 10.1006/jmbi.2001.4726. [DOI] [PubMed] [Google Scholar]
- 52.Pace CN, Hebert EJ, Shaw KL, Schell D, Both V, Krajcikova D, Sevcik J, Wilson KS, Dauter Z, Hartley RW, Grimsley GR. Conformational stability and thermodynamics of folding of ribonucleases Sa, Sa2 and Sa3. J Mol Biol. 1998;279:271–286. doi: 10.1006/jmbi.1998.1760. [DOI] [PubMed] [Google Scholar]
- 53.Grimsley GR, Scholtz JM, Pace CN. A summary of the measured pK values of the ionizable groups in folded proteins. Protein Sci. 2008;18:247–251. doi: 10.1002/pro.19. [DOI] [PMC free article] [PubMed] [Google Scholar]
- 54.Alston RW, Urbanikova L, Sevcik J, Lasagna M, Reinhart GD, Scholtz JM, Pace CN. Contribution of single tryptophan residues to the fluorescence and stability of ribonuclease Sa. Biophys J. 2004;87:4036–4047. doi: 10.1529/biophysj.104.050377. [DOI] [PMC free article] [PubMed] [Google Scholar]
- 55.Privalov PL, Tiktopulo EI, Venyaminov S, Griko Yu V, Makhatadze GI, Khechinashvili NN. Heat capacity and conformation of proteins in the denatured state. J Mol Biol. 1989;205:737–750. doi: 10.1016/0022-2836(89)90318-5. [DOI] [PubMed] [Google Scholar]
- 56.Whittington SJ, Chellgren BW, Hermann VM, Creamer TP. Urea promotes polyproline II helix formation: implications for protein denatured states. Biochemistry. 2005;44:6269–6275. doi: 10.1021/bi050124u. [DOI] [PubMed] [Google Scholar]
- 57.Shi Z, Chen K, Liu Z, Kallenbach NR. Conformation of the backbone in unfolded proteins. Chem Rev. 2006;106:1877–1897. doi: 10.1021/cr040433a. [DOI] [PubMed] [Google Scholar]
- 58.Eicken C, Sharma V, Klabunde T, Lawrenz MB, Hardham JM, Norris SJ, Sacchettini JC. Crystal structure of Lyme disease variable surface antigen VlsE of Borrelia burgdorferi. J Biol Chem. 2002;277:21691–21696. doi: 10.1074/jbc.M201547200. [DOI] [PubMed] [Google Scholar]
- 59.Raschke TM, Kho J, Marqusee S. Confirmation of the hierarchical folding of RNase H: a protein engineering study. Nat Struct Biol. 1999;6:825–831. doi: 10.1038/12277. [DOI] [PubMed] [Google Scholar]
- 60.Hollien J, Marqusee S. Comparison of the folding processes of T. thermophilus and E. coli ribonucleases H. J Mol Biol. 2002;316:327–340. doi: 10.1006/jmbi.2001.5346. [DOI] [PubMed] [Google Scholar]
- 61.Ratcliff K, Corn J, Marqusee S. Structure, stability, and folding of ribonuclease H1 from the moderately thermophilic Chlorobium tepidum: comparison with thermophilic and mesophilic homologues. Biochemistry. 2009;48:5890–5898. doi: 10.1021/bi900305p. [DOI] [PMC free article] [PubMed] [Google Scholar]
- 62.Hong J, Capp MW, Saecker RM, Record MT., Jr Use of urea and glycine betaine to quantify coupled folding and probe the burial of DNA phosphates in lac repressor-lac operator binding. Biochemistry. 2005;44:16896–16911. doi: 10.1021/bi0515218. [DOI] [PMC free article] [PubMed] [Google Scholar]
- 63.Dunker AK, Oldfield CJ, Meng J, Romero P, Yang JY, Chen JW, Vacic V, Obradovic Z, Uversky VN. The unfoldomics decade: an update on intrinsically disordered proteins. BMC Genomics. 2008;9:S1. doi: 10.1186/1471-2164-9-S2-S1. [DOI] [PMC free article] [PubMed] [Google Scholar]
- 64.Pawar AP, Dubay KF, Zurdo J, Chiti F, Vendruscolo M, Dobson CM. Prediction of “aggregation-prone” and “aggregation-susceptible” regions in proteins associated with neurodegenerative diseases. J Mol Biol. 2005;350:379–392. doi: 10.1016/j.jmb.2005.04.016. [DOI] [PubMed] [Google Scholar]
- 65.Romero P, Obradovic Z, Li X, Garner EC, Brown CJ, Dunker AK. Sequence complexity of disordered protein. Proteins. 2001;42:38–48. doi: 10.1002/1097-0134(20010101)42:1<38::aid-prot50>3.0.co;2-3. [DOI] [PubMed] [Google Scholar]
- 66.Fauchere JL, Pliska V. Hydrophobic parameters p of amino acid side chains from the partitioning of N-acetyl-amino acid amides. Eur J Med Chem. 1983;18:369–375. [Google Scholar]
- 67.Pace CN. Evaluating contribution of hydrogen bonding and hydrophobic bonding to protein folding. Methods Enzymol. 1995;259:538–554. doi: 10.1016/0076-6879(95)59060-9. [DOI] [PubMed] [Google Scholar]
- 68.Radzicka A, Wolfenden R. Comparing the polarities of the amino acids: side-chain distribution coefficients between the vapor phase, cyclohexane, 1-octanol, and neutral aqueous solution. Biochemistry. 1988;27:1644–1670. [Google Scholar]
- 69.Roseman MA. Hydrophobicity of the peptide C=O···H-N hydrogen-bonded group. J Mol Biol. 1988;201:621–623. doi: 10.1016/0022-2836(88)90642-0. [DOI] [PubMed] [Google Scholar]
- 70.Wimley WC, Creamer TP, White SH. Solvation energies of amino acids sidechains and backbone in a family of host-guest pentapeptides. Biochemistry. 1996;35:5109–5124. doi: 10.1021/bi9600153. [DOI] [PubMed] [Google Scholar]
- 71.Kovacs JM, Mant CT, Hodges RS. Determination of intrinsic hydrophilicity/hydrophobicity of amino acid side chains in peptides in the absence of nearest-neighbor or conformational effects. Biopolymers. 2006;84:283–297. doi: 10.1002/bip.20417. [DOI] [PMC free article] [PubMed] [Google Scholar]
- 72.Cowan R, Whittaker RG. Hydrophobicity indices for amino acid residues as determined by high-performance liquid chromatography. Pept Res. 1990;3:75–80. [PubMed] [Google Scholar]
- 73.Kyte J, Doolittle RF. A simple method for displaying the hydropathic character of a protein. J Mol Biol. 1982;157:105–132. doi: 10.1016/0022-2836(82)90515-0. [DOI] [PubMed] [Google Scholar]
- 74.Fitzkee NC, Garcia-Moreno EB. Electrostatic effects in unfolded staphylococcal nuclease. Protein Sci. 2008;17:216–227. doi: 10.1110/ps.073081708. [DOI] [PMC free article] [PubMed] [Google Scholar]
- 75.Trefethen JM, Pace CN, Scholtz JM, Brems DN. Charge-charge interactions in the denatured state influence the folding kinetics of ribonuclease Sa. Protein Sci. 2005;14:1934–1938. doi: 10.1110/ps.051401905. [DOI] [PMC free article] [PubMed] [Google Scholar]
- 76.Cho JH, Raleigh DP. Electrostatic interactions in the denatured state and in the transition state for protein folding: effects of denatured state interactions on the analysis of transition state structure. J Mol Biol. 2006;359:1437–1446. doi: 10.1016/j.jmb.2006.04.038. [DOI] [PubMed] [Google Scholar]
- 77.Trevino SR, Scholtz JM, Pace CN. Amino acid contribution to protein solubility: Asp, Glu, and Ser contribute more favorably than the other hydrophilic amino acids in RNase Sa. J Mol Biol. 2007;366:449–460. doi: 10.1016/j.jmb.2006.10.026. [DOI] [PMC free article] [PubMed] [Google Scholar]
- 78.Collins KD. Ions from the Hofmeister series and osmolytes: effects on proteins in solution and in the crystallization process. Methods. 2004;34:300–311. doi: 10.1016/j.ymeth.2004.03.021. [DOI] [PubMed] [Google Scholar]
- 79.Lim WK, Rosgen J, Englander SW. Urea, but not guanidinium, destabilizes proteins by forming hydrogen bonds to the peptide group. Proc Natl Acad Sci USA. 2009;106:2595–2600. doi: 10.1073/pnas.0812588106. [DOI] [PMC free article] [PubMed] [Google Scholar]
- 80.Shortle D, Meeker AK. Mutant forms of staphylococcal nuclease with altered patterns of guanidine hydrochloride and urea denaturation. Proteins. 1986;1:81–89. doi: 10.1002/prot.340010113. [DOI] [PubMed] [Google Scholar]
- 81.Khurana R, Hate AT, Nath U, Udgaonkar JB. pH dependence of the stability of barstar to chemical and thermal denaturation. Protein Sci. 1995;4:1133–1144. doi: 10.1002/pro.5560040612. [DOI] [PMC free article] [PubMed] [Google Scholar]
- 82.Filimonov VV, Preito J, Martinez JC, Bruix M, Mateo PL, Serrano L. Thermodynamic analysis of the chemotactic protein from Escherichia coli. Biochemistry. 1993;32:12906–12921. doi: 10.1021/bi00210a045. [DOI] [PubMed] [Google Scholar]
- 83.Spolar RS, Livingstone JR, Record MT., Jr Use of liquid hydrocarbon and amide transfer data to estimate contributions to thermodynamic functions of protein folding from the removal of nonpolar and polar surface from water. Biochemistry. 1992;31:3947–3955. doi: 10.1021/bi00131a009. [DOI] [PubMed] [Google Scholar]
- 84.Uversky VN, Fink AL. The chicken-egg scenario of protein folding revisited. FEBS Lett. 2002;515:79–83. doi: 10.1016/s0014-5793(02)02441-9. [DOI] [PubMed] [Google Scholar]
- 85.Neri D, Billeter M, Gerhard W, Wuthrich K. NMR determination of residual structure in a urea-denatured protein, the 434-repressor. Science. 1992;257:1559–1563. doi: 10.1126/science.1523410. [DOI] [PubMed] [Google Scholar]
- 86.Klein-Seetharaman J, Oikawa M, Grimshaw SB, Wirmer J, Duchardt E, Ueda T, Imoto T, Smith LJ, Dobson CM, Schwalbe H. Long-range interactions within a nonnative protein. Science. 2002;295:1719–1722. doi: 10.1126/science.1067680. [DOI] [PubMed] [Google Scholar]
- 87.Marsh JA, Neale C, Jack FE, Choy WY, Lee AY, Crowhurst KA, Forman-Kay JD. Improved structural characterizations of the drkN SH3 domain unfolded state suggest a compact ensemble with native-like and non-native structure. J Mol Biol. 2007;367:1494–1510. doi: 10.1016/j.jmb.2007.01.038. [DOI] [PubMed] [Google Scholar]
- 88.Yao J, Chung J, Eliezer D, Wright PE, Dyson HJ. NMR structural and dynamic characterization of the acid-unfolded state of apomyoglobin provides insights into the early events in protein folding. Biochemistry. 2001;40:3561–3571. doi: 10.1021/bi002776i. [DOI] [PubMed] [Google Scholar]
- 89.Francis CJ, Lindorff-Larsen K, Best RB, Vendruscolo M. Characterization of the residual structure in the unfolded state of the Delta131Delta fragment of staphylococcal nuclease. Proteins. 2006;65:145–152. doi: 10.1002/prot.21077. [DOI] [PubMed] [Google Scholar]
- 90.Tanford C. Protein denaturation. Adv Protein Chem. 1968;23:121–282. doi: 10.1016/s0065-3233(08)60401-5. [DOI] [PubMed] [Google Scholar]
- 91.Flanagan JM, Kataoka M, Fujisawa T, Engelman DM. Mutations can cause large changes in the conformation of a denatured protein. Biochemistry. 1993;32:10359–10370. doi: 10.1021/bi00090a011. [DOI] [PubMed] [Google Scholar]
- 92.Carra JH, Privalov PL. Thermodynamics of denaturation of staphylococcal nuclease mutants: an intermediate state in protein folding. FASEB J. 1996;10:67–74. doi: 10.1096/fasebj.10.1.8566550. [DOI] [PubMed] [Google Scholar]
- 93.Ackerman MS, Shortle D. Robustness of the long-range structure in denatured staphylococcal nuclease to changes in amino acid sequence. Biochemistry. 2002;41:13791–13797. doi: 10.1021/bi020511t. [DOI] [PubMed] [Google Scholar]
- 94.Shortle D. The expanded denatured state: an ensemble of conformations trapped in a locally encoded topological space. Adv Protein Chem. 2002;62:1–23. doi: 10.1016/s0065-3233(02)62003-0. [DOI] [PubMed] [Google Scholar]
- 95.Baskakov IV, Bolen DW. Monitoring the sizes of denatured ensembles of staphylococcal nuclease proteins: implications regarding m values, intermediates, and thermodynamics. Biochemistry. 1998;37:18010–18017. doi: 10.1021/bi981849j. [DOI] [PubMed] [Google Scholar]
- 96.Hebert EJ, Grimsley GR, Hartley RW, Horn G, Schell D, Garcia S, Both V, Sevcik J, Pace CN. Purification of ribonucleases Sa, Sa2, and Sa3 after expression in Escherichia coli. Protein Expr Purif. 1997;11:162–168. doi: 10.1006/prep.1997.0776. [DOI] [PubMed] [Google Scholar]
- 97.Fu H. 2009. p. 163. Understanding forces that contribute to protein stability: application for increasing protein stability, Ph.D. Dissertation. College Station: Texas A&M University. [Google Scholar]
- 98.Shaw KL, Grimsley GR, Yakovlev GI, Makarov AA, Pace CN. The effect of net charge on the solubility, activity, and stability of ribonuclease Sa. Protein Sci. 2001;10:1206–1215. doi: 10.1110/ps.440101. [DOI] [PMC free article] [PubMed] [Google Scholar]
- 99.Studier FW. Protein production by auto-induction in high density shaking cultures. Protein Expr Purif. 2005;41:207–234. doi: 10.1016/j.pep.2005.01.016. [DOI] [PubMed] [Google Scholar]
- 100.Jones K, Wittung-Stafshede P. The largest protein observed to fold by two-state kinetic mechanism does not obey contact-order correlation. J Am Chem Soc. 2003;125:9606–9607. doi: 10.1021/ja0358807. [DOI] [PubMed] [Google Scholar]
- 101.Pace C, Grimsley GR. Denaturation of proteins by urea and guanidine hydrochloride. In: Buchner JAK, Scholtz JM, editors. Protein folding handbook. Hamburg: Wiley-VCH Verlag GmbH & Co. KGaA; 2005. pp. 45–69. [Google Scholar]