Abstract
The binding states of the substrates and the environment have significant influence on protein motion. We present the analysis of such motion derived from anisotropic atomic displacement parameters (ADPs) in a set of atomic resolution protein structures. Local structural motion caused by ligand binding as well as functional loops showing cooperative patterns of motion could be inferred. The results are in line with proposed protonation states, hydrogen bonding patterns and the location of distinctly flexible regions: we could locate the mobile active site loop in a virus integrase, distinguish the subdomains in RNAse A and hydroxynitrile lyase, and reconstruct the molecular architecture in a xylanase. We demonstrate that the ADP-based motion analysis provides information at high level of detail and that the structural changes needed for substrate attachment or release may be derived from single X-ray structures.
Keywords: atomic resolution, atomic displacement parameters, molecular motion, catalysis, functional unit
Synopsis: This article presents the investigation of internal motion in a series of protein crystal structures. The study revealed internal flexibility of functional units in the macromolecules. The study also demonstrated that, for example the structural changes needed for substrate attachment or release may be derived from single X-ray structures.
Introduction
Molecular motion is a prerequisite for enzymatic catalysis. Substrates and cofactors need to be admitted and reaction products released. Often conformational changes are needed to stabilize charges or accommodate the changing stereochemistry of the substrate during the reaction. These changes may be subtle and at the atomic level, such as the rotation of a single side chain, but can also be of large scale, for example the rearrangement of a whole domain. Most often, it is a combination of both.1
Conformational adaptations play an important role in the energy balance of an enzymatic reaction, and the knowledge of them may help unravelling the driving forces of catalysis, mechanisms of substrate recognition and the influence of allostery. For example, Lee and Craik2 showed that the use of allosteric inhibitors resulted in a loss of substrate binding and deactivation of the enzymes just as if the inhibitors had been bound directly to the active site, suggesting the molecules to be locked in an unfavourable conformation. Indeed, certain regions in macromolecules specifically change their patterns of motion depending on the environment or the nature of binding ligands. Identifying these regions and pinpointing the changes from structure analysis may reveal conserved functional fragments in addition to the sequence and structure conservation. The analysis of molecular motion derived from the crystal structures has also become of increasing interest for drug design, where binding sites and their possible adaptations during catalysis could be modelled.3
Crystallographic analysis of macromolecular structures captures their picture in form of an accurate 3D model. At sufficiently high resolution fine structural and even electronic details can be directly observed.4,5 The role of the constraints imposed by a crystal lattice is often overestimated. In the crystal a macromolecule still retains an echo of the flexibility that it exhibits in solution.6 This flexibility is reflected in the atomic displacement parameters (ADPs) obtained during structure determination.7 If ADPs are refined anisotropically, they allow deciphering not only the amplitudes of atomic motion, but also their directionality.8
A protein crystal structure is typically determined to a resolution of about 2 Å, where the data-to-parameter ratio does not allow the direct refinement of anisotropic ADPs. For these structures approaches requiring smaller number of parameters, for example translation, libration, and screw (TLS) analysis, can help dissect protein models into fragments having concerted motion.9–11 If the resolution of the crystallographic data is high enough, the individual anisotropic ADPs can be used to reliably describe directional motion and possible conformational changes, on the level of individual atoms.12
Here, we describe an approach for the analysis of concerted directional motion in a set of atomic resolution protein crystal structures and discuss the effects of ligand binding, environmental conditions (pH) and the implications for the structure-function relationship.
Results
We used a set of 140 protein structures of various sizes, protein families, enzyme classes, crystal forms, which were obtained from the use of different refinement programs and structure determination strategies. We determined regions exhibiting concerted motion, which we call “functional units.” A functional unit could sometimes be as small as a single residue, a structural element (helix or strand), but could also comprise an entire domain. Five proteins from this set were structures in different complexes or chemical environment, and these, plus one additional case were used for a closer investigation of ligand binding effects (Fig. 1).
Figure 1.
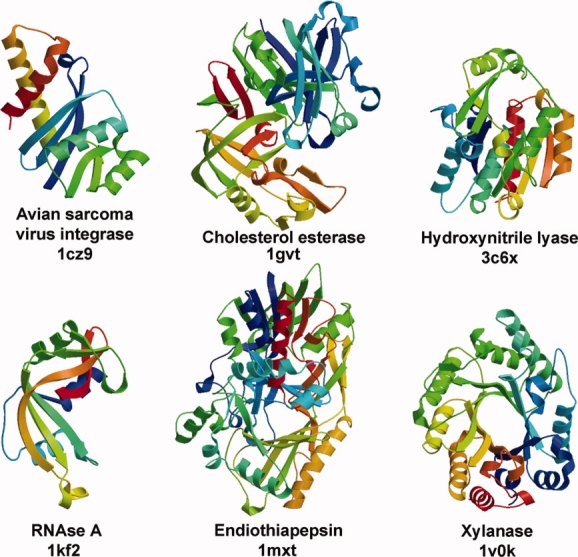
Ribbon diagrams of representative structures. Each of these proteins was analysed as a set of structures with different ligands or under different conditions. The coloring is in rainbow fashion starting with the N-terminus in blue.
General tendencies
To track possible effects from the crystallographic refinement strategy, we analysed models containing hydrogen atoms separately. However, as there was no detectable difference, the statistics referred to hereafter were obtained from the entire set of 140 structures. The classifiers used in the analysis (see Methods) do not depend on crystallographic resolution, data completeness, protein size, atomic anisotropy, lattice symmetry or space group. This indicated that the adaptive setting of them worked well and indeed reflected the intrinsic structural mobility.
One might have expected wedges of missing X-ray data to affect the structure refinement and thus also the anisotropic ADPs. However, we found only a hardly significant correlation (10%) between the atomic anisotropy and the completeness of the data. This may in part be due to the threshold of 90% (the average completeness for all structures is at 94%). Also, we could not detect any correlation between average atomic anisotropy, overall molecular anisotropy and the resolution to which the structures were refined.
No robust tools yet exist for a thorough analysis and validation of the values of anisotropic ADPs and hence their accuracy is, as of now, practically unattainable. For estimating the reliability of the obtained directions of motion we looked at the three rigidly covalently connected atoms pairs within each residue (N—Cα, Cα—C, and C—O) and their vectors of principal directional motion, vpdm. We found that their correlation values fall within a small range which is about twice narrower than the one obtained for the correlation values for neighbouring residues. Interestingly, this was independent on the tightness of the restraints used in the refinement. A validation test that we carried out on a small subset of structures, where these restraints were artificially altered, resulted in no significant changes in variation of the vpdm components within each residue.
As detailed in the Methods section, we define blocks as sets of consecutive residues moving concerted (see Fig. 2). The first residue in each block we call a node. A conserved node is a residue that is a node in all structures of a subset. Blocks were assembled into larger units called (molecular) fragments if they were close in space and their direction of motion was similar.
Figure 2.
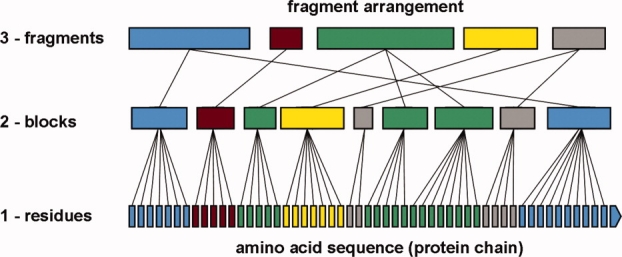
Outline of the motion fragment assignment procedure. It starts from the sequence of residues (1), finding blocks along them (2), and finally combining the blocks into (molecular) fragments (3).
The majority of the structures shows a distinct pattern of fragmentation and reflect ligand binding or changes in the environment (Figs. 3–5). In addition, the derived fragments mirrored well the molecular architecture, as can be seen from the example of a xylanase with the TIM barrel fold (Fig. 6). In some cases the block and fragment boundaries correspond to the domain boundaries.
Figure 3.
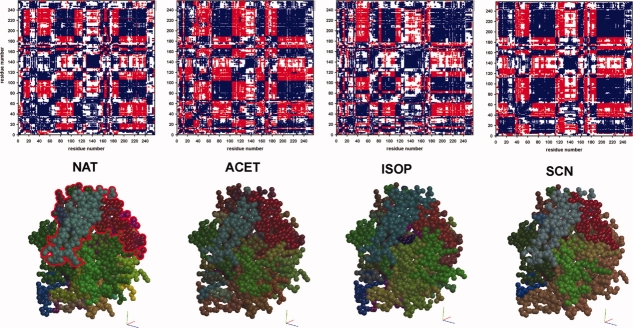
Matrix plots (top row) and directions of motion (bottom row) for the hydroxynitrile lyase (HNL) structures. Top row: The residue-based matrix plots show in-phase motion in blue, antiphase motion in red. Bottom row: For the CPK models the XYZ components of the residue-averaged νpdm were translated into RGB color code, as described in Ref. 12, so that the color hue indicates the direction of motion and the brightness the anisotropy. The division into “hydrolase domain” and “cap domain” (bottom left; outlined, top part of the molecule) remains visible (see also Fig. 4).
Figure 5.
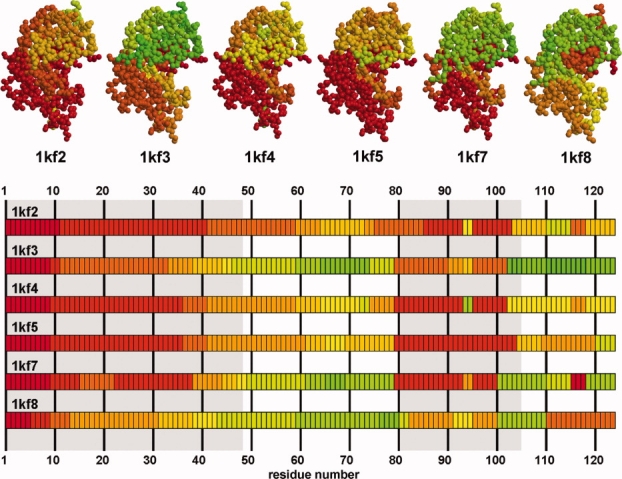
Fragment assignment for the six atomic resolution structures of RNAse A.19,20 The representation and coloring is the same as for Figure 4. The division into two subdomains is indicated by gray shading. Subdomain 1, underlain in gray, shows further fragmentation upon increase of pH (left to right in the top row, top to bottom in the sequence maps).
Figure 6.
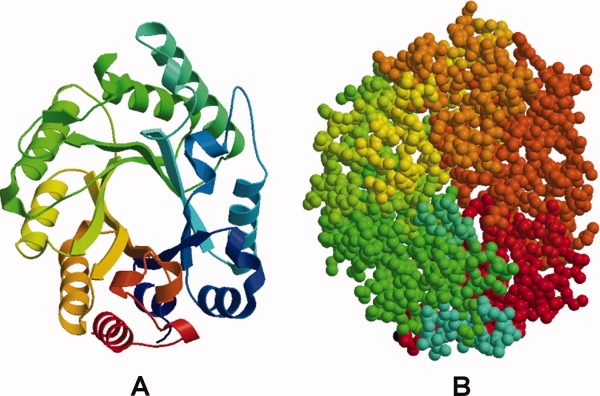
Structure of a xylanase (1v0k, example 4) showing the TIM barrel architecture of the molecule. (A) Represented as a rainbow colored ribbon as in Figure 1. (B) Colored for fragment numbers as in Figure 4.
Ligand binding and environmental effects
Upon ligand binding an overall motion pattern is generally retained. At the same time some residues undergo distinct changes in the direction of motion. A few examples are described below.
Example 1: avian sarcoma virus integrase (EC 2.7.7.49; transferases)
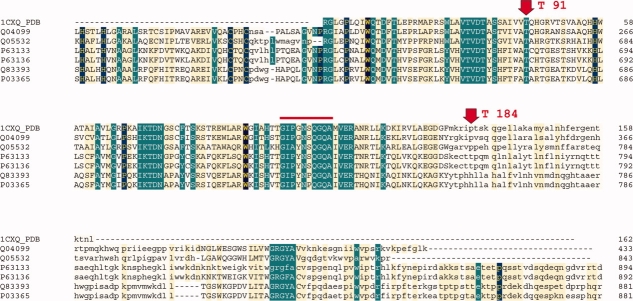
This enzyme facilitates the incorporation of the reverse transcribed viral DNA into the host genome in two steps, called “processing” and “joining”.13 The protein was considered to be generally quite flexible. Three structures (PDB-IDs: 1cxq, 1czb and 1cz9) constituted this set: one mutant and two wild-type structures determined at different pH. A prominent feature in this protein is the highly mobile loop (residues 145–154) covering the active site (Fig. 7). This loop is only visible in the mutant structure (1cz9).13 Our fragmentation pattern analysis identified residues 91 and 184 as conserved nodes. The stretch 145 to 164 appears as one single block and one fragment in the complete mutant structure (1cz9, Fig. 7) but in the models where the residues 146 to 151 are missing (1cxq and 1czb) it breaks up into four blocks (four fragments) in 1czb and three blocks (two fragments) in 1cxq. In 1cz9, the active site loop shows high anisotropy values. As these residues belong to one motion fragment (Fig. 8), this confirms the motion proposed by the authors.13
Figure 7.
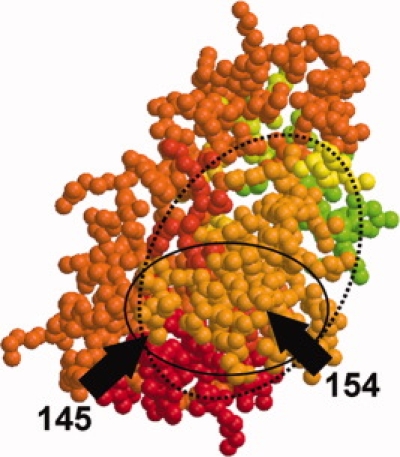
The structure of avian sarcoma virus integrase (1cz9, example 1) in the orientation where the active site loop (full circle) can be seen. Start and end residues of the loop are indicated with black arrows. The loop is part of a larger motion fragment (dashed circle, light orange color).
Figure 8.

Fragmentation pattern for the structures 1cxq, 1cz9 and 1czb (example 3). Fragments are colored as in Figure 4. The loop covering the active site is underlain in gray. The structures where the loop is missing show a higher level of fragmentation as can be seen from the number of occurring colors.
Example 2: cholesterol oxidase (EC 1.1.3.6; oxidoreductases)
Cholesterol oxidase is a flavin-dependent enzyme and its five structures (PDB-IDs: 1mxt, 1n1p, 1n4u, 1n4v, 1n4w14,15) were obtained at different pH values and the effects of pH on the interactions with the flavin moiety were studied. The structures feature a tunnel admitting molecular oxygen to the active centre. Opening and closing of the tunnel is triggered by substrate binding and the flexibility indicated by the presence of main- and side-chain double conformers in that region. The authors also state that conformational changes in two surface loops would be required to admit the substrate. No conformational changes had been observed for the residues directly involved in substrate binding, but their anisotropic ADPs were very high. We found that these residues, Phe 444 and Tyr 446, belong to a small conserved block (i.e., embedded between two conserved nodes) that starts at around residue 442 and ends at residue 452, which also includes the active site His 447.
Example 3: endothiapepsin (EC 3.4.23.22; hydrolases)
These aspartic proteinase structures with different inhibitor complexes (PDB-IDs: 1gvt, 1gvv, 1gvw, and 1gvx16) represent different transition state analogs. Two of the ligand binding residues, Asp 35 and Ser 38, are situated in a highly fragmented region, but still show almost the same direction of motion, while the other two, Asp 219 and Thr 222 flank the conserved node residue Thr 220. Asp 35 moves entirely independently, but Ser 38 moves along with Asp 219 and Thr 222. Asp 35 was shown to be deprotonated in contrast to Asp 21916 and, the higher number of H-bonds involving the neutral Asp 219 is, perhaps, one cause of its concerted motion with the other residues in that region. The close contact between aspartates 35 and 219 might require a shearing motion for their H-bonding interaction to be broken and the one to the inhibitor to be established, which could be the reason for their different directions of motion.
Example 4: xylanase (EC 3.2.1.8; hydrolases)
The four xylanase structures (PDB-IDs: 1v0k, 1v0l, 1v0m, 1v0n17) were determined at two different pH values and with two different inhibitors, analogs of xylobiose. The dynamic properties for these retaining glucosidase structures had previously been inferred only indirectly, as hydrogen atoms could not be seen in the electron density: possible H-bonding patterns gave an estimate of the level of rigidity of the structure. Although no conserved motion nodes have been identified in these structures, they revealed a similar overall block pattern. The molecular organization of a xylanase is depicted on the example of its native structure, where each motion fragment consists of a helix-strand stretch of the TIM barrel, plus there exists an additional fragment containing one of the loops around the active site (Fig. 6). These loops are a unique characteristic of glucosidases and usually define their specificity.18
Example 5: RNAse A (3.1.27.5; hydrolases)
We investigated the structure of RNAse A,19 a rather small protein that displays an alpha–beta roll architecture. Its structure is U shaped with a hinge region linking two subdomains. The hinge angle was shown to depend on the pH (PDB-IDs: 1kf2, 1kf3, 1kf4, 1kf5, 1kf7, 1kf819,20). Our fragmentation analysis reflects this molecular organization into two regions with related directions of motion (Fig. 5). Indeed, subdomain 2 shows antiphase motion to subdomain 1. The N-terminal part, residues 1 to 48, consisted of 3 fragments in 1kf2 and showed further fragmentation at higher pH (Fig. 5).
Example 6: HNL
HNL (E.C. 4.1.2.37; lyases) is an enzyme used in industry for the production of enantiomerically pure cyanohydrins, versatile compounds for a wide variety of applications, such as pharmaceutics and agriculture.21 The enzyme is a compact molecule consisting of a core subdomain featuring an α/β hydrolase fold and a so-called cap domain that forms the access tunnel to the active site.22 The cap domain seems to move apart its two lobes in the native structure (Fig. 3) and in three complexes with substrate analogs thus widening the access tunnel to the active site (PDB-IDs: 3c6x, 3c6y, 3c6z, 3c7023). Our analysis showed that the motion-based division of the structures into two subdomains and the two lobes of the cap domain is visible in all structures, although the directions of motion of these segments may differ depending on the nature of the ligands (Fig. 3). The number of motion fragments is higher for complexes that contain ligands that are structurally close to the natural substrate, acetone and isopropanol (Fig. 4), or were obtained at very low pH (result not shown). This conforms to the requirement of the enzyme to admit the substrates and release the products through the narrow access tunnel. Also, it shows that catalytically relevant flexibility and the mobility near the denaturing state at low pH have similar characteristics.
Figure 4.
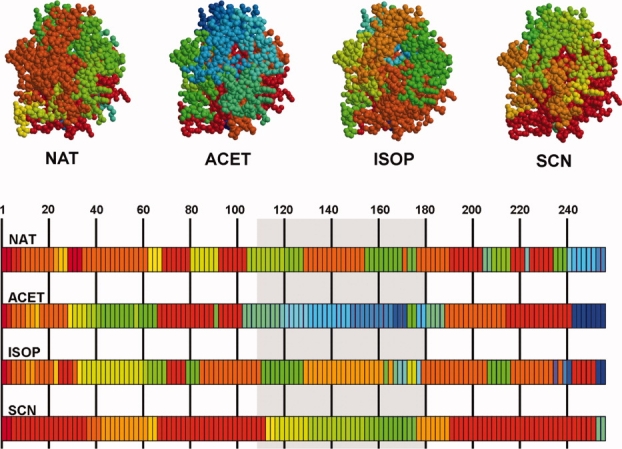
Fragment assignment for HNL structures. Here the colors represent motion fragment numbers, starting at red for fragment number 1 and following a rainbow scheme to orange-yellow-green-blue for higher fragment numbers. The fragment numbering follows the fragment assignment (see Fig. 2). The cap domain (top part of the molecule, see also Fig. 3) is underlain with gray in the lower, sequence part of the figure and distinguishes itself in the structures containing the acetone (ACET) and thiocyanate (SCN) ligands. The structures containing acetone and isopropanol (ISOP) are more fragmented than the other two.
Discussion
Relation to sequence similarity
Here, we used the Examples 1 to 4 which comprised three to five structures of the same protein with different ligands (or no ligand) or at different conditions (pH series). In endothiapepsin (Example 3) we identified five conserved nodes. These were located at the boundaries of highly conserved sequence regions. In case of a xylanase (Example 4) with TIM barrel architecture, we found no conserved nodes. One may speculate that this may be a characteristic of the (very abundant) TIM barrel topology. In an example from the transferase family (Example 1) the two conserved nodes were located at boundaries of conserved regions in the sequence alignment (Fig. 9). Similarly to the xylanase case, the sequence and structure conservation do not entirely coincide, a fact that was also observed using the TLS fragmentation patterns for citrate synthase, HIV-1 reverse transcriptase and aspartate transcarbamylase.24
Figure 9.
Sequence alignment for the 1cz9 structure of avian sarcoma virus integrase, example 1. Dark blue and green shading indicates >50% identity, yellow 30–50% identity. The red arrows point out the motion-conserved nodes in the structures, which lie on the borders of sequence-conserved regions. The red line indicates the loop covering the active site.
We observed that the conserved blocks of molecular motion in a given subset of structures were generally found in regions with low sequence similarity. We attribute this to the fact that the conserved residues are often the ones with high functional relevance and are thus also dynamically important, that is located in flexible regions. For example, in a study by Zheng et al.25 using normal mode analysis, clusters of sequence conserved residues in polymerases were pinpointed as dynamically most important.
Relation to TLS fragments
The structure of human fibroblast growth factor 1 (FGF-1, PDB-ID: 1rg8) was analysed in terms of TLS fragments.26 The structure has a subdomain organization in which strands 1, 4, 5, 8, 9, and 12 form a β-barrel sitting on top of a β-hairpin triplet consisting of strands 2, 3, 6, 7, 10, and 11 (Ref. 26 and Fig. 10). The β strands, of which the structure largely consists, were used as the basis for the TLS fragment definition.26 Two TLS rigid body domains were assigned, one consisting of strands 1 to 5, and the other of strands 6 to 12 (Ref. 26 and Fig. 10). Using our ADP-based motion analysis we identified four fragments in the structure, two of which were large (containing 79 and 48 of the total of 146 residues). In addition, strand 12 and the link to strand 11 form a third, small fragment. Finally, the forth, also small fragment consists of the linker between strands 6 and 7 (residues 68–75) that corresponds to a bridge between the two TLS rigid body domains. The block encompassing residues 76 to 93 covers strand 8 and a well-ordered turn region between strands 8 and 9 that is a key region for the dimerization and receptor binding/recognition in different members of the FGF family.26 Interestingly, the motion fragments deduced from either TLS or the ADP based analysis are different from the commonly assigned domain structure.
Figure 10.

Structure of the human fibroblast growth factor 1. Panel (A) shows the structure colored according to its structural domains with the “top” β-barrel in red and the “bottom” hairpin triplet in blue. While similarities remain, neither TLS (panel C) nor our motion analysis (panel B) fully support this domain definition.
Relation to normal modes
We compared the motion patterns in the structures 1cxq, 1cz9, and 1czb of avian sarcoma virus integrase (Example 1) to normal mode analysis (NMA) using the elNémo web service.27 The normal modes predict possible vibrational modes based on the atomic positions, and are output as a set of vectors describing the average direction of motion for each residue. However, different coordinates systems used in NMA and ADP-based analysis impede direct comparison of vector directions. Another difference is that the ADP-based analysis represents an overlay of several modes of motion, while NMA lists vectors and distance differences for the individual modes. We used the NMA internal correlation patterns of modes 7–11 for comparison to the ADP analysis and found similarities. For example, NMA suggested the residues of the active site loop of the 1czb structure to have similar directions of motion, with correlations between neighbouring residues in the range of 0.92–0.99. Similarly, the adjacent region of residues 156 to 163 shows high correlations of 0.96 to 0.99 in all three structures in the NMA. The sequence conserved block comprising residues 175–183 exhibited common directions in the NMA modeling.
Implications and applications
The analysis of the anisotropic ADPs offers a powerful tool for the retrieval of dynamic properties from a macromolecular model. This information complements the 3D atomic coordinates, reveals the subtle changes that may not be seen by mere structure comparison and may be extremely useful for the investigation of protein-ligand complexes or pH-dependent series. Indeed, in several examples presented here, the r.m.s.d. between the structures did not reveal any significant variations while the direction of motion for the assigned fragments did. Regions of concerted motion can be identified based on classifiers that are independent on protein size or the resolution of the X-ray data (provided it is high enough). The binding state of the substrates and pH has significant influence on the directional motion, which can be derived from a single X-ray structure. If applied to a series of structures containing different ligands, the ADP-based motion analysis may cover a wide range of possible conformations. The approach alone, or in combination with the vibrational modes and binding studies, may lead to a better understanding of the energetics of enzymatic catalysis.
Methods
Extraction of directions of motion
We used a set of 140 protein structures in the PDB that fulfilled the following criteria: data and refinement to atomic resolution (1.2 Å or higher); ANISOU (anisotropic displacement parameter) records present; data completeness of 90% or higher (the average data completeness for all structures is 94%); X-ray data collection at cryogenic temperature. In case of multimers in the asymmetric unit only one protein chain (usually “A”) was analysed and in case of multiple conformers the default (“A”) was used. The average completeness of the 140 data sets is 96%, which matches very well with 94%—the average completeness of over 30,000 X-ray data sets in the PDB represented by the Uppsala Electron Density Server. The subset of protein structures under investigation represented about one-half of the total number of protein structures available to atomic resolution at the time when this work has started (299 by mid-2007; this number has grown to 900 in September 2009). For the remaining structures, either not all selection criteria were fulfilled or the required information could not be derived from the PDB file headers. The extraction of directional motion from the ADPs was carried out as described elsewhere.12 The longest semiaxis vectors of the atomic “thermal ellipsoids” were used as the vpdm. The anisotropy was defined as the ratio of the longest to shortest axis length.12 Ambiguous cases where two or more semiaxes lengths were equal within a 5% margin were filtered out. Ribbon diagrams and CPK models of the structures were created with Molscript28 and Raster3D.29
Averaging
For a residue-based analysis, the vpdm values were determined from the ADP tensors averaged over all atoms within each residue. The same procedure was applied to the block-averaged analysis, where a block was defined as a sequence of consecutive residues showing similar direction of motion. The discrimination between “similar” and “different” directions is described below.
Concerted motion and block assignment
We computed the correlation (absolute value of normalized scalar product) between each pair of vpdm vectors,  The threshold discriminating between “similar” and “different” directions was determined automatically for each structure. The relatively narrow distribution of the normalized scalar products from residue-averaged directions of motion for pairs of consecutive residues served as a measure for the overall intrinsic internal flexibility of the protein molecule and yielded a useful metric. We defined a threshold from the range of correlation values set by the maximum occurring correlation minus the standard deviation for the neighbor scalar products. For smoothing, we employed a method proposed by Yesylevskyy et al.,30 which provided a modified correlation value for each residue pair that is either upweighted or downweighted depending on the correlation that a particular residue has to all others. The threshold was then determined from these modified neighbor scalar products. We validated the threshold values for subsets of structures consisting of the same protein with different ligands or at different pH. Indeed, the threshold values varied only slightly, in the range of 1–5% within one subset. For different (arbitrary) structures, those variations are in the range of 15%. Residue pairs with a scalar product higher than the threshold were defined as moving concerted (with angles between vectors up to ˜30°). A motion block was defined as a continuous region along the protein sequence within which residues move concerted.
Block classification and molecular fragments
Blocks were assembled into larger molecular fragments if they were close in space [determined by their dimensions and distances between their centres of mass (COM) i.e., the sum of their radii was smaller or equal than their COM distances] and displayed similar directions of motion (see also Fig. 2). Sequence alignment using the MacawWin31 program (BLOSUM62 search) against sequences available in Swissprot (ExPASy)32 was used for the comparison of the motion blocks to sequence-conserved regions.
Vector orientation and relative direction of movement
For comparison of the vpdm values between pairs of atoms, residues or blocks we estimated whether their directions are “in-phase” or “out-of-phase”. Rather than carrying out an excessive combinatorial search, we used a simple model for the assignment of the phase. Within one residue, we used distance criteria as the system is small and the standard stereochemistry is rigidly defined. For this, we first scaled the vpdm values by the corresponding equivalent isotropic displacement parameter. By addition and subtraction of these scaled vectors to the atomic coordinates, we created two extreme sets of “boundary structures.” Their stereochemistry (1, 2 distances) within the residues was compared to the target library values33 and to the values in the original coordinate set, and for each atom the boundary position causing less distortion was kept. Then, new “boundary structures” were constructed, their stereochemistry checked and used for visualization and analysis of the motion.
To estimate the relative motion between blocks of residues, we built on the assumption for molecular vibration modes where the lowest energy (lowest frequency) mode is usually a “breathing” or “pumping” motion with respect to the COM. Hence, the directional motion for blocks of residues should take them away from (or towards) their common COM. The directions of the vpdm vectors of the blocks were inspected and their sign set to fulfil this condition (e.g., “all-outwards”). If during this procedure the original direction of the vpdm vectors was reversed then the corresponding phase change was back applied from the blocks through the residues onto the individual atoms. This information is exemplified in the matrix plot to show which blocks move in-phase or antiphase relative to each other (Fig. 3).
Glossary
Abbreviations:
- ADP
atomic displacement parameters
- COM
centres of mass
- TLS
translation, libration, and screw
- TIM
triosephosphate isomerase
- CPK
Corey, Pauling, Koltun (spacefill) model.
References
- 1.Benkovic SJ, Hammes-Schiffer S. A perspective on enzyme catalysis. Science. 2003;301:1196–1202. doi: 10.1126/science.1085515. [DOI] [PubMed] [Google Scholar]
- 2.Lee GM, Craik CS. Trapping moving targets with small molecules. Science. 2009;324:213–215. doi: 10.1126/science.1169378. [DOI] [PMC free article] [PubMed] [Google Scholar]
- 3.Cachau RE, Podjarny AD. High-resolution crystallography and drug design. J Mol Recognit. 2005;18:196–202. doi: 10.1002/jmr.738. [DOI] [PubMed] [Google Scholar]
- 4.Dauter Z, Lamzin VS, Wilson KS. The benefits of atomic resolution. Curr Opin Struct Biol. 1997;7:681–688. doi: 10.1016/s0959-440x(97)80078-4. [DOI] [PubMed] [Google Scholar]
- 5.Schmidt A, Lamzin VS. Veni, vidi, vici: atomic resolution unravelling the mysteries of protein function. Curr Opin Struct Biol. 2002;12:698–703. doi: 10.1016/s0959-440x(02)00394-9. [DOI] [PubMed] [Google Scholar]
- 6.Wilson MA, Brunger AT. The 1.0 A crystal structure of Ca(2+)-bound calmodulan analysis of disorder and implications for functionally relevant plasticity. J Mol Biol. 2000;301:1237–1256. doi: 10.1006/jmbi.2000.4029. [DOI] [PubMed] [Google Scholar]
- 7.Dunitz JD, Maverick EF, Trueblood KN. Atomic motions in molecular crystals from diffraction measurements. Angew Chem Int Ed Engl. 1988;27:880–895. [Google Scholar]
- 8.Dunitz JD, Shomaker V, Trueblood KN. Interpretation of atomic displacement parameters from diffraction studies of crystals. J Phys Chem. 1988;92:856–867. [Google Scholar]
- 9.Harata K, Kanai R. Crystallographic dissection of the thermal motion of protein-sugar complex. Proteins. 2002;48:53–62. doi: 10.1002/prot.10127. [DOI] [PubMed] [Google Scholar]
- 10.Winn MD, Isupov MN, Murshudov GN. Use of TLS parameters to model anisotropic displacements in macromolecular refinement. Acta Cryst. 2001;D57:122–133. doi: 10.1107/s0907444900014736. [DOI] [PubMed] [Google Scholar]
- 11.Watanabe N, Akiba T, Kanai R, Harata K. Structure of an orthorhombic form of xylanase II from Trichoderma reesei and analysis of thermal displacement. Acta Cryst. 2006;D62:784–792. doi: 10.1107/S0907444906017379. [DOI] [PubMed] [Google Scholar]
- 12.Schmidt A, Lamzin VS. Extraction of functional motion in trypsin crystal structures. Acta Cryst. 2005;D61:1132–1139. doi: 10.1107/S0907444905016732. [DOI] [PubMed] [Google Scholar]
- 13.Lubkowski J, Dauter Z, Yang F, Alexandratos J, Merkel G, Skalka AM, Wlodawer A. Atomic resolution structures of the core domain of avian sarcoma virus integrase and its D64N mutant. Biochemistry. 1999;38:13512–13522. doi: 10.1021/bi991362q. [DOI] [PubMed] [Google Scholar]
- 14.Lario PI, Sampson N, Vrielink A. Sub-atomic resolution crystal structure of cholesterol oxidase: what atomic resolution crystallography reveals about enzyme mechanism and the role of the FAD cofactor in redox activity. J Mol Biol. 2003;326:1635–1650. doi: 10.1016/s0022-2836(03)00054-8. [DOI] [PubMed] [Google Scholar]
- 15.Lyubimov AY, Lario PI, Moustafa I, Vrielink A. Atomic resolution crystallography reveals how changes in pH shape the protein microenvironment. Nat Chem Biol. 2006;2:259–264. doi: 10.1038/nchembio784. [DOI] [PubMed] [Google Scholar]
- 16.Coates L, Erskine PT, Crump MP, Wood SP, Cooper JB. Five atomic resolution structures of endothiapepsin inhibitor complexes: implications for the aspartic proteinase mechanism. J Mol Biol. 2002;318:1405–1415. doi: 10.1016/s0022-2836(02)00197-3. [DOI] [PubMed] [Google Scholar]
- 17.Gloster TM, Williams SJ, Roberts S, Tarling CA, Wicki J, Withers SG, Davies GJ. Atomic resolution analyses of the binding of xylobiose-derived deoxynojirimycin and isofagomine to xylanase Xyn10A. Chem Commun. 2004;16:1794–1795. doi: 10.1039/b405152a. [DOI] [PubMed] [Google Scholar]
- 18.Davies G, Henrissat B. Structures and mechanisms of glycosyl hydrolases. Structure. 1995;3:853–859. doi: 10.1016/S0969-2126(01)00220-9. [DOI] [PubMed] [Google Scholar]
- 19.Berisio R, Sica F, Lamzin VS, Wilson KS, Zagari A, Mazzarella L. Atomic resolution structures of ribonuclease A at six pH values. Acta Cryst. 2002;D58:441–450. doi: 10.1107/s0907444901021758. [DOI] [PubMed] [Google Scholar]
- 20.Berisio R, Lamzin VS, Sica F, Wilson KS, Zagari A. Protein titration in the crystal state. J Mol Biol. 1999;292:845–854. doi: 10.1006/jmbi.1999.3093. [DOI] [PubMed] [Google Scholar]
- 21.Johnson DV, Griengl H. Biocatalytic applications of hydroxynitrile lyases. Adv Biochem Eng Biotechnol. 1998;63:31–55. [Google Scholar]
- 22.Wagner UG, Hasslacher M, Griengl H, Schwab H, Kratky C. Mechanism of cyanogenesis: the crystal structure of hydroxynitrile lyase from Hevea brasiliensis. Structure. 1996;4:811–822. doi: 10.1016/s0969-2126(96)00088-3. [DOI] [PubMed] [Google Scholar]
- 23.Schmidt A, Gruber K, Kratky C, Lamzin VS. Atomic resolution crystal structures and quantum chemistry meet to reveal subtleties of hydroxynitrile lyase catalysis. J Biol Chem. 2008;283:21827–21836. doi: 10.1074/jbc.M801056200. [DOI] [PubMed] [Google Scholar]
- 24.Hinsen K, Thomas A, Field MJ. Analysis of domain motions in large proteins. Proteins. 1999;34:369–382. [PubMed] [Google Scholar]
- 25.Zheng W, Brooks BR, Doniach S, Thirumalai D. Network of dynamically important residues in the open/closed transition in polymerases is strongly conserved. Structure. 2005;13:565–577. doi: 10.1016/j.str.2005.01.017. [DOI] [PubMed] [Google Scholar]
- 26.Bernett MJ, Tomassundaram T, Blaber M. An atomic resolution structure for human fibroblast growth factor 1. Proteins. 2004;57:626–634. doi: 10.1002/prot.20239. [DOI] [PubMed] [Google Scholar]
- 27.Suhre K, Sanejouand YH. ElNemo: a normal mode web server for protein movement analysis and the generation of templates for molecular replacement. Nucleic Acids Res. 2004;32:610–614. doi: 10.1093/nar/gkh368. [DOI] [PMC free article] [PubMed] [Google Scholar]
- 28.Kraulis PJ. MOLSCRIPT: a program to produce both detailed and schematic plots of protein structures. J Appl Cryst. 1991;24:946–950. [Google Scholar]
- 29.Merritt EA, Murphy ME. Raster3D Version 2.0. A program for photorealistic molecular graphics. Acta Cryst. 1994;D50:869–873. doi: 10.1107/S0907444994006396. [DOI] [PubMed] [Google Scholar]
- 30.Yesylevskyy SO, Kharkyanen VN, Demechenko AP. Hierarchical clustering of the correlation patterns: new method of domain identification in proteins. Biophys Chem. 2006;119:84–93. doi: 10.1016/j.bpc.2005.07.004. [DOI] [PubMed] [Google Scholar]
- 31.Schuler G. MACAW multiple alignment construction & analysis workbench. Bethesda, MD: National Center for Biotechnology Information (NCBI); 1993. [Google Scholar]
- 32.Gasteiger E, Gattiker A, Hoogland C, Ivanyi I, Appel RD, Bairoch A. ExPASy: the proteomics server for in-depth protein knowledge and analysis. Nucleic Acids Res. 2003;31:3784–3788. doi: 10.1093/nar/gkg563. [DOI] [PMC free article] [PubMed] [Google Scholar]
- 33.Engh RA, Huber R. Accurate bond and angle parameters for X-ray protein structure refinement. Acta Cryst. 1991;A47:392–400. [Google Scholar]


