Abstract
An ad hoc bioconjugation/fluorescence resonance energy transfer (FRET) assay has been designed to spectroscopically monitor the quaternary state of human thymidylate synthase dimeric protein. The approach enables the chemoselective engineering of allosteric residues while preserving the native protein functions through reversible masking of residues within the catalytic site, and is therefore suitable for activity/oligomerization dual assay screenings. It is applied to tag the two subunits of human thymidylate synthase at cysteines 43 and 43′ with an excitation energy donor/acceptor pair. The dimer–monomer equilibrium of the enzyme is then characterized through steady-state fluorescence determination of the intersubunit resonance energy transfer efficiency.
Keywords: human thymidylate synthase, oligomeric proteins, dimer–monomer equilibrium, fluorescent probes, FRET, active-site masking
Introduction
TS (EC 2.1.1.45), which is encoded by the TYMS gene in humans, catalyses the conversion of 2′-deoxyuridine-5′-monophosphate (dUMP) to 2′-deoxythymidine-5′-monophosphate (dTMP) by using N5,N10-methylenetetrahydrofolate (mTHF), as a cosubstrate. dTMP is then phosphorylated by thymidylate kinase to 2′-deoxythymidine diphosphate (dTDP) and then to 2′-deoxythymidine triphosphate (dTTP) by nucleoside kinases for DNA synthesis. Thus, in human cells, TS plays a key role in the biosynthetic pathway that provides the sole de novo source of thymidylate, an essential precursor required for DNA replication and repair. Downregulation of this pathway halts cellular replication and leads to apoptosis of rapidly dividing cells, such as tumoural ones;1 so, TS inhibitors act as anticancer agents. TS performs at least two different functions with specific interaction regions: M2 represents the dimeric obligate catalytic species, while the monomer (M) is believed to play a crucial role in TS-mRNA regulation.2–4 Therefore the characterization of the dimer–monomer equilibrium is of undeniable importance to describe the cellular roles of the two different protein forms. So far, dimer–monomer conversion of human thymidylate synthase (hTS) was only observed by ultracentrifugation.5
Classical physical techniques employed to study the oligomerization state of biomolecules, including gel-filtration, dynamic light scattering, or analytical ultracentrifugation, are slow, non-real time, non-in situ methods that usually provide gross information without addressing molecular-scale details. On the other hand, spectroscopic methods combine intrinsically high time- and spatial resolutions. Additionally, they may afford information not only on the aggregation state of oligomeric proteins but also on structural changes induced, e.g., by dissociative inhibitors that interfere with protein aggregation. Among spectroscopic tools, fluorescence (or Förster) resonance energy transfer (FRET) or, slightly more generally, RET has found a huge number of applications in biology, enabling intracellular imaging and providing conclusive evidence for a wide range of molecular-level problems, including, e.g., the assessment of protein and nucleic acid structure and dynamics and of the structural consequences of macromolecule-ligand binding.6–8 Protein–protein interactions have been frequently monitored employing FRET between either organic fluorophores conjugated to different proteins or genetically encoded fluorescent fusion proteins, acting either as donors and acceptors or only as acceptors with bioluminescent donors.9,10 FRET between protein tryptofan residues and an extrinsic probe has been employed to monitor unfolding of Lactobacillus casei thymidylate synthase.11,12 However, to our knowledge, no FRET-based characterization of the dimer–monomer equilibria of dimeric proteins, including hTS, has yet been reported.13
In this article, we present a spectroscopic approach for noninvasive, real-time accurate assessment of the dimer–monomer equilibrium of hTS based on a selective allosteric functionalization of the protein with an excitation energy donor/acceptor pair. Because enzymes are evolutionarily encoded to bind ligands in their active sites, chemical derivatization designed for allosteric sites will also involve residues of the same type within the catalytic pocket, thereby affecting activity. Hence, to achieve the desired selectivity without losing enzyme function, a strategy involving reversible masking of the catalytic pocket has been designed. We have thus obtained a doubly-tagged active enzyme whose dimer–monomer equilibrium can be monitored in real time with a FRET-based assay. To test the quantitative potential of our approach, we have evaluated the dimer dissociation constant of hTS by measuring the efficiency of FRET between the two bound fluorophores and correlating it with the equilibrium fraction of protein dimers.
Results and Discussion
hTS conjugation with fluorescent probes
TS is an obligate homodimer with two active sites, each formed by residues from both monomers [Fig. 1(A)]. In each monomer, there are two main domains: one larger, conserved domain (residues 1–98 and 130–313, Homo sapiens sequence number) and one smaller, variable domain (the small domain (SD), residues 99–129, Homo sapiens sequence number). Each monomer shows an alpha and beta fold (α+β) with 8 β-strands, 2 310-helices, and 5 α-helices in the large domain. A five stranded β-sheet in each large domain forms the dimer interface. C195 in the catalytic loop (CL, residues 184–199, Homo sapiens sequence number) is the catalytic amino acid that reacts with carbon C6 of dUMP, forming the covalent complex. Other important regions that can be recognized in the enzyme structure are the loop at the interface (HIL, residues 144–158 in Homo sapiens sequence), the loop around R50 (R50, residues 47–54 in Homo sapiens sequence) and the C-terminal region (CT, residues 308–313 in Homo sapiens sequence).
Figure 1.
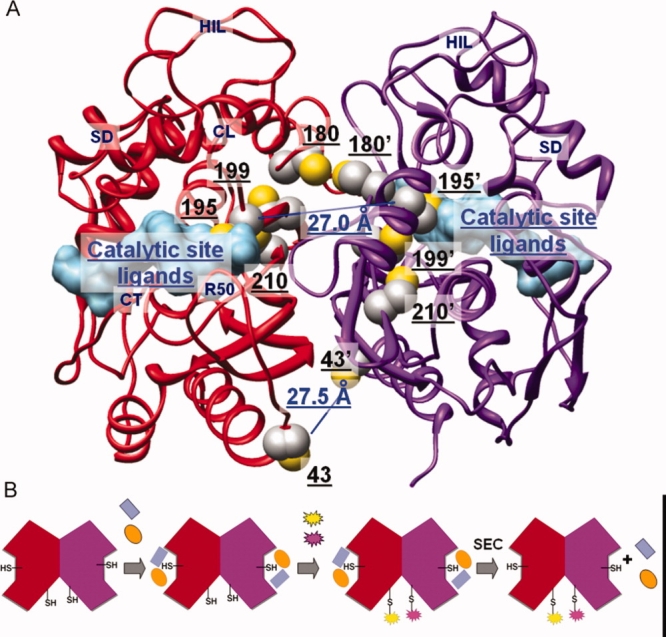
(A) Human thymidylate synthase structure (PDB: 1hvy). The two monomers (ribbon representation) are colored in red and purple, respectively. Ligands in the catalytic active site (surface representation) are colored in light blue. Side chains of cysteine residues (sphere representation) are colored by atom: C in gray, S in yellow. Distances between the S atoms of the C43/C43′ and C195/C195′ pairs are highlighted in blue. (B) Schematic walkthrough of the conjugation process: the two monomers of the dimeric protein are shown in red and purple; the two active-site ligands used to mask the active-site cysteine residues are in blue and orange, the fluorescent probes in yellow and magenta; SEC = Size exclusion chromatography. [Color figure can be viewed in the online issue, which is available at http://www.interscience.wiley.com.]
Cysteine (C) residues are largely exploited as conjugation tethers, as they are under-represented in proteins and feature a peculiar reactivity.14,15 Five native C residues are present in each hTS monomer, although only C43 and the catalytic C195 are exposed in the active dimer [Fig. 1(A)]. C180 lies at the M/M interface and is accessible only when the protein adopts its inactive conformation, in which the catalytic loop is rotated by 180°.16,17 A site-specific conjugation protocol has been designed for the purpose of tagging hTS at C43/43′. The catalytic cysteines were masked with the TS inhibitors 5-fluoro-2′-deoxyuridine-5′-monophosphate (FdUMP) a dUMP competitive ligand with a Ki = 0.17 μM,16,17 and methotrexate, a weak inhibitor (Ki = 13 μM) competitive with the mTHF cofactor.18 The overall Kd of the metastable ternary complex is around 10 μM, a value apt to make C195/195′ masking reversible. Besides allowing for a full masking of the TS active site, formation of this ternary complex stabilizes the active dimeric form of the protein, making C180 not accessible.19 Graphical analysis of the 3D structure of the active conformer (pdb entry 1hvy) indicate that the reactive C43-C43′ residues are 27.5 Å apart. Fluorescein (F, donor) and tetramethylrhodamine (T, acceptor) were chosen as the fluorescent tags for two reasons: (i) due to the extensive F-emission/T-absorption spectral overlap, which corresponds to a Förster's critical distance, R0, twice as large as the C43-C43′ distance,20 F-to-T FRET efficiency, ϕET, is expected to be close to unity in this system; indeed, assuming the interchromophore distance to coincide with the C43-C43′ distance, r = 27.5 Å, i.e., that linker effects are negligible (see the maleimide structures in Scheme 1), and that the probes may undergo isotropic motion,21 with the well known relationship, ϕET = 1/[1+(r/R0)6],20 we calculate ϕET = 0.985; (ii) the commercially available maleimides of the two fluorophores easily bind to the accessible cysteines by exploiting the reactivity of such a functional group towards thiols, with which it forms stable thioether bonds. A known disadvantage of fluorescein is that its spectroscopic and photophysical properties depend on pH because of the acid–base dissociation equilibrium involving the OH substituent (pKa ∼ 6.5).22 Therefore, all spectroscopic experiments were carried out in phosphate buffer at the carefully controlled pH = 7.5; in these conditions about 90% of fluorescein molecules are present in the dissociated, highly fluorescent form.
Scheme 1.
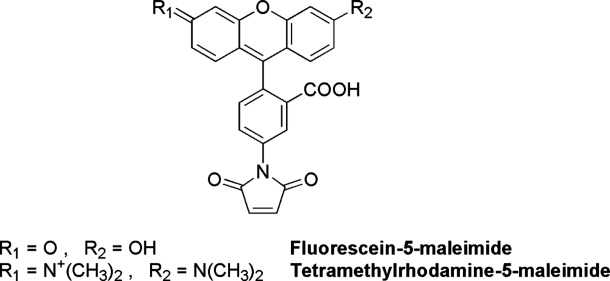
The tagging scheme [Fig. 1(B)] was run in a one-pot procedure either with F or T maleimides to produce the homo-difunctionalized enzyme (F-M2-F or T-M2-T, respectively), or with an equimolar mixture of the probes leading to a hetero-difunctionalized protein (hTS-2P). The visible portion of the absorption spectrum of hTS-2P could be fitted as the sum of the color bands of F and T at similar concentrations (0.42 and 0.40 μM for the case in Fig. 2). This implies that the two maleimides have very similar reactivities towards the accessible C, a conclusion supported by ESI-QTOF mass spectrometric analysis, which shows F-M and T-M +42 extracted ion current peaks having the same areas. The selectivity of conjugation at sites 43/43′ was further validated by enzymatic digestion and MALDI mass-fingerprinting: probe-containing tryptic fragments CGVR 43–46 were clearly identified (details are provided in the experimental section).23 On the other hand, the other cysteine thiols were found to be modified as carboxyamidomethyl moieties, proving they were free before digestion. Furthermore, from the protein contribution to the absorption band at 280 nm (Fig. 2) and the molar extinction coefficient of the protein at 280 nm (ɛ280 = 89000 M−1 cm−1), we calculate a protein dimer concentration very close to the fluorescein and to the tetramethylrhodamine concentrations, thus indicating that one probe was bound per protein monomer. All this evidence points to a statistical composition of the hTS-2P samples: F-M2-F (25%) + T-M2-T (25%) + F-M2-T (50%).
Figure 2.
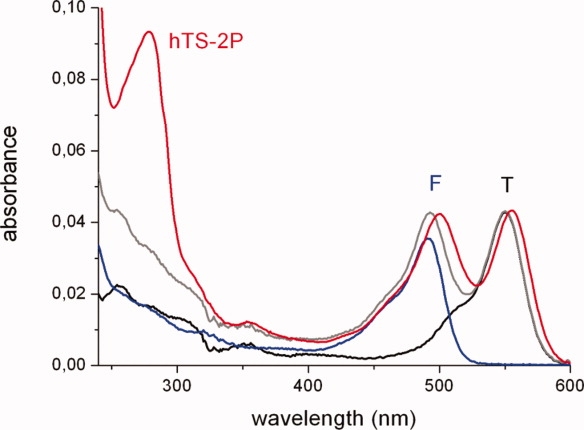
Absorption spectra of the two probes, F (blue curve) and T (black), and of the bis-labeled hTS, (hTS-2P, red). In gray: sum of the suitably scaled (based on maximum extinction coefficients of, respectively, 79000 and 103000 M−1 cm−1) F and T spectra. [Color figure can be viewed in the online issue, which is available at http://www.interscience.wiley.com.]
Conjugation with the two probes did not alter the catalytic activity of the protein. Michaelis Menten parameters (kcat = 0.7 s−1;KM mTHF = 7.15 μM; KMdUMP = 3.3 μM) were found to be consistent with the wild type hTS behavior. So, with respect to other previously reported approaches for site-specific chemical modification that exploit deep protein engineering, including primary structure mutation and introduction of non-native motifs,24–32 this strategy works simply with a one-pot reaction on the native protein, preserves its activity and employs a more straightforward and fast conjugate isolation process. Consistency of the kinetic parameters of the labeled and unlabelled proteins also indicates that, at the kinetic assay concentration (0.7–1 μM), the two proteins were present with the same dimer/monomer compositions and that the attached probes have not significantly modified the energetics of dimer dissociation.
Fluorescence characterization of doubly-tagged hTS
Occurrence of F-to-T FRET in F-M2-T is demonstrated by fluorescence spectra. Preferential excitation of F at 450 nm in an equimolar mixture of F-M2-F and T-M2-T results in a weak T emission (λmax = 578 nm) due to direct excitation of the latter and F-to-T radiative transfer [black line in Fig. 3(A)]. On the contrary, a strong FRET-induced T emission is observed with hTS-2P [Fig. 3(A), hTS-2P]. Complementary but less pronounced evidence of FRET is provided by excitation spectra [Fig. 3(B)]: the F contribution to emission at 610 nm (λmax = 502 nm) for hTS-2P (red line) is more than twice as large as for the equimolar F-M2-F/T-M2-T mixture (black line). The F-to-T FRET efficiency, i.e., the fraction of excited F molecules in heterodisubstituted hTS (F-M2-T), which decay by transferring their excitation energy to their T counterparts, ϕET, may be estimated by quantitative analysis of the emission spectra as described in detail in the experimental section. Use of Eq. (1) for three samples of doubly-tagged hTS obtained from different conjugations yielded a ϕET around 1 (± 0.25).
Figure 3.
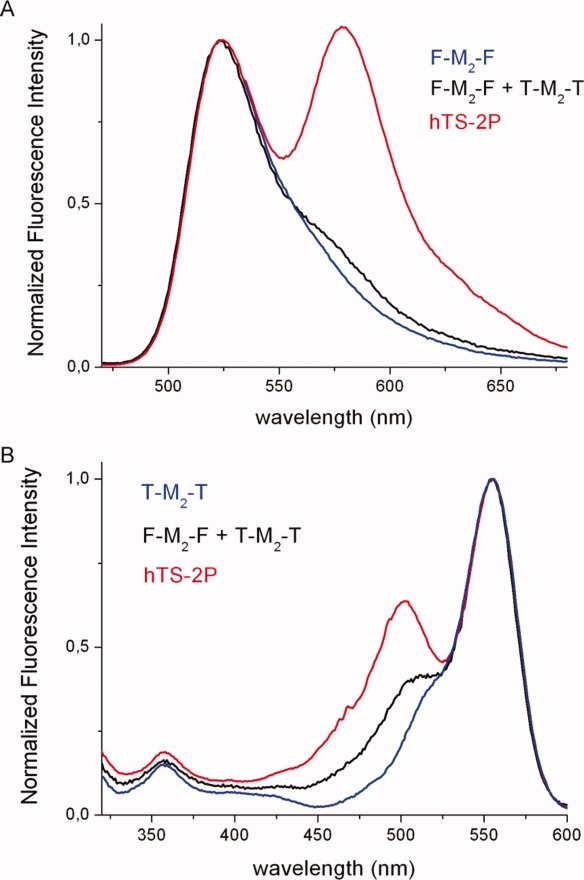
(A) Fluorescence emission spectra of the fluorescein-labeled hTS (F-M2-F, blue curve), of an equimolar mixture of F-M2-F and T-M2-T (T = tetramethylrhodamine, black) and of the hetero-dilabeled protein (red, hTS-2P). (B) Fluorescence excitation spectra (λem = 610 nm) of the T labeled TS (T-M2-T, blue curve), of an equimolar mixture of F-M2-F and T-M2-T (black) and of the dilabeled protein (hTS-2P, red). The spectra have been normalized, respectively, to the F emission (524 nm) and T excitation (555 nm) maxima for ease of comparison. [Color figure can be viewed in the online issue, which is available at http://www.interscience.wiley.com.]
Consistently with the F-to-T FRET in hetero-ditagged dimers being complete, single-photon counting measurements revealed very similar time-resolved fluorescence behaviors for F-M2-F, an F-M2-F/T-M2-T equimolar mixture and hTS-2P (respectively, blue, black, and red dots in Fig. 4). All decays at 525 nm (F emission alone) were well-fitted as single exponentials with lifetimes of 4.4, 4.3, and 4.2 ns, respectively. The three residual distributions were similar with no significant difference at early delay times for the hetero-ditagged enzyme with respect to the fluorescein dilabeled dimers. These observations indicate any residual, shortened F emission from F-M2-T to be undetectable in our experimental conditions. From the given lifetimes, setting ϕET > 0.9, we obtain a lower limit for the F-to-T energy transfer rate constant, kET > 2 x 10⁹ s−1, and a corresponding upper limit for the F/T distance in F-M2-T, r < 38 Å, consistent with the C43-C43′ crystallographic distance of 27.5 Å (details of these estimations are provided in the Materials and methods section).
Figure 4.
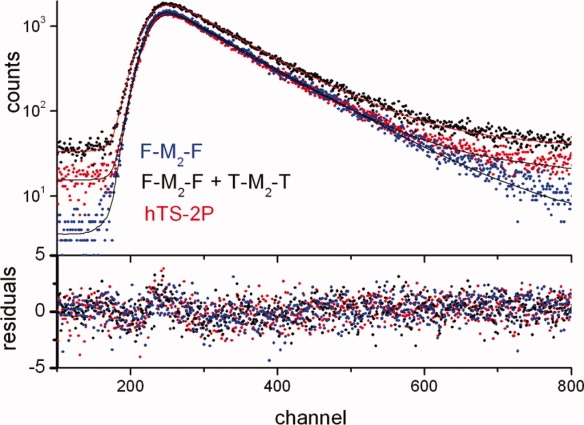
Single-photon counting emission time profiles (top, λex = 480 nm, λem = 525 nm) and corresponding residues (bottom) of an equimolar mixture of F-M2-F and T-M2-T (black), of the dilabeled protein (hTS-2P, red) and of the F labeled TS (F-M2-F, blue). 1 channel corresponds to 51 ps. [Color figure can be viewed in the online issue, which is available at http://www.interscience.wiley.com.]
The suitability of the described spectral FRET evidence to reveal F/T proximity in hTS was proved by denaturation experiments. Unfolding of hTS-2P with urea resulted in almost full loss of the FRET fingertip (i.e., of the T emission upon F excitation at 450 nm, Fig. 5). Ten-fold dilution (1:10) of the unfolded sample led to protein refolding and almost full FRET recovery.
Figure 5.
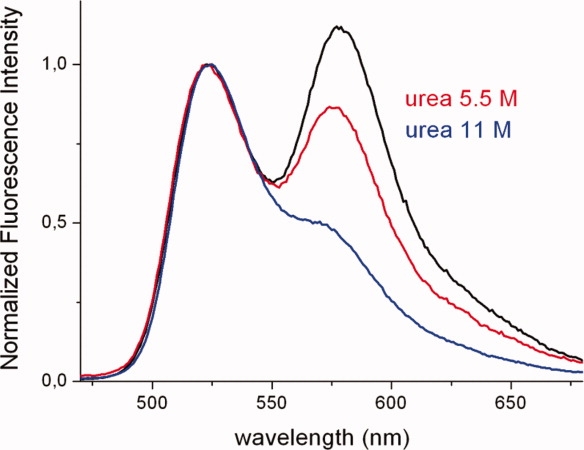
Emission spectra of hTS-2P exposed for 3 h to urea at concentrations 0M (black), 5.5M (red), and 11M (blue). All spectra have been normalized at the F emission maximum (524 nm) for ease of comparison. [Color figure can be viewed in the online issue, which is available at http://www.interscience.wiley.com.]
Dimer–monomer equilibrium constant evaluation
Changes in the M/M2 equilibrium composition with total protein concentration were monitored using FRET with hTS-2P and fluorescence anisotropy with F-M2-F (Fig. 6). The parallel decrease of FRET efficiency and F emission anisotropy at protein concentrations below ∼100 nM reflects an increase in the dimer equilibrium dissociation degree in agreement with ultracentrifugation data which show the onset and growth of the monomer band only at hTS concentrations lower than about 5 μg/mL, roughly corresponding to 70 nM.5 Quantitative analysis of FRET efficiencies as functions of total hTS concentration can yield the dimer dissociation equilibrium constant as described in detail in the experimental section. The data fitting to Eq. (2) [the ϕET vs. (ϕET/CT)1/2 plot is in the inset to Fig. 6(B)] yielded a dissociation equilibrium constant K = 2 x 10⁻⁷M at 22°C, corresponding to a ΔG° ∼ 38 kJ mol−1. According to the scanty ultracentrifugation data provided in reference,5 comparable abundances of dissociated and associated protein dimers were probably obtained at a protein concentration around 2.5 μg/mL, i.e., 35 nM. This would afford an estimate of K around 7 x 10⁻⁸ M, only slightly smaller than our result.
Figure 6.
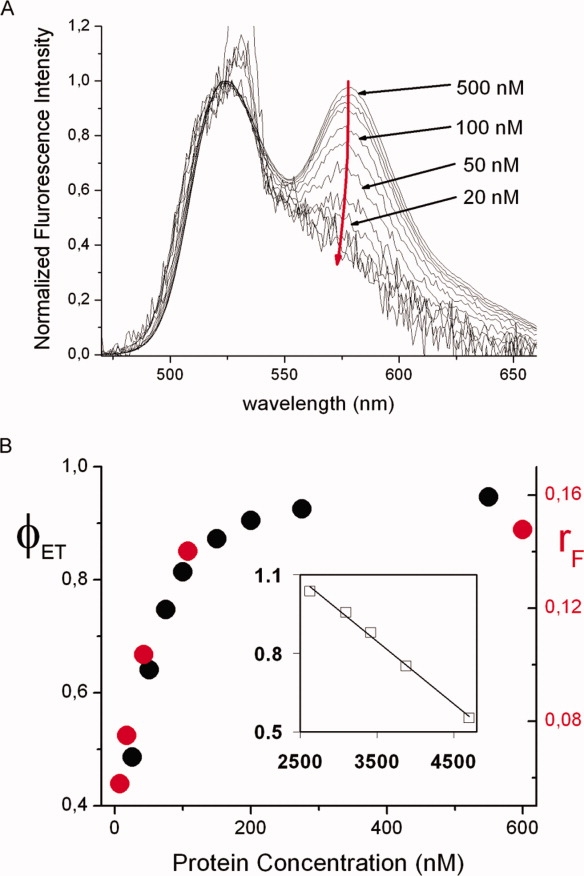
(A) Decrease of FRET (red arrow) with decreasing total hTS-2P concentration (some values are reported). (B) Dependence of FRET efficiency of hTS-2P (ϕET, black circles and left axis) and of the fluorescence anisotropy of F-M2-F (rF, red circles and right axis) on the total concentration of protein dimers and (inset) plot of ϕET vs. (ϕET/CT)1/2 from Eq. (2) in the experimental section. λex = 450 nm (the ‘spike’ at ca 530 nm is a solvent Raman band), T = 22°C. All spectra have been normalized at the F emission maximum (524 nm) for ease of comparison. [Color figure can be viewed in the online issue, which is available at http://www.interscience.wiley.com.]
Concluding Remarks
The approach proposed here exploits intermonomer probe-to-probe FRET efficiency evaluation for real-time, noninvasive quantitative monitoring of the oligomerization state of hTS. The strategy adopted for site-specific chemical modification of the enzyme preserves its catalytic activity and works simply on the native protein, unlike existing methods.24–32 So, the fluorometric analysis can be combined with standard activity assessments in a single spectroscopic screening assay of the oligomeric and functional states (dual assay format). The strategy can be adapted to other oligomeric molecular targets that have unwanted reactive side chains in high-affinity pockets, whenever reversible protection of such residues by substrate-like and/or inhibitor-like compounds can be achieved. The assay is also meant for the focused- to high-throughput screening of inhibitor libraries: its testing on a multiplate reader is currently underway.
Materials and Methods
hTS single or double probe conjugation
Purified human thymidylate synthase33 (hTS, 100 μL, 55 μM (referred to dimeric protein) in 20 mM KH2PO4, 30 mM NaCl, 1 mM EDTA, pH 6.8) was left incubating for 10′ at room temperature with a mixture of FdUMP (27.5 μL, 10 mM solution in water, 50-fold molar excess with respect to the protein amount) and methotrexate (55 μL, 5 mM solution in water, 50-fold molar excess with respect to the protein amount), allowing the metastable ternary complex to reach its equilibrium. A solution of the selected fluorophore (fluorescein maleimide or tetramethylrhodamine maleimide, 11 μL, 2.5 mM in DMSO, in 5-fold molar excess with respect to protein amount) was then added and the mixture was left reacting for 30′ at the same temperature. Alternatively, to obtain a double probe heterodimer, 10 μL of each probe solution were mixed together and then 11 μL of the mixture were added to the methotrexate FdUMP protein complex. Unreacted probe(s) was quenched with dithiothreitol (10 μL, 500 mM solution in water) and the mixture was purified by size exclusion chromatography on a sephadex G25 column with isocratic elution using a 20 mM KH2PO4, 30 mM NaCl, 1 mM EDTA, pH 7.5 buffer. Head fractions were analyzed by HPLC-ESI/MS, pooled and characterized in terms of concentration, spectroscopic profile, and enzymatic activity before use.
Activity assay
The catalytic activity of the engineered enzyme was evaluated by a spectrophotometric assay, monitoring the conversion of mTHF to dihydrofolate which is accompanied by an enhancement of the optical density at 340 nm. Engineered purified thymidylate synthase (hTS-2P, 20 mM KH2PO4, 30 mM NaCl, 1 mM EDTA, pH = 7,5) was diluted at a concentration of 0.7–1 μM and treated with a saturating concentration of mTHF (100 μM). dUMP (100 μM) was finally added to start the reaction which was followed for 180 s.
MS conjugate characterization
hTS-2P (10 μM, 20 mM KH2PO4, 30 mM NaCl, 1 mM EDTA, pH = 7.5) was diluted at a concentration of 100 nM with formic acid (0,5% v/v in water) and analyzed with a ESI Nano-HPLC QTOF Mass Spectrometer (Micromass, Waters) with a 200 nL/min linear 5–30% acetonitrile gradient on an Atlantis 150 mm x 75 μm C18 column. Obtained spectra were deconvoluted and were consistent with the anticipated MW ranges. To validate the conjugation site, hTS-2P was digested with porcine trypsin: briefly, 10 μL of protein were added to a mixture of 15 μL of NaHCO3 25 mM and 15 μL DTT 100 mM, the sample was incubated for 5′ at 95°C and, after cooling down, was treated with 5 μL iodoacetamide 100 mM and left reacting in the dark for 20′. Porcine trypsin (1 μL, 1 μg/μL in 50 mM AcOH) was then added and the mixture was incubated for 3 h; after adding an additional μL of this solution, the tube was left standing at room temperature overnight.
Resulting peptides underwent MALDI-TOF-TOF (Applied Biosystems) mass fingerprinting;23 the MS spectra obtained were analyzed with ALDENTE [http://www.expasy.org/tools/aldente], confirming that the conjugation involves only the C43 residue; the fragment including this residue (CGVR, [MH+]: 434.53) is, indeed, recognized with the additional mass contribution of the probes (F and T) in their hydrated forms with the succinic ring opened (mass values of 879.91 and 935.06, respectively). MS/MS spectra of the two conjugated parent peptides were manually inspected and annotated.34
Spectroscopic measurements
UV-vis absorption spectra were measured on a Varian Cary 100 double-beam spectrophotometer using quartz cuvettes of 1, 0.2, or 0.1 cm pathlengths. Fluorescence spectra were obtained with a Spex Jobin-Yvon Fluoromax2 spectrofluorometer. The spectra were corrected for the instrumental spectral sensitivity. All spectroscopic experiments were carried out at room temperature, 22 ± 2°C. We repeatedly checked the shapes of the emission spectra of the two probes conjugated to hTS and made sure that no observable change attributable to probe aggregation occurred in the concentration range employed for this study.
Evaluation of FRET efficiency from fluorescence emission data
The efficiency of FRET (ϕET), i.e., the fraction of excited F molecules in heterodisubstituted hTS (F-M2-T), which decay by transferring their excitation energy to their T counterparts, can be obtained by measuring the ratio of the areas of the emission spectra of F (aF) and T (aT) corrected for the spectrofluorometer spectral sensitivity curve. It is simple to see that, for a mixture of F-M2-F (F2), F-M2-T (FT), and T-M2-T (T2), this ratio can be expressed in terms of the absorption rates, Ia, and of the fluorescence quantum yields (φ) of the two probes bound to hTS (φ = 0.6 and 0.3 (±20%) for F and T in F2 and T2 respectively, measured relative to free fluorescein dianion in 10−4M NaOH (φ = 0.95)35 as:
Given the very low absorbance at the excitation wavelengths, λex, the rates of absorption can be approximated as IaX = IincAX, Iinc being the incident number of einsteins per liter per second, which cancels out in the ratio, and AX the absorbance of the F probe due to species X (F2, FT) at λex. If, as suggested by the provided UV-vis and mass spectrometric evidence, the sample composition is the statistical one, i.e., 25% of F2 and 50% of FT, then AF2 and AFT are equal and cancel out too yielding the simplified relation
| (1) |
by which ϕET is easily derived. In the above expression, we have neglected the contributions coming from direct excitation of T, both in FT and in T2, and F-to-T radiative ET. These contributions have been estimated at λex = 450 nm from spectra measured on an equimolar F2 and T2 mixture [black curve in Fig. 3(A)] to be about 10% of the total aT at full energy transfer. Values of aT must therefore be corrected accordingly. Because of the mentioned assumptions and corrections, we estimate a confidence range of about ± 25% for the values of ϕET thus obtained.
Estimation of the maximum F/T distance in F-M2-T
The efficiency of nonradiative energy transfer can be expressed in terms of the corresponding rate constant, kET, as  , where τ0 is the donor lifetime in the absence of the acceptor, 4.4 ns for F. According to Förster's theory,
  , with r the D-A distance and R0 the critical Förster's radius, ca. 55 Å for the F/T pair.20 Given a ϕET larger than about 0.9, the lower limit for kET and upper limit for r given in the text are easily estimated.
Determination of dimer–monomer equilibrium constant from the dependence of ϕET on total protein concentration
The equilibrium constant for the dissociation of the dimer to the monomer, K = [M]2/[M2], is easily expressed in terms of ϕET. In fact, as ϕET is essentially 100% in the FT dimer and 0 for the monomers deriving from its dissociation, F-MFT or M-TFT, ϕET = [F−M2−T]/([F−M2−T] + [F−MFT]), the ratio of the residual FT dimer concentration to the sum of the concentrations of associated and dissociated FT. Under the reasonable assumption that the attachment of the two probes does not affect the protein dimer–monomer equilibrium, the above ratio also represents the fraction of total associated protein dimers (FT+F2+T2), i.e., ϕET = [M2]/([M2]+[M]/2), where the denominator is the total protein concentration expressed as moles of dimer L−1, CT. Then, [M2] = ϕETCT, [M] = 2CT(1- ϕET) and, after replacing in the expression for K and rearranging, we obtain
| (2) |
So, plotting ϕET vs. (ϕET/CT)1/2 we should obtain a linear behavior with a slope -K1/2/2 [see the inset in Fig. 6(B)]. The error associated with K somehow derives from a combination of that provided by the linear data fitting procedure and the confidence range of ϕET. Because each plot refers to values of ϕET measured for the same conjugated protein at different total concentrations, we believe that such values may be over or underestimated by roughly the same percentage and, given the ϕET/ϕET1/2 plot, the error on ϕET should underpropagate into the plot slope and, thus, K.
References
- 1.Liao ZY, Sordet O, Zhang H-L, Kohlhagen G, Antony S, Gmeiner WH, Pommieret Y. A novel polypyrimidine antitumor agent FdUMP[10] induces thymineless death with topoisomerase I-DNA complexes. Cancer Res. 2005;65:4844–4851. doi: 10.1158/0008-5472.CAN-04-1302. [DOI] [PubMed] [Google Scholar]
- 2.Thobhani S, Ember B, Siriwardena A, Boons GJ. Multivalency and the mode of action of bacterial sialidases. J Am Chem Soc. 2003;125:7154–7155. doi: 10.1021/ja029759w. [DOI] [PubMed] [Google Scholar]
- 3.Johnson LF. Posttranscriptional regulation of thymidylate synthase gene expression. J Cell Biochem. 1994;54:387–392. doi: 10.1002/jcb.240540405. [DOI] [PubMed] [Google Scholar]
- 4.Chu E, Voeller D, Koeller DM, Drake JC, Takimoto CH, Maley GF, Maley F, Allegra CJ. Identification of an RNA binding site for human thymidylate synthase. Proc Natl Acad Sci USA. 1993;90:517–521. doi: 10.1073/pnas.90.2.517. [DOI] [PMC free article] [PubMed] [Google Scholar]
- 5.Saxl RL, Maley GF, Hauer CR, Maccoll R, Changchien L, Maley F. Significance of mutations on the structural perturbation of thymidylate synthase: implications for their involvement in subunit exchange. Protein Sci. 2007;16:1439–1448. doi: 10.1110/ps.062509807. [DOI] [PMC free article] [PubMed] [Google Scholar]
- 6.Lakowicz JR. Principles of fluorescence spectroscopy. 3rd ed. Berlin: Springer; 2006. Energy Transfer; pp. 443–472. chapter 13. [Google Scholar]
- 7.Sekar RB, Periasamy A. Fluorescence resonance energy transfer (FRET) microscopy imaging of live cell protein localizations. J Cell Biol. 2003;160:629–633. doi: 10.1083/jcb.200210140. [DOI] [PMC free article] [PubMed] [Google Scholar]
- 8.Jares-Erijman EA, Jovin TM. Imaging molecular interactions in living cells by FRET microscopy. Curr Opin Chem Biol. 2006;10:409–416. doi: 10.1016/j.cbpa.2006.08.021. [DOI] [PubMed] [Google Scholar]
- 9.Yan Y, Marriott G. Analysis of protein interactions using fluorescence technologies. Curr Opin Chem Biol. 2003;7:635–640. doi: 10.1016/j.cbpa.2003.08.017. [DOI] [PubMed] [Google Scholar]
- 10.Piehler J. New methodologies for measuring protein interactions in vivo and in vitro. Curr Opin Struct Biol. 2005;15:4–14. doi: 10.1016/j.sbi.2005.01.008. [DOI] [PubMed] [Google Scholar]
- 11.Gokhale RS, Agarwalla S, Santi DV, Balaram P. Covalent reinforcement of a fragile region in the dimeric enzyme thymidylate synthase stabilizes the protein against chaotrope-induced unfolding. Biochemistry. 1996;35:7150–7158. doi: 10.1021/bi952890e. [DOI] [PubMed] [Google Scholar]
- 12.Agarwalla S, Gokhale RS, Santi DV, Balaram P. Covalent tethering of the dimer interface annuls aggregation in thymidylate synthase. Protein Sci. 1996;5:270–277. doi: 10.1002/pro.5560050211. [DOI] [PMC free article] [PubMed] [Google Scholar]
- 13.Cardinale D, Salo-Ahen OMH, Ferrari S, Ponterini G, Cruciani G, Carosati E, Tochowicz AM, Mangani S, Wade RC, Costi MP. Homodimeric Enzymes as Drug Targets. Curr Med Chem. 2010;17:826–846. doi: 10.2174/092986710790712156. [DOI] [PubMed] [Google Scholar]
- 14.Miseta A, Csutora P. Relationship between the occurrence of cysteine in proteins and the complexity of organisms. Mol Biol Evol. 2000;17:1232–1239. doi: 10.1093/oxfordjournals.molbev.a026406. [DOI] [PubMed] [Google Scholar]
- 15.Carrico IS. Chemoselective modification of proteins: hitting the target. Chem Soc Rev. 2008;37:1423–1431. doi: 10.1039/b703364h. [DOI] [PubMed] [Google Scholar]
- 16.Cardinale D, Salo-Ahen OM, Guaitoli G, Ferrari S, Venturelli A, Franchini S, Battini R, Ponterini G, Wade RC, Costi MP. Design and characterization of a mutation outside the active site of human thymidylate synthase that affects ligand binding. Protein Eng Des Sel. 2010;23:81–89. doi: 10.1093/protein/gzp075. [DOI] [PubMed] [Google Scholar]
- 17.Berger SH, Berger FG, Lebioda L. Effects of ligand binding and conformational switching on intracellular stability of human thymidylate synthase. Biochim Biophys Acta. 2004;1696:15–22. doi: 10.1016/j.bbapap.2003.09.005. [DOI] [PubMed] [Google Scholar]
- 18.Allegra CJ, Chabner BA, Drake JC, Lutz R, Rodbard D, Jolivet J. Enhanced inhibition of thymidylate synthase by methotrexate polyglutamates. J Biol Chem. 1985;260:9720–9726. [PubMed] [Google Scholar]
- 19.Phan J, Koli S, Minor W, Dunlap RB, Berger SH, Lebioda L. Structure of human thymidylate synthase suggests advantages of chemotherapy with noncompetitive inhibitors. Biochemistry. 2001;40:1897–1902. doi: 10.1074/jbc.M009493200. [DOI] [PubMed] [Google Scholar]
- 20.Valeur B. Molecular fluorescence. . Weinheim: Wiley-VCH; 2002. Resonance energy transfer and its applications; pp. 247–271. chapter 9. [Google Scholar]
- 21.dos Remedios CG, Moens PDJ. Fluorescence resonance energy transfer spectroscopy is a reliable “ruler” for measuring structural changes in proteins: dispelling the problem of the unknown orientation factor. J Struct Biol. 1995;115:175–185. doi: 10.1006/jsbi.1995.1042. [DOI] [PubMed] [Google Scholar]
- 22.Lakowicz JR. Principles of fluorescence spectroscopy. 3rd ed. Berlin: Springer; 2006. Paragraph 19.6.2. [Google Scholar]
- 23.Webster J, Oxley D. Peptide mass fingerprinting: protein identification using MALDI-TOF mass spectrometry. Methods Mol Biol. 2005;310:227–240. doi: 10.1007/978-1-59259-948-6_16. [DOI] [PubMed] [Google Scholar]
- 24.Fouche PB, Hash JH. The N,O-diacetylmuramidase of Chalaropsis species. Identificaiton of aspartyl and glutamyl residues in the active site. J Biol Chem. 1978;273:6787–6793. [PubMed] [Google Scholar]
- 25.Pillai RP, Marshall M, Villafranca JJ. Stereochemistry of binding of thiophosphate analogs of ATP and ADP to carbamate kinase, glutamine synthetase, and carbamoyl-phosphate synthetase. Arch Biochem Biophys. 1980;199:16–20. doi: 10.1016/0003-9861(80)90249-0. [DOI] [PubMed] [Google Scholar]
- 26.Planas A, Kirsch JF. Sequential protection–modification method for selective sulfhydryl group derivatization in proteins having more than one cysteine. Protein Eng. 1990;3:625–628. doi: 10.1093/protein/3.7.625. [DOI] [PubMed] [Google Scholar]
- 27.Duff SMG, Lepiniec L, Crétin C, Andreo CS, Condon SA, Sarath G, Vidal J, Gadal P, Chollet R. An engineered change in the l-malate sensitivity of a site-directed mutant of sorghum phosphoenolpyruvate carboxylase: the effect of sequential mutagenesis and s-carboxymethylation at position 8. Arch Biochem Biophys. 1993;306:272–276. doi: 10.1006/abbi.1993.1511. [DOI] [PubMed] [Google Scholar]
- 28.Rashid MH, Siddiqui KS. Carboxy-group modification: high-temperature activation of charge-neutralized and charge-reversed b-glucosidases from Aspergillus niger. Biotechnol Appl Biochem. 1998;27:231–237. [PubMed] [Google Scholar]
- 29.Caliceti P, Morpurgo M, Schiavon O, Monfardini C, Veronese FM. Preservation of thrombolytic activity of urokinase modified with monomethoxypoly(ethylene glycol) J Bioact Compat Polym. 1994;9:252–266. [Google Scholar]
- 30.Qian G, Zhou J, Ma J, Wang D, He B. The chemical modification of E. colil-asparaginase by N, O-carboxymethyl chitosan. Artif Cells Blood Substit Immobil Biotechnol. 1996;24:567–577. doi: 10.3109/10731199609118882. [DOI] [PubMed] [Google Scholar]
- 31.Salmaso S, Semenzato A, Bersania S, Chinol M, Paganelli G, Caliceti P. Preparation and characterization of active site protected poly(ethylene glycol)–avidin bioconjugates. Biochim Biophys Acta. 2005;1726:57–66. doi: 10.1016/j.bbagen.2005.04.025. [DOI] [PubMed] [Google Scholar]
- 32.Jäger M, Nir E, Weiss S. Site-specific labeling of proteins for single-molecule FRET by combining chemical and enzymatic modification. Protein Sci. 2006;15:640–646. doi: 10.1110/ps.051851506. [DOI] [PMC free article] [PubMed] [Google Scholar]
- 33.Pedersen-Lane J, Maley FG, Chu E, Maley F. High-level expression of human thymidylate synthase. Protein Expr Purif. 1997;10:256–262. doi: 10.1006/prep.1997.0750. [DOI] [PubMed] [Google Scholar]
- 34.Aebersold R, Mann M. Mass spectrometry-based proteomics. Nature. 2003;422:198–207. doi: 10.1038/nature01511. [DOI] [PubMed] [Google Scholar]
- 35.Lakowicz JR. Principles of fluorescence spectroscopy. 3rd ed. Berlin: Springer; 2006. Table 2.4. [Google Scholar]


